Date: May 18, 2026
From: An Engineering Leader Who Learned This the Hard Way
To: You, 2025 or early 2026, right before or just after scaling AI inside your engineering team
Hi.
If this reaches you in time, hail to your good deeds.
You’re about to make a big decision for your team.
You are going to introduce AI into your SDLC. (Even if you’ve already done it, this is relevant!)
It will surely feel like making some really good progress, finally.
And it will continue to feel like progress - until your metrics start telling you things which you should not trust.
Those metrics will mean nothing in AI-SDLC.
You won’t know if your team performed well or if it was AI magic.
You won’t know if AI caused a drop in review time or if reviewers skipped depth because AI made the code look clean on the surface.
You won’t know if hotfixes dropped because the code quality improved or AI automatically fixed issues before your team even saw them.
Your metrics will smile at you, and all you will do is smile back!
And then one day, you will realize your mistake - using old engineering metrics in a new AI world!
How ironic it is for engineering leaders to make decisions with data that would never make sense, which are half-cooked, and which show only lies!
So, before you hop on the same wrong boat that I once took just to reach somewhere because everyone else was rushing in the same direction, let me help you hop on the right boat and then correct the direction.
CHAPTER 1 - What Happens When Your Engineering Metrics Get Better… But You Don’t Know Why?
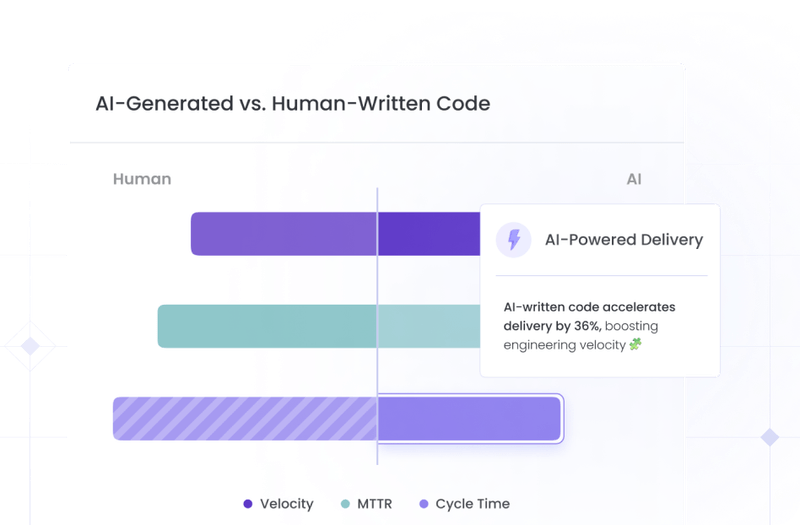
When we rolled out AI coding assistants in mid-2025, every engineering metric hit that sweet spot.
- Cycle Time: Down by 20%
- Review Time: Down by 45%
- Rework: Down by 18%
- Hotfixes: Down by 10%
- Throughput: Up by 37%
It made me feel that my team had evolved overnight, or rather, had evolved beyond human capacity.
But here’s the dangerous part - I wasn’t aware of why these numbers moved.
I could see…
- Tasks were moving faster
- PRs were getting smaller
- Reviews were shorter
But I could not see….
- How much of each PR came from AI
- How many of the AI suggestions were accepted, and what was their downstream impact on cycle time
- How many review-time drops were caused by AI autofixes
- How many hotfixes were avoided because AI fixed code quietly
My dashboard was showing outcomes, not causes. It was showing how AI was being used, but not how AI was actually moving engineering metrics.
But driven by emotions, I didn’t feel the confusion at first. I was very excited by the numbers. That excitement later proved to be my biggest mistake. And you know what, the funny part was, the metrics I once trusted proved me wrong, brutally!
CHAPTER 2: When Metrics Improve, Are You Seeing Progress or Just AI Shadow Work?
A few weeks in, the cracks began to show.
Reviewers were the first to feel it.
“Comments are getting shorter,” one said, “Not because the code is perfect. But because I don’t know how deep I should go. I don’t know what logic belongs to us and what logic belongs to the model.”
Then standups changed. Engineers shared less and skipped details.
“I finished this module earlier than planned. But I can’t tell how much it is written by me vs AI.”
Across the hall, the QA team noticed something else. Defects weren’t predictable anymore. New patterns surfaced - sudden and unfamiliar.
Surely, AI was causing those changes. But neither my team nor I was able to trace AI’s impact back to the engineering metrics that we care about most.
Because our tools couldn’t track…
- How AI influenced cognitive load
- How AI altered team collaboration
- How AI spiked context fragmentation
- How AI impacted PR hygiene practices
We were looking at the progress without understanding its source. It was never AI alone behind all the performing and worsening metrics. That blind spot was a dangerous place to be. It gave us confidence we didn’t earn.
CHAPTER 3: The Metrics Hygiene Problem: You Can’t Tell if Your Metrics Are Real or Just AI-Cleaned Signals!
A few more weeks after adopting AI, we started noticing real shifts across SDLC. Those were visible shifts, but the problem was, none of them came with a clear meaning.
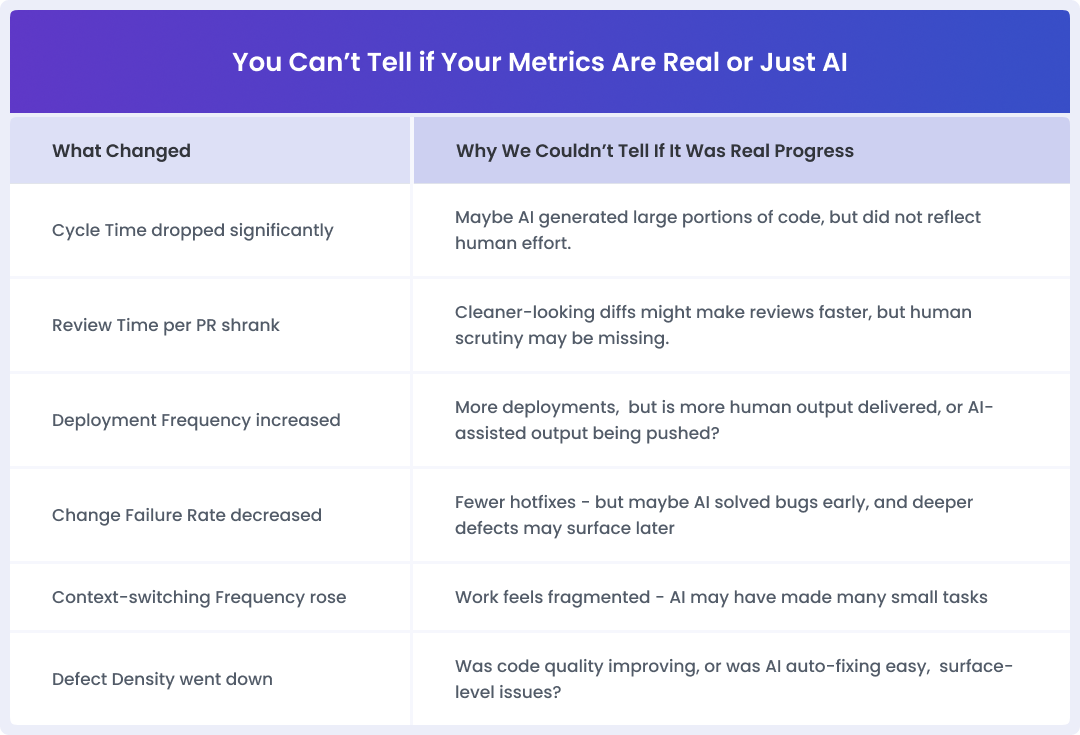
What I learned during this phase of AI adoption was - even solid improvements in standard engineering metrics can be misleading (and dirty) when AI gets involved. AI makes the metrics hygiene issue real.
CHAPTER 4: How Long Can You Run an Engineering Team With False Metrics?
For a while, nothing broke. And that was the worst part. It bleeds slowly and surfaces when no medicine can heal that wound.
When it surfaced in our case, it showed up as a big failure at all three - tech, people, and business - fronts. The wound was so deep, I could not reach its end to figure out what all we had lost. But the following are some losses I still remember.
Tech Impact:
- We shipped faster with false confidence, and later found an increasing number of hotfixes.
- Some sprints were smooth, some were chaotic. That made release stability unpredictable.
- Hidden AI-generated patterns made debugging harder.
- Architecture decisions were made on “fake velocity,” which created more tech debt later.
People Impact:
- Reviewers didn’t know how much depth to apply.
- AI made tasks look small, so everyone juggled too many. That introduced the context switching crisis.
- Peer reviews became rare.
- Burnout spiked because engineers were buried under unrealistic expectations of constant, faster work.
- Cognitive load worsened, correcting AI’s guesses, understanding what AI wrote, and deciding whether to keep, fix, or replace it.
Business Impact:
- Roadmaps slipped because timelines were built on AI-inflated cycle times.
- We under-hired in areas AI quietly masked. Our hiring plans broke.
- OKRs drifted as we set targets using false metrics.
- Leadership confidence eroded when outcomes didn’t match green dashboards.
CHAPTER 5: Want to Avoid the Mistake We Made? Then Fix This Early. Measure and Correlate AI’s Impact on Engineering Metrics.
If there is one thing I have learnt, Engineering Intelligence matters more than ever in AI-SDLC.
The only safe path is to not just measure engineering metrics & AI adoption trends, but correlate AI’s impact to those engineering metrics to get a full picture of what’s working and what’s breaking.
Here is what ‘avoiding the mistake we made’ looks like.
1. You must map AI’s involvement to engineering signals
AI does not just touch code. It touches the entire SDLC. So, track how AI influences your SDLC by correlating it to engineering signals. The following was our mapping.
- AI touched coding time → how did cycle time react?
- AI rewrote diffs → how did review depth change?
- AI autofixed issues → how did defect density affect?
- AI made tasks feel easier → how did context switching rise?
- AI compressed logic → how did cognitive load show up across the sprint?
- Very high AI adoption → how did DORA metrics react?
2. You must separate actual team progress from AI-inflated movement
Unlike raw metrics, correlated metrics won’t lie to you. Because correlation tells you…
- Which changes came from humans
- Which came from AI
- Which are real wins
- What are the side effects
- What are the warning signs
3. Watch for negative AI impacts, not just the wins
AI improves the majority of metrics. But a lack of governed AI adoption can lead to worsening metrics. So, better to track where AI makes things worse…
- Hard-to-review PRs
- Higher cognitive load
- Deeper bugs that surface later
- Fragmented task flows
- Burnout from constant context switching
- Poor PR hygiene
4. Add human-effort signals next to performance metrics
Human efforts behind the code always remain the biggest blind spot in AI-SDLC. AI speeds up the surface, but the hidden weight falls on humans. So, we began measuring…
- Review depth, not just review time
- Debug sessions caused by AI guesses
- Rewrites of AI-generated logic
- Peer feedback and hesitations
- Rework patterns across sprints
5. Use correlations to fix problems before they grow
Once you tie AI usage to engineering metrics, you find patterns fast. In our case, we figured out…
- If review time dropped but defects increased → AI code needed deeper governance.
- If cycle time improved but rework grew → AI suggestions were low-quality.
- If deployments increased but stability fell → AI-driven speed wasn’t sustainable.
- If engineers worked faster, but context switching increased → burnout signals need to be tracked and acted upon.
#TIP
Use Hivel for Real Visibility into Entire AI-SDLC
We moved to Hivel because it gave us exactly the kind of correlated context-rich view we needed.
Here is what Hivel’s powerful Analytics Engine for measuring AI Adoption and Impact has been doing for us…
- Correlating AI-assisted commits with engineering outcomes: We can see how AI impacts key metrics like cycle time, change failure rate, defect density, rework, and deployment stability. We can also compare the performance of a team using AI vs a team not using AI.
- Revealing where AI helps - and where it silently hurts: Hivel highlights deeper issues, review bottlenecks, quality dips at repo and team levels, caused by AI-assisted coding.
- Giving unified visibility across the entire SDLC: Git, Jira, CI/CD, DORA metrics, human-effort signals - all in one clean, connected view of our engineering health.
- Making AI adoption measurable, governed, and predictable: With Hivel, we can track and measure how engineers use AI - with metrics like total lines suggested, total lines accepted, active users, preferred AI models, and AI vs manual code. These details help us keep optimizing the AI adoption strategy across teams based on real usage feedback.
The three key instant results of using Hivel were Immediate Clarity, Early Warning, and Confident Planning.
To Better Decisions,
The Engineering Leader Who’s Been There