What’s the big problem all CTOs are facing?
In a world that is rapidly becoming more data-driven, it cannot be gainsaid that all engineering leaders are armed with data about their org’s performance. From big tech companies to startups, everyone is thinking about using internal data to measure and improve performance from big tech companies to startups. This treasure trove of data is the key to improving engineering teams' efficiency, productivity, and performance. The only issue leaders often grapple with is how to bring all the data together, and once it is together, what metrics to use to measure performance and how to go about it all.
My struggles in engineering leadership
In my years as a CTO, I often found myself on two extreme ends of a spectrum - either making gut-based decisions not backed by data or tracking too many metrics and losing sight of actual progress. But I knew that if I needed to become a better decision-maker and improve my teams' productivity, the first step would be to measure productivity since one can’t improve what one cannot measure. Eventually, I resorted to simply tracking the Git activity I could see on my SCM tool, coupled with my project management tool (usually JIRA). But there was still something missing.
Challenges with my approach:
Challenge 1: Are JIRA dashboards dead?
Relying on JIRA dashboards has a two-fold problem. The first is that significant manual input from developers is required to ensure that the dashboards are always accurate. This is why almost all engineering leaders complain about JIRA hygiene being a constant challenge. The second problem is how velocity is measured i.e., the sum of all story points. Story points are assigned subjectively based on estimates. Improving productivity based on estimates is as flawed as projecting growth based on budget, not actuals.
Although I had maker-checker policies in place to maintain JIRA hygiene, the larger issue remained. This was the lag between an action (moving from Dev to QA or UAT) happening and updating the ticket. So at any given time, the data in JIRA was outdated. JIRA couldn’t tell me when a developer had begun coding on a ticket, when a PR was raised, or whether or not it was reviewed before merging. Everything in between a ticket being created and closed was a mystery. JIRA needed to be amalgamated with what was happening on the ground level, in Git, in real-time, and then correlated again with what we were originally planning to do in JIRA.
Challenge 2: Git Dashboards aren’t cutting it
So the next question that came to my mind was- How do you use Git data to improve productivity without getting overwhelmed by metrics. Using too many metrics created chaos, and I didn’t know what to measure or where to measure it. The Git providers, BitBucket, GitHub, and GitLab, have inbuilt analytics. But they are far too basic, and I had to build more comprehensive analytics on top of them myself. This was incredibly challenging, not to mention expensive in terms of time and resources.
Challenge 3: Output vs Outcome
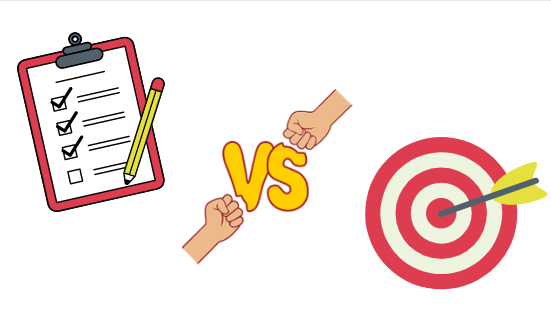
It’s now well established that counting lines of code or measuring the hours spent in the office is no longer a metric to rely on. It has no bearing on a developer's productivity and incentivizes the wrong behavior. It also measures productivity in the form of output, not outcome. As an engineering leader reporting to the Board on the performance of the engineering org, what ultimately mattered was the outcome, i.e., the number of feature releases, deployment frequency, etc. The success of any engineering org is determined by the ultimate value it can provide to its customers. So I had to use the same standard to measure success at a developer’s level as well.
Becoming outcome, and not output, driven changed the course of my engineering leadership career. The metrics I began to care about changed.
How did I choose which metrics should matter most to me? There are a few key factors I considered -
- The primary goals of the engineering org - both the management and engineers
- The expectations of the Board and management
- Commonly accepted benchmarks for performance in engineering
The metrics that matter
Eventually, my sojourn with measuring and improving engineering productivity made me start Hivel.ai. While doing so, it was important to base it on the metrics that really mattered. One of the most tried and tested ways to measure the productivity of an engineering team is Google’s DORA metrics. Google and the 32,000 companies they surveyed keep it simple - just four metrics:
- Deployment frequency
- Lead time for changes
- Time to restore service
- Change failure rate
Modern data-driven leaders go well beyond JIRA dashboards. They use these four metrics to differentiate elite engineering teams from the rest. Using the right metrics to measure and improve productivity significantly impacted my leadership decision-making. For example, let’s say you measure change failure rate as a key metric and are seeing a trend of increasing failures in production over the last couple of sprints. Perhaps this is because Pull Requests aren’t being reviewed before being merged. As a leader, it alerts you to make the necessary process changes and improve the quality of your releases.
It does bear mentioning, however, that even the best metrics are meaningless unless they give actionable insights to aid you in decision-making. So where do modern data-driven leaders go when they need combined data from Git and JIRA and actionable insights? Here.
Also, read: How To Build A Data-Driven Culture In Engineering Teams?