Elite

DORA stands for DevOps Research and Assessment.
It began as a research program that studied how high-performing engineering teams build, test, and deliver software. The research later became part of Google Cloud, but its findings are used across the entire software industry.
The program analyzed thousands of engineering teams to understand what actually makes software delivery fast, reliable, and stable.
From that research came a set of four DevOps performance metrics that are now widely known as DORA metrics.
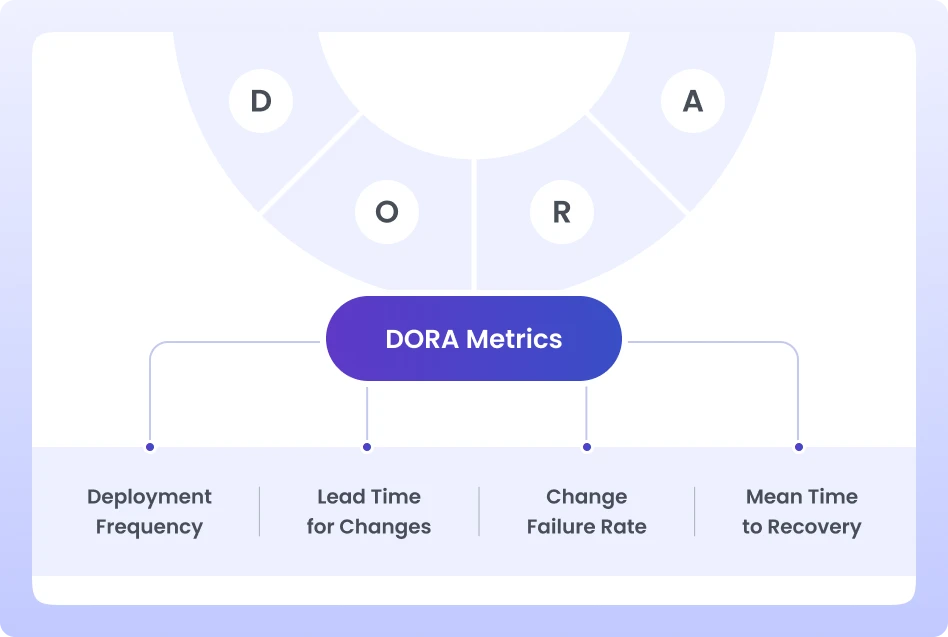
DORA metrics are four key measurements used to evaluate software delivery performance.
They help organizations understand how efficiently and reliably their engineering teams ship software.
The four DORA DevOps metrics are:
Together, these DevOps metrics measure two critical aspects of engineering performance: delivery speed and system stability.
DevOps teams use DORA metrics because they offer a very clear and objective way to identify and measure software delivery performance.
While traditional engineering metrics often focus on activity, such as lines of code written or the number of commits, which do not show whether software is delivered quickly or safely, these DevOps metrics focus on real delivery outcomes, including…
With these insights, engineering leaders can easily comprehend whether their development process is actually improving delivery performance.
These DevOps performance metrics became the industry standard because they are based on large-scale research and real engineering data.
The research behind DORA was published in the widely cited Accelerate State of DevOps reports, which analyzed thousands of engineering teams across different industries.
The findings consistently showed that teams with strong DORA performance tend to:
Because of this strong link between engineering practices and business performance, DORA metrics are now widely used by:
Today, many engineering platforms and DevOps tools include built-in dashboards for tracking DORA metrics.
Nathan Harvey, who leads the DORA program at Google Cloud, has spent over a decade helping teams confront this belief with data. He shared his conclusion in one of his YouTube Talks,"Throughput and stability tend to move together. You're either fast and stable, or you're slow and unstable."
That's a finding backed by over 12 years of research, across tens of thousands of engineers, in companies of every size, in every industry imaginable. And it raises an uncomfortable follow-up question: if speed and stability actually go together, why were so many engineering teams experiencing exactly the opposite?
The answer lies in what they were measuring. And more importantly, what they weren't.
Before DORA became popular, most engineering organizations used productivity-style metrics to evaluate developers and teams.
Some of the most common ones were:
At first glance, these metrics seemed logical. More output should mean more progress.
But software engineering does not work that way.
A developer can write thousands of lines of code and still slow down a system.
A team can close dozens of tickets and still delay product delivery.
These metrics measured developer activity, not software delivery performance.
Traditional metrics created several problems for engineering teams.
When teams are judged by lines of code or ticket counts, they often focus on doing more work instead of delivering better outcomes.
More code does not always mean better software. In many cases, the best solution is actually less code.
Older metrics rarely tracked what happened after software reached production.
A team could ship features quickly, but if those releases cause frequent outages that require hotfixes, the organization still suffers.
Delivery speed without stability creates chaos.
Software delivery is not just about writing code.
It includes:
Traditional metrics focused only on the development phase, ignoring the rest of the pipeline.
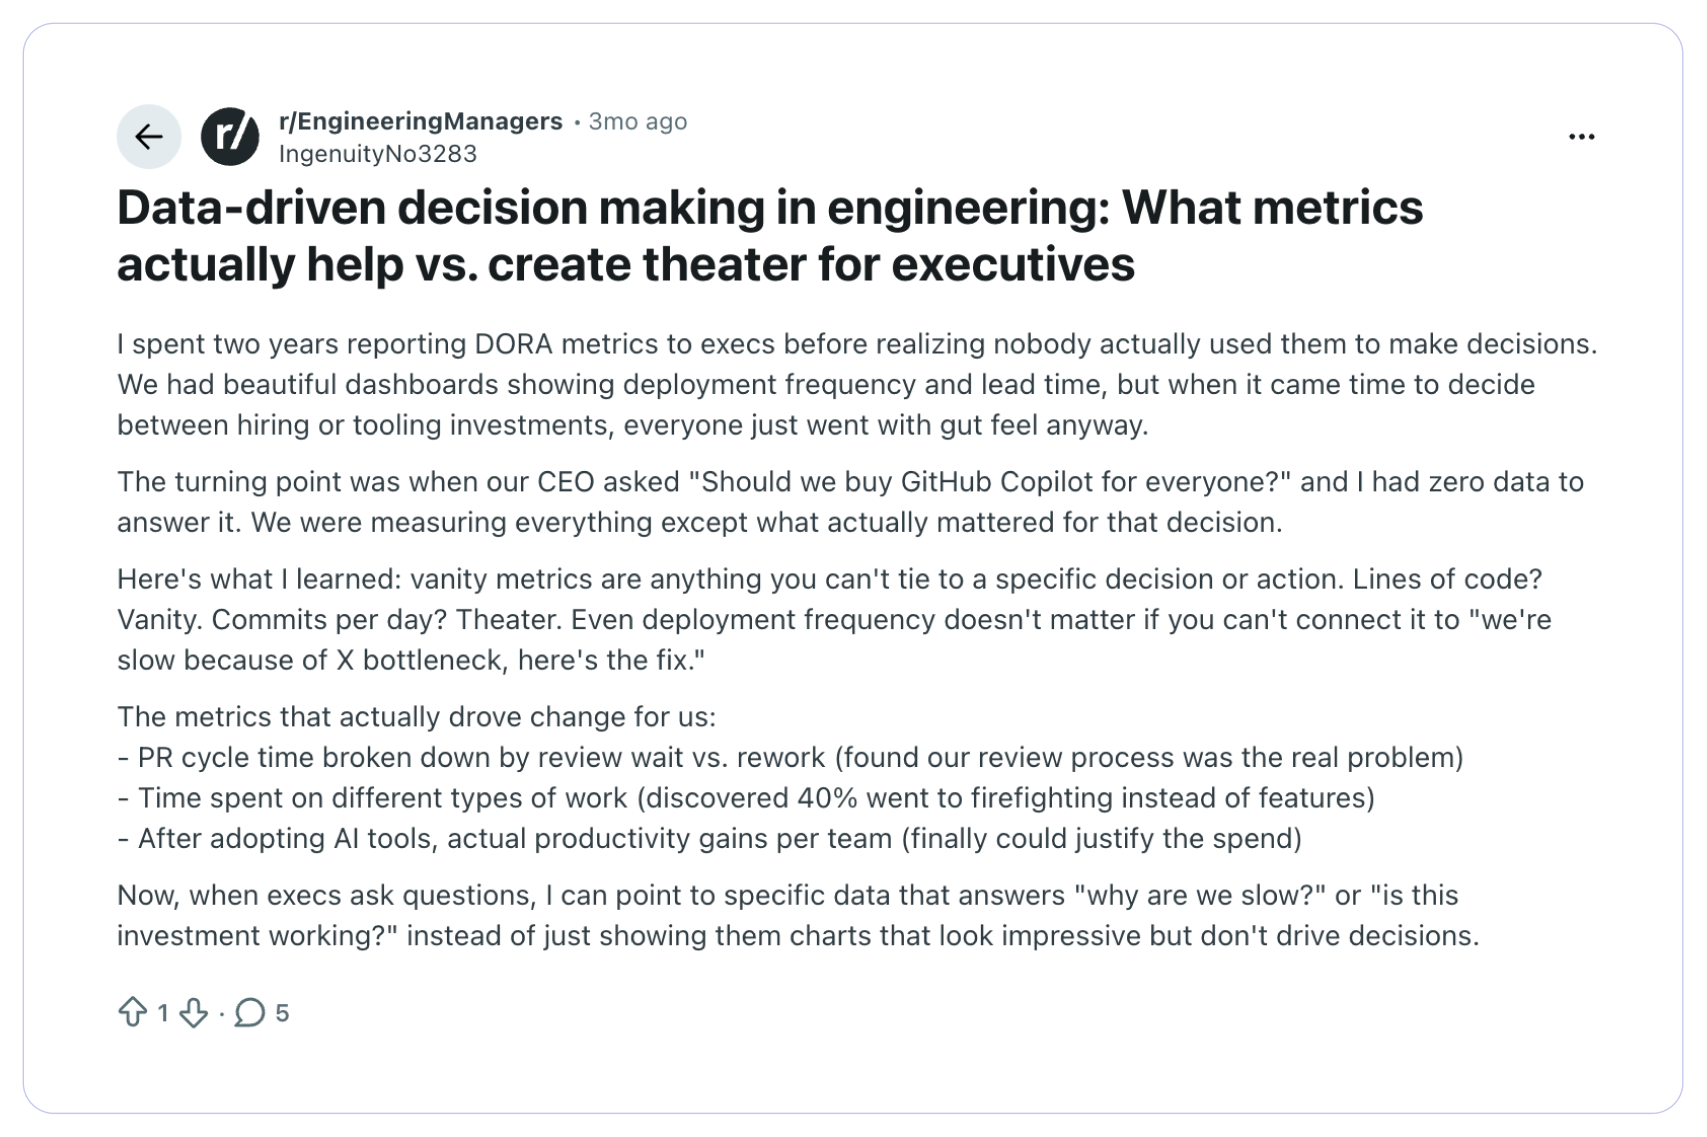
However, with multiple metrics spanning across the engineering pipeline, it becomes crucial to identify whether you are tracking a real metric or a vanity metric.
In this Reddit thread, a Redditor makes a very thought-provoking point. He says, “Vanity metrics are anything you can't tie to a specific decision or action. Lines of code? Vanity. Even deployment frequency doesn't matter if you can't connect it to 'we're slow because of X bottleneck.”
Around the early 2010s, the software industry started moving toward DevOps and continuous delivery practices.
Teams began adopting:
Instead of large releases every few months, teams began shipping small changes frequently.
But this new model created a new challenge: How do you measure performance in a fast-moving delivery pipeline?
Traditional metrics were no longer useful.
Engineering leaders needed a way to measure both speed and reliability at the same time.
This is where the DORA research program changed the conversation.
Starting in 2014, Dr. Nicole Forsgren led a research effort that would eventually become the most comprehensive study of software delivery performance ever conducted.
The annual State of DevOps Report surveyed tens of thousands of professionals - developers, ops engineers, product managers, CTOs - and asked one core question:
What does it actually look like when software teams perform well?
The findings were clear. High-performing teams shared four measurable traits. They deployed frequently. Their lead time was short. Their failure rate was low. And when things broke, they recovered fast.
The research also made a direct connection between software delivery performance and business outcomes. Teams that scored high on DORA or DevOps metrics were more likely to hit their revenue targets, achieve their reliability goals, and outperform competitors.
The biggest change DORA introduced was a new way of thinking about engineering performance.
Instead of asking:
“How busy are our developers?”
The focus shifted to:
This shift moved the industry away from activity-based metrics and toward outcome-based metrics. And that changed how engineering teams evaluate success.
Today, the best software teams optimize for delivering reliable software faster. DORA metrics simply provide the clearest way to measure that.
DORA metrics are built around four simple measurements. Together, these DevOps performance metrics show how well a team delivers software to users.
Each metric looks at a different part of the delivery process. Some measure speed, while others measure stability.
This balance is important. A team that moves fast but constantly breaks production is not high-performing. At the same time, a team that is extremely stable but releases updates once every few months is also not effective.
The four DORA metrics help teams understand both sides of software delivery.
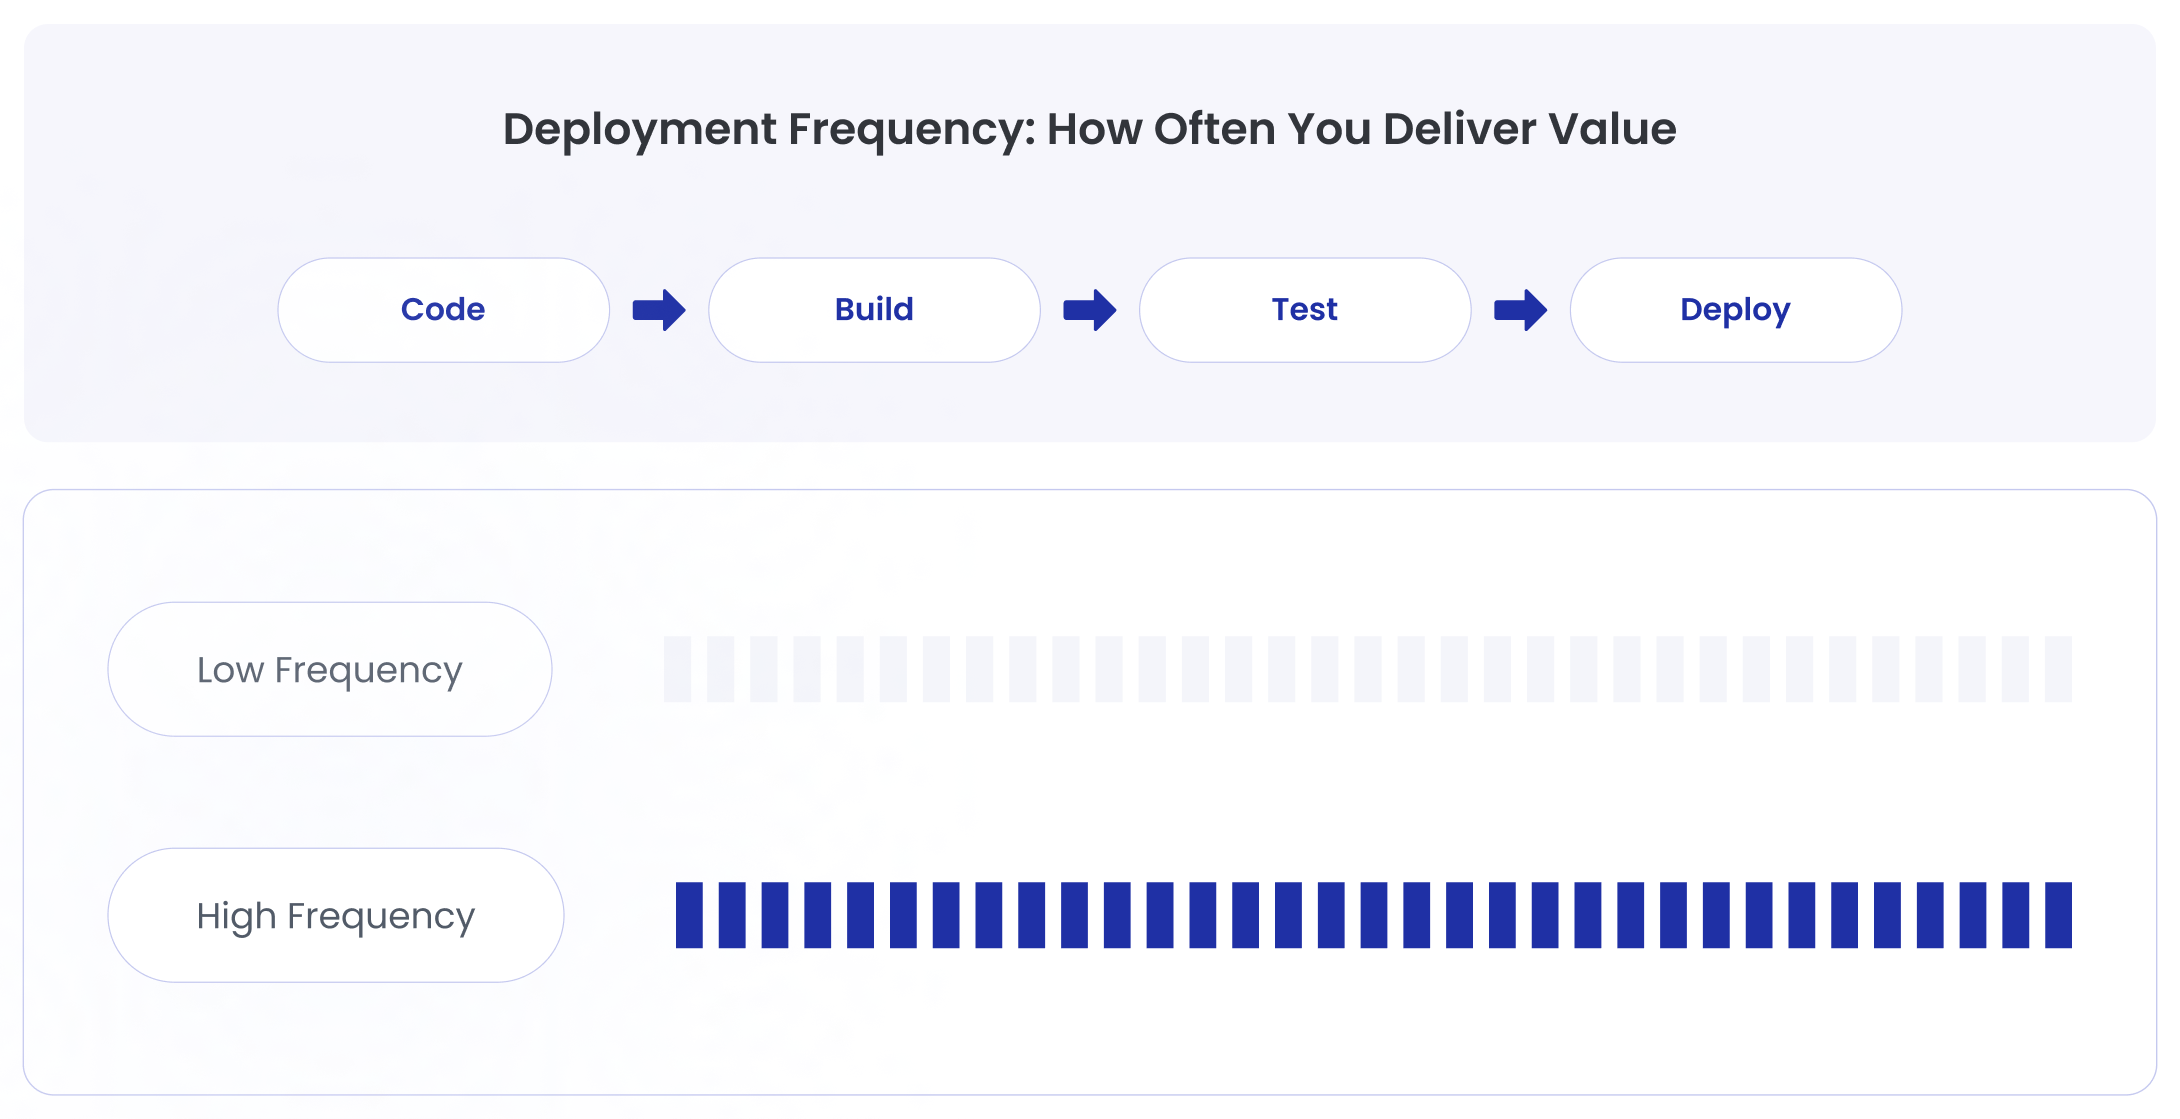
Deployment Frequency measures how often a team releases code to production.
It answers a simple question: How frequently are we delivering changes to users?
High-performing teams release updates regularly. In many modern organizations, deployments can happen multiple times per day.
Frequent deployments usually indicate:
When deployments happen rarely, it often signals bottlenecks in the delivery pipeline.
Large releases also tend to increase risk because many changes are shipped at once.
Deployment Frequency helps teams see whether their delivery process encourages small, safe, and frequent releases.
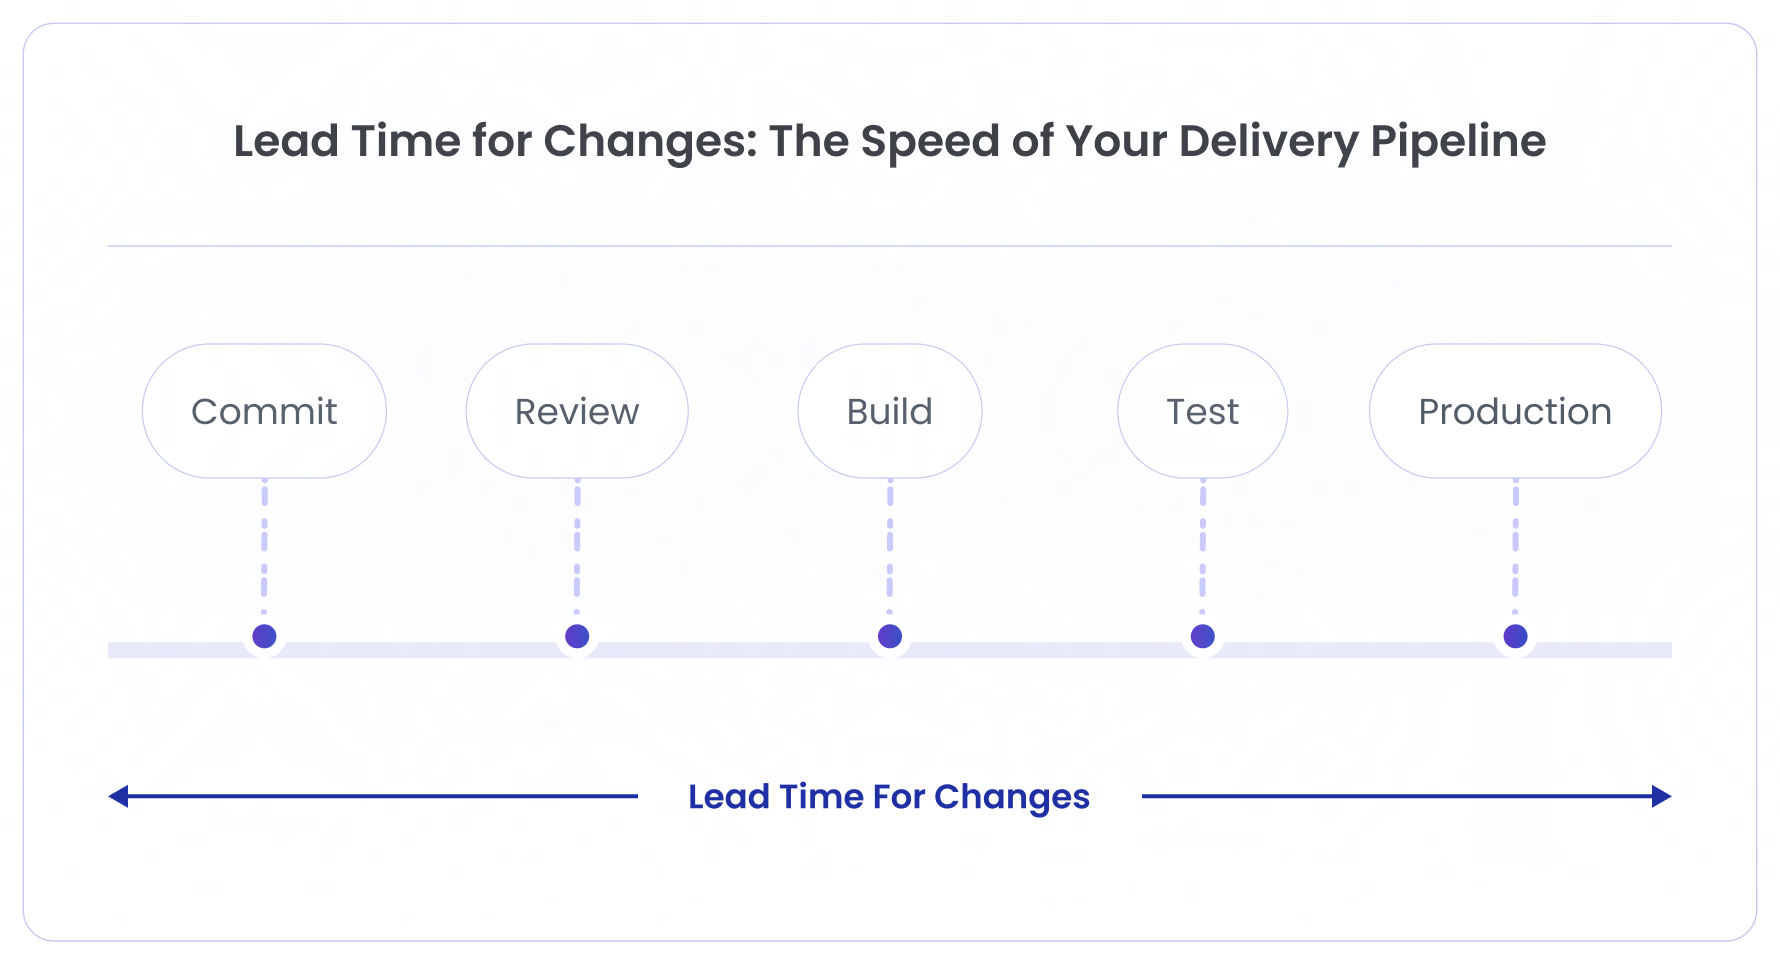
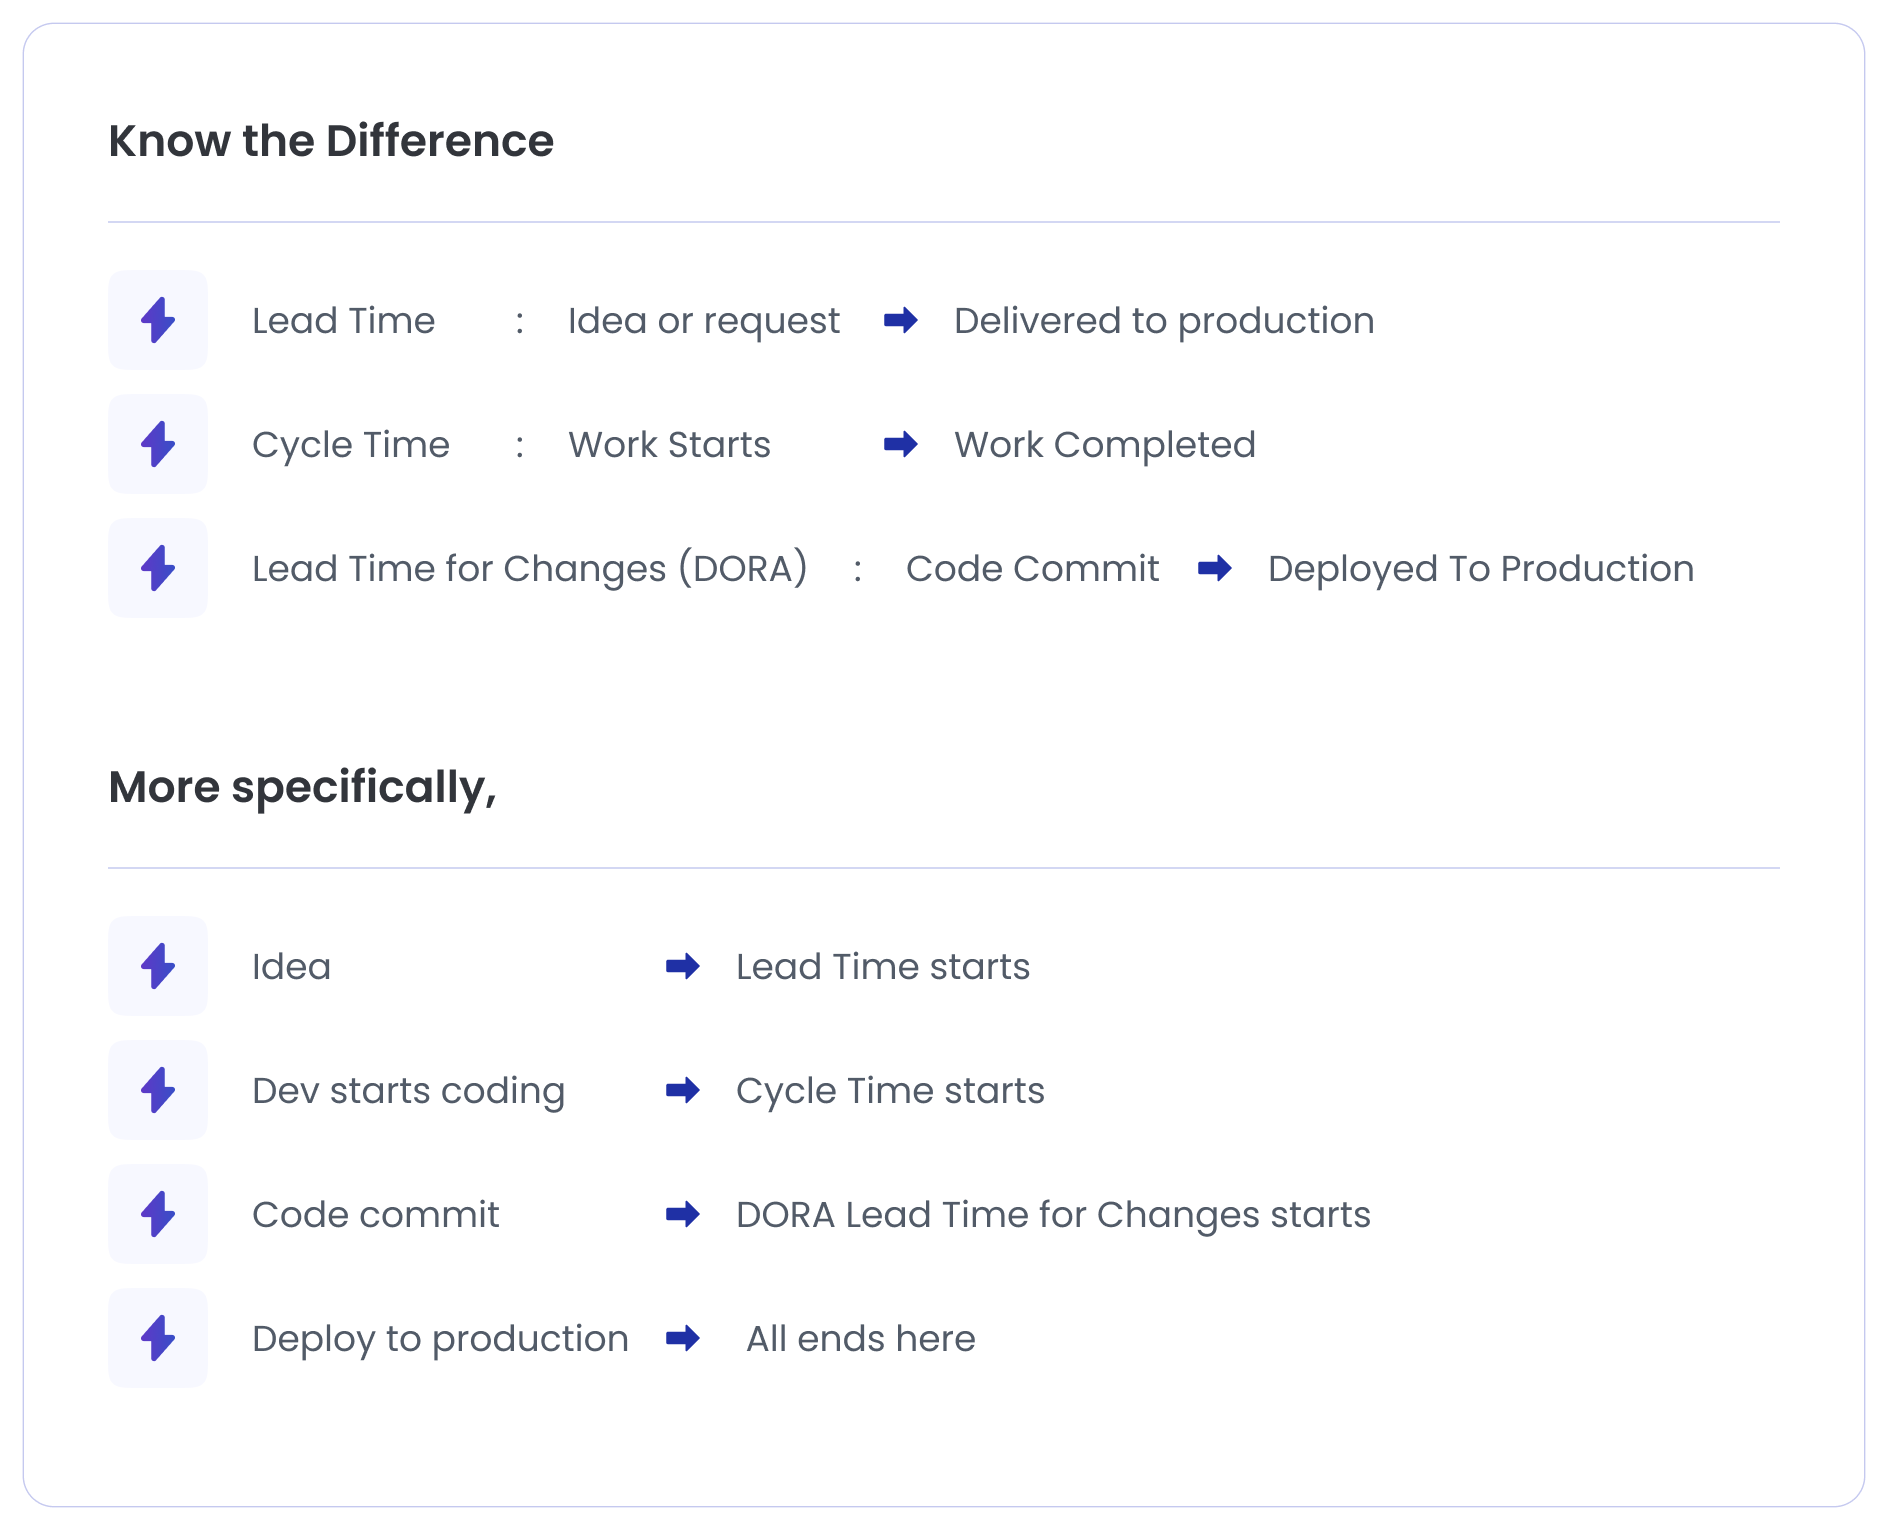
Lead Time for Changes measures how long it takes for a code change to reach production.
The timer typically starts when code is committed to the repository and ends when that change is successfully deployed.
This metric shows how quickly ideas turn into real product improvements.
A short lead time usually means:
A long lead time often points to delays somewhere in the system, such as:
Lead Time for Changes helps organizations understand how fast their delivery pipeline actually moves.
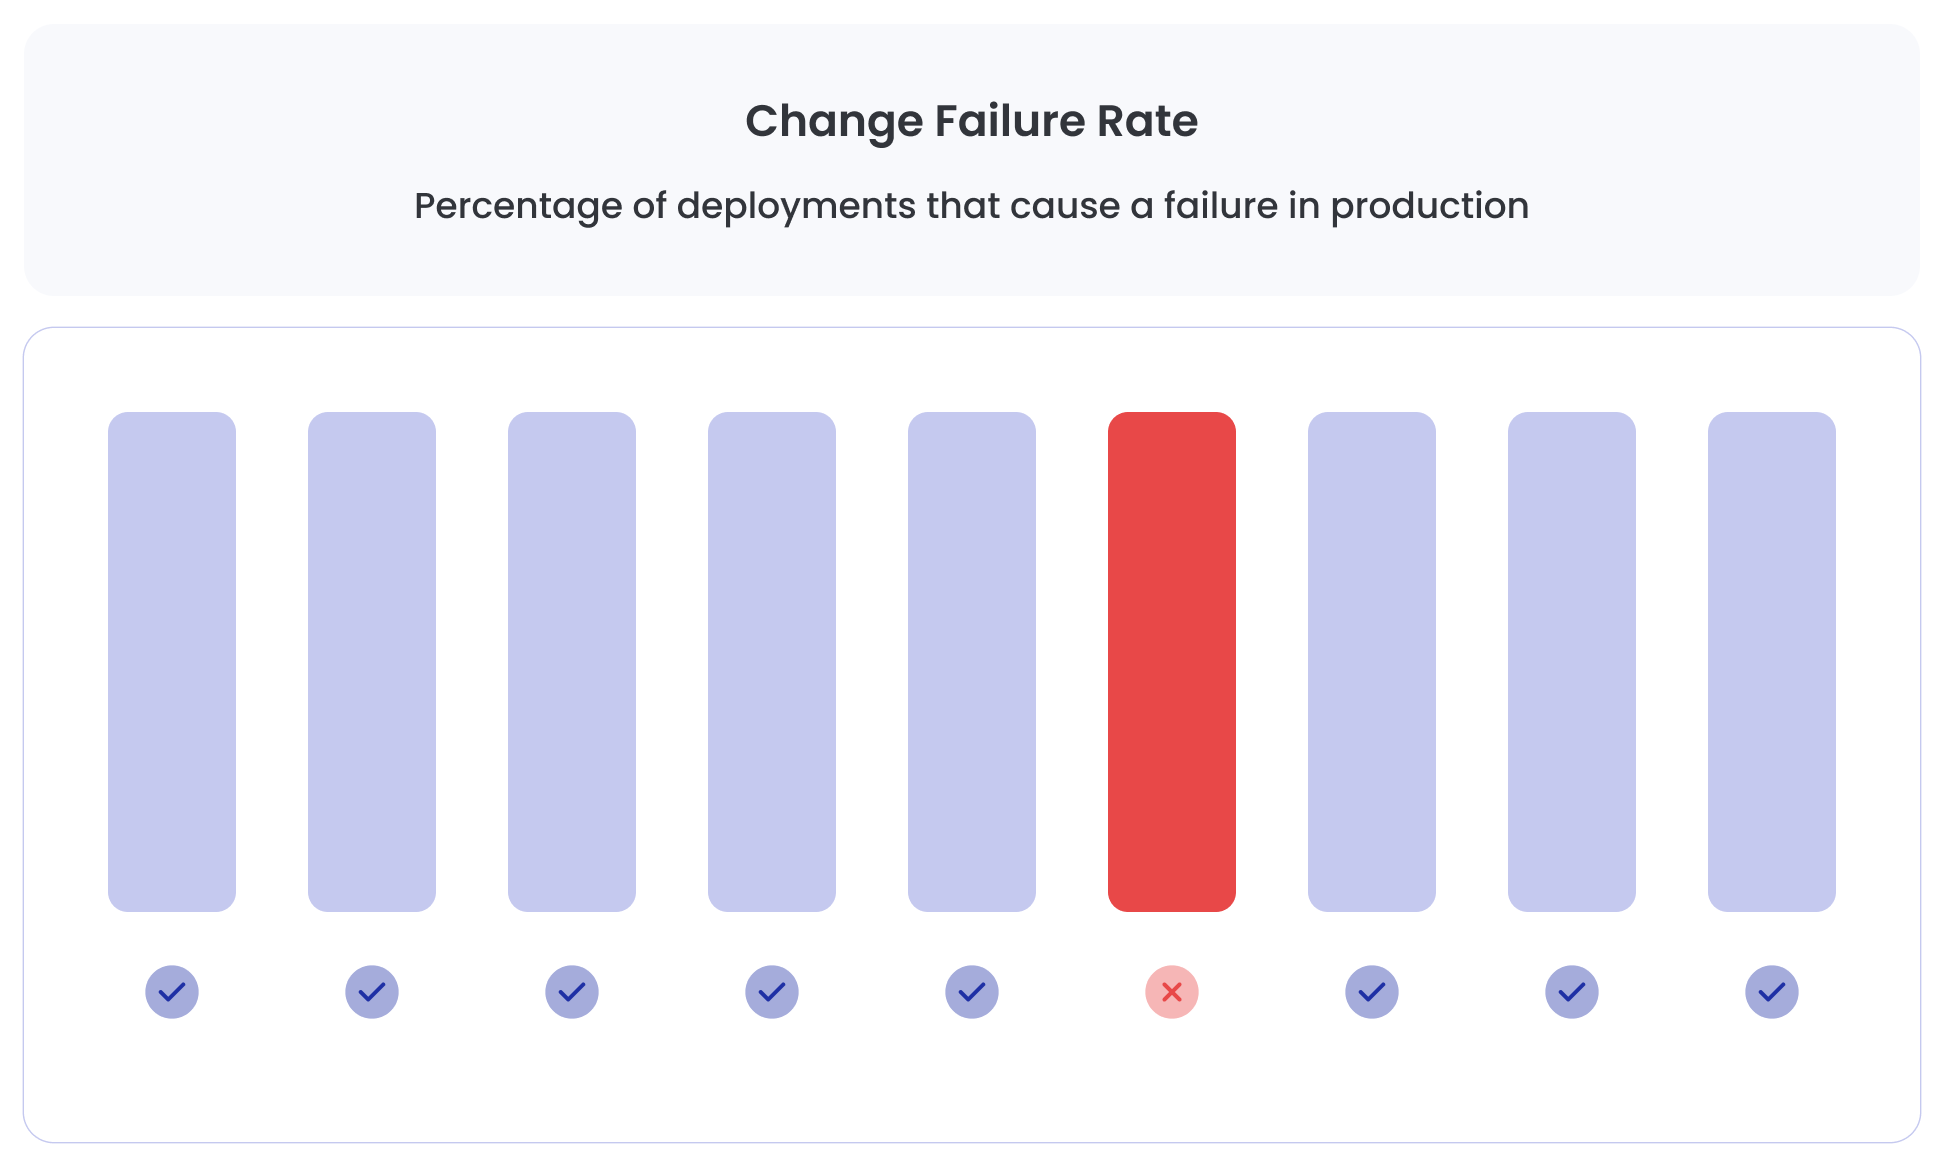
Change Failure Rate measures how often deployments cause problems in production.
These problems might include:
The metric is calculated as the percentage of deployments that lead to failures requiring remediation.
For example, if a team deploys 100 times and 10 releases cause incidents, the change failure rate is 10%.
This metric focuses on release stability. Even if a team deploys frequently, a high failure rate means the system is fragile and risky.
Strong engineering teams aim to keep this number low while still delivering updates quickly.
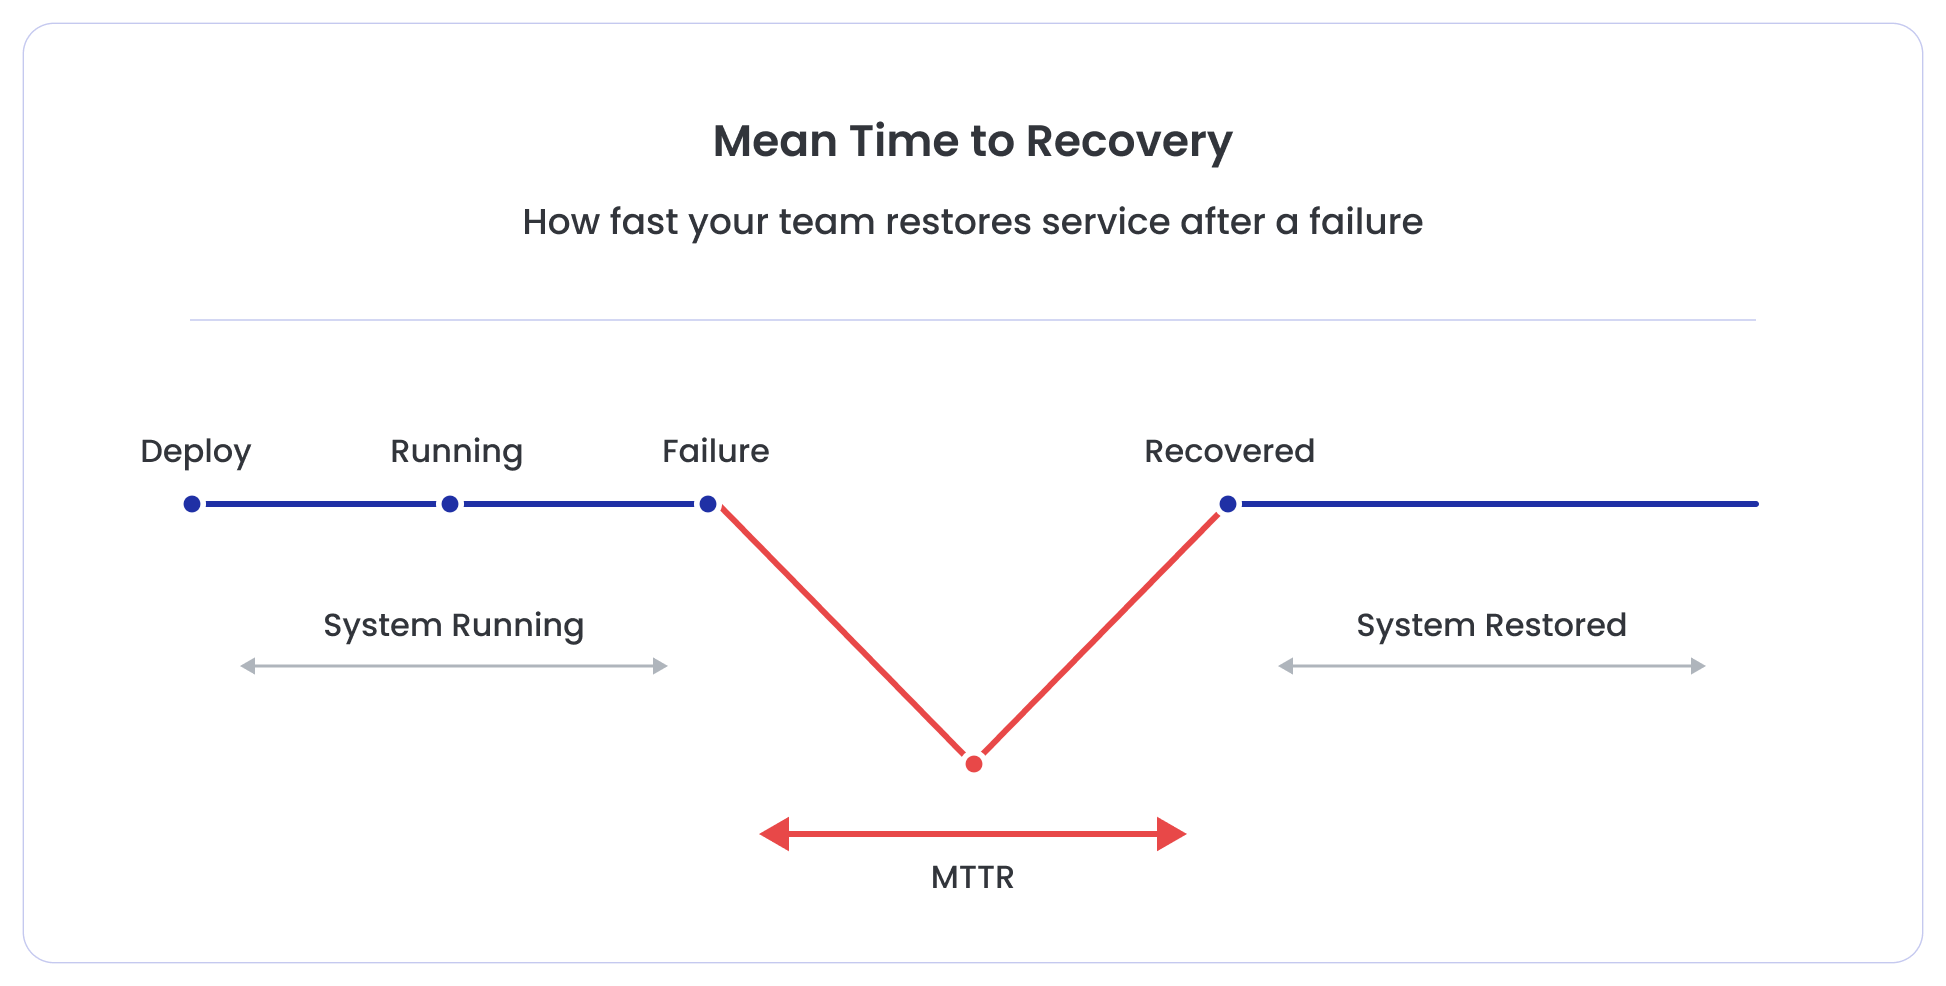
MTTR measures how quickly teams restore service after a production failure.
No software system is perfect. Failures happen even in the best engineering environments.
What separates high-performing teams is how fast they recover.
MTTR tracks the average time it takes to:
A shorter recovery time usually indicates:
Organizations with fast MTTR minimize the impact of failures on customers and business operations.
The real strength of DORA metrics is that they work together as a balanced system.
Two metrics measure speed:
Two metrics measure stability:
When teams improve both speed and stability at the same time, they achieve what every engineering organization wants: fast, reliable software delivery.
One of the clearest signals of a healthy engineering team is how often they deliver updates to users.
Software only creates value when it reaches production. Until then, it is just code sitting in a repository.
Deployment Frequency measures how regularly teams push new changes into production. It shows whether a team can move from development to delivery smoothly.
When Deployment Frequency increases, teams can ship improvements faster, fix issues earlier, and respond to user feedback quickly.
Deployment Frequency measures how often a team successfully releases code to production.
A deployment can include:
The metric focuses on completed deployments, not builds or commits.
The question it answers is simple: How frequently are users receiving updates to the product?
A higher deployment frequency usually means the delivery pipeline is automated, reliable, and efficient.
How High-Performing Teams Treat Deployment Frequency
High-performing engineering teams treat deployments as a routine activity, not a stressful event.
Instead of releasing large batches of code every few weeks or months, they ship small changes continuously.
This approach offers several advantages:
As a result, deployments become predictable, which is exactly what mature engineering teams aim for.
Many modern companies deploy:
When deployment frequency is low, it usually means something in the delivery pipeline is slowing teams down.
Common causes include:
Improving deployment frequency often requires removing friction from the delivery pipeline.
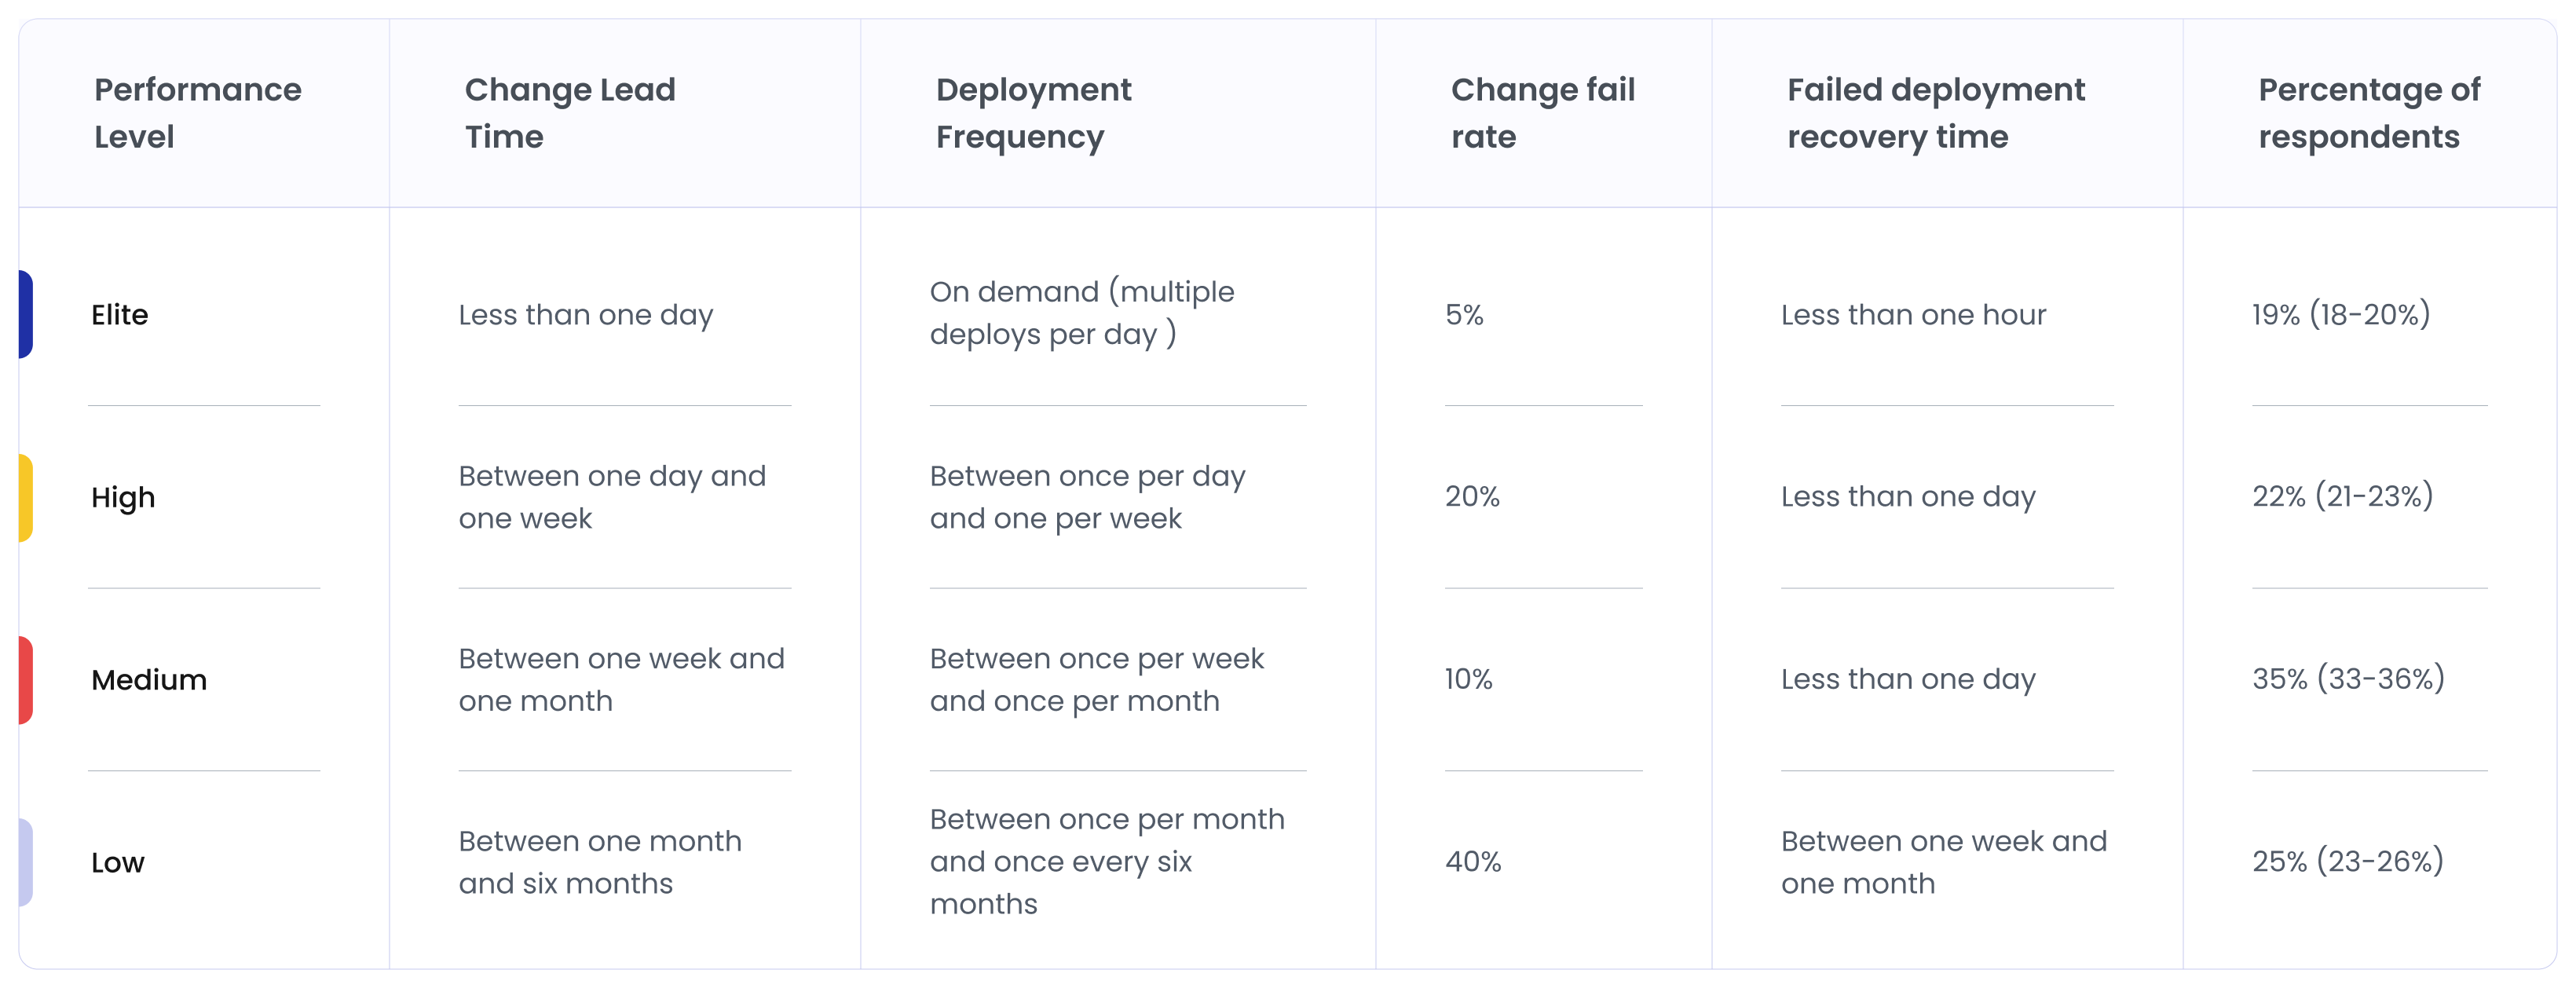
DORA research categorized software teams into performance groups based on how frequently they deploy.
Here's a question that seems simple but stops most engineering leaders cold.
Right now, if one of your engineers committed a one-line bug fix, how long would it take to reach production?
Lead Time for Changes is DORA's answer to that question.
Lead Time for Changes measures the time between a code commit and that change running successfully in production.
The clock typically starts when a developer commits code to the repository and ends when that change is deployed.
This metric reflects the efficiency of the entire delivery pipeline, not just development speed.
A short Lead Time for Changes means code moves through the system smoothly. A long Lead Time for Changes suggests delays or bottlenecks, somewhere between development and deployment.
A code change usually passes through multiple steps before it reaches production. Each step affects the overall Lead Time for Changes.
Common stages include:
If any of these stages become slow or manual, Lead Time for Changes increases.
The goal is to make each stage fast, predictable, and automated.
Why Code Reviews and Approvals Become Bottlenecks and Affect Lead Time for Changes
Code reviews are important for maintaining quality, but when they take too long, they delay delivery.
Some common issues include:
Similarly, approval processes can introduce delays when multiple layers of sign-off are required before deployment.
These bottlenecks increase Lead Time for Changes even when the code itself is ready.
High-performing teams address this by keeping pull requests small and making reviews fast and collaborative.
How Elite Teams Reduce Lead Time for Changes
Elite engineering teams treat Lead Time for Changes as a system design problem, rather than a development issue.
They reduce it by improving the entire delivery pipeline.
Common practices include:
When these practices are in place, Lead Time for Changes can drop dramatically. In elite teams, changes often reach production within hours instead of days or weeks.
Shipping software quickly is valuable. But if releases constantly break production, speed becomes a problem.
That is why DORA does not measure delivery speed alone. It also measures how stable those releases are.
What is Change Failure Rate?
Change Failure Rate measures the percentage of deployments that cause a failure in production.
A failure can include situations such as:
The metric is calculated by dividing the number of failed deployments by the total number of deployments.
For example:
If a team deploys 100 times and 10 deployments cause incidents, the change failure rate is 10%.
Lower percentages indicate more stable releases.
Why Faster Teams Sometimes Break More Things
Many teams assume that deploying faster will automatically increase failure rates. And sometimes that does happen.
When organizations start accelerating delivery, they may initially see more incidents. This often occurs because:
When releases become more frequent without improving these systems, failures become more visible.
However, this does not mean fast delivery is the problem. It simply reveals weaknesses in the delivery system that were already present.
Why Elite Teams Actually Reduce Failure While Increasing Speed
One of the most surprising findings from DORA research is this: The fastest teams also tend to have the most stable releases.
At first glance, this seems counterintuitive. But the reason becomes clear when you look at how elite teams operate.
They focus on small, incremental changes instead of large releases.
Smaller deployments offer multiple advantages:
Elite teams also invest heavily in:
These practices reduce the risk associated with each deployment. Over time, the system becomes both faster and more stable.
This is why high-performing engineering teams do not choose between speed and quality. They design their systems to achieve both at the same time.
No software system is perfect. Even the best engineering teams experience production incidents.
A deployment may introduce a bug. A dependency may fail. Infrastructure may behave unexpectedly.
What separates strong engineering teams from struggling ones is how quickly they recover.
What is Mean Time to Recovery?
Mean Time to Recovery (MTTR) measures the average time it takes to restore service after a production incident.
The timer usually starts when the failure begins or is detected, and ends when the system is fully functioning again.
Recovery may involve actions such as:
For example:
If a system outage lasts 40 minutes, and another incident lasts 20 minutes, the average recovery time becomes 30 minutes.
Lower MTTR indicates that teams can detect, diagnose, and resolve incidents quickly.
Fast recovery depends heavily on two capabilities: observability and rollback mechanisms.
Teams must first detect problems before they can fix them.
Modern engineering teams rely on strong observability systems that include:
These tools help engineers quickly identify where a problem exists and what caused it.
Without visibility into the system, diagnosing failures becomes slow and difficult.
Once the problem is identified, teams need a safe way to restore the system.
Many high-performing teams rely on strategies such as:
These mechanisms allow teams to restore service quickly without complex manual intervention.
Why MTTR Reflects Operational Maturity
MTTR is not just a technical metric. It reflects the overall operational maturity of an engineering organization.
Teams with low MTTR usually have:
In contrast, organizations with high MTTR often struggle with:
In many ways, MTTR measures how prepared a team is when things go wrong.
MTTR in the Real World: How Engineering Teams at Netflix and Amazon Do It
Netflix built Chaos Monkey - a tool that randomly kills production servers during business hours. On purpose. The thinking: if your system can't survive a random server dying on a Tuesday afternoon, it has no business being in production.
By forcing failures constantly, engineers had no choice but to build systems that recovered automatically. The result? Netflix now maintains only a few minutes of downtime per year - at a scale of hundreds of millions of users. (Source)
Amazon loses an estimated $400,000 per minute during outages. At that price, waiting for a human to notice something broke is not an option.
Their solution: design recovery out of human hands entirely. Using AWS load balancers with 5-second health checks, their systems detect failure, make a decision, and reroute traffic - automatically - in under 10 seconds. (Source: AWS Whitepaper: Availability and Beyond)
The DORA Performance Levels: How Teams are Categorized by Delivery Performance
DORA research groups engineering teams into performance levels based on how they perform across the four core DevOps metrics. These levels help organizations understand where their delivery performance stands and what improvements are needed.
In late 2025, Sudheer, CEO of Hivel, hosted Benjamin Good, co-author of the DORA report, on a very insightful webinar. In that webinar, Ben made a very good point around DORA’s importance: “DORA research looks at the capabilities and practices that result in high-performing teams and organizations when it comes to delivering software.”
Many engineering metrics have come and gone. Teams experimented with measuring productivity through commits, lines of code, and story points. But most of those signals failed to capture what truly matters in software delivery.
DORA metrics stood the test of time because they measure how software systems actually perform in the real world.
Instead of tracking developer activity, these DevOps performance metrics focus on how quickly and safely teams deliver working software to users.
This shift made DORA metrics one of the most trusted frameworks for evaluating engineering performance.
One reason these DevOps metrics work so well is that they measure the entire delivery system, not just individual developer activity.
Traditional metrics often focus on only one part of engineering. For example, commit counts only measure development activity.
DORA metrics look at the end-to-end system. They measure how efficiently code moves from development to production and how reliably that system operates.
This makes them much more useful for engineering leaders who want to understand how well the entire delivery pipeline works.
For a long time, engineering teams believed they had to choose between moving fast and keeping systems stable.
If a team deployed frequently, leaders assumed incidents would increase. If a team focused heavily on stability, releases usually slowed down.
DORA research challenged this assumption.
The data showed that the best engineering organizations do not trade speed for reliability. Instead, they design systems that improve both together.
When teams only optimize for speed, systems become fragile. When teams optimize only for stability, innovation slows down. DORA metrics prevent both extremes.
Perhaps the biggest reason DORA metrics work is that they measure outcomes instead of output.
Older engineering metrics often tracked how busy developers were. But writing more code or completing more tasks does not necessarily improve a product.
DORA metrics focus on the outcomes that matter most:
These outcomes reflect the real impact of engineering work.
By focusing on delivery results instead of developer activity, DORA metrics help organizations align engineering performance with product value and customer experience.
Something interesting is happening in engineering right now.
Developers are writing code faster than ever before. AI coding assistants are everywhere - in IDEs, in code review tools, in terminals, and in browsers.
As per the Stack Overflow Developer Survey, 84% of respondents are using AI tools. That number isn't a trend anymore. It's the baseline.
But the on-ground situation is different. Code is being generated more quickly. Pull requests are being opened more frequently. But lead times? deployment frequency? change failure rates? For many teams, those numbers haven't moved the way the AI productivity narrative would suggest they should.
Thus, when someone asks engineering leaders whether their teams are delivering faster, the answer gets complicated.
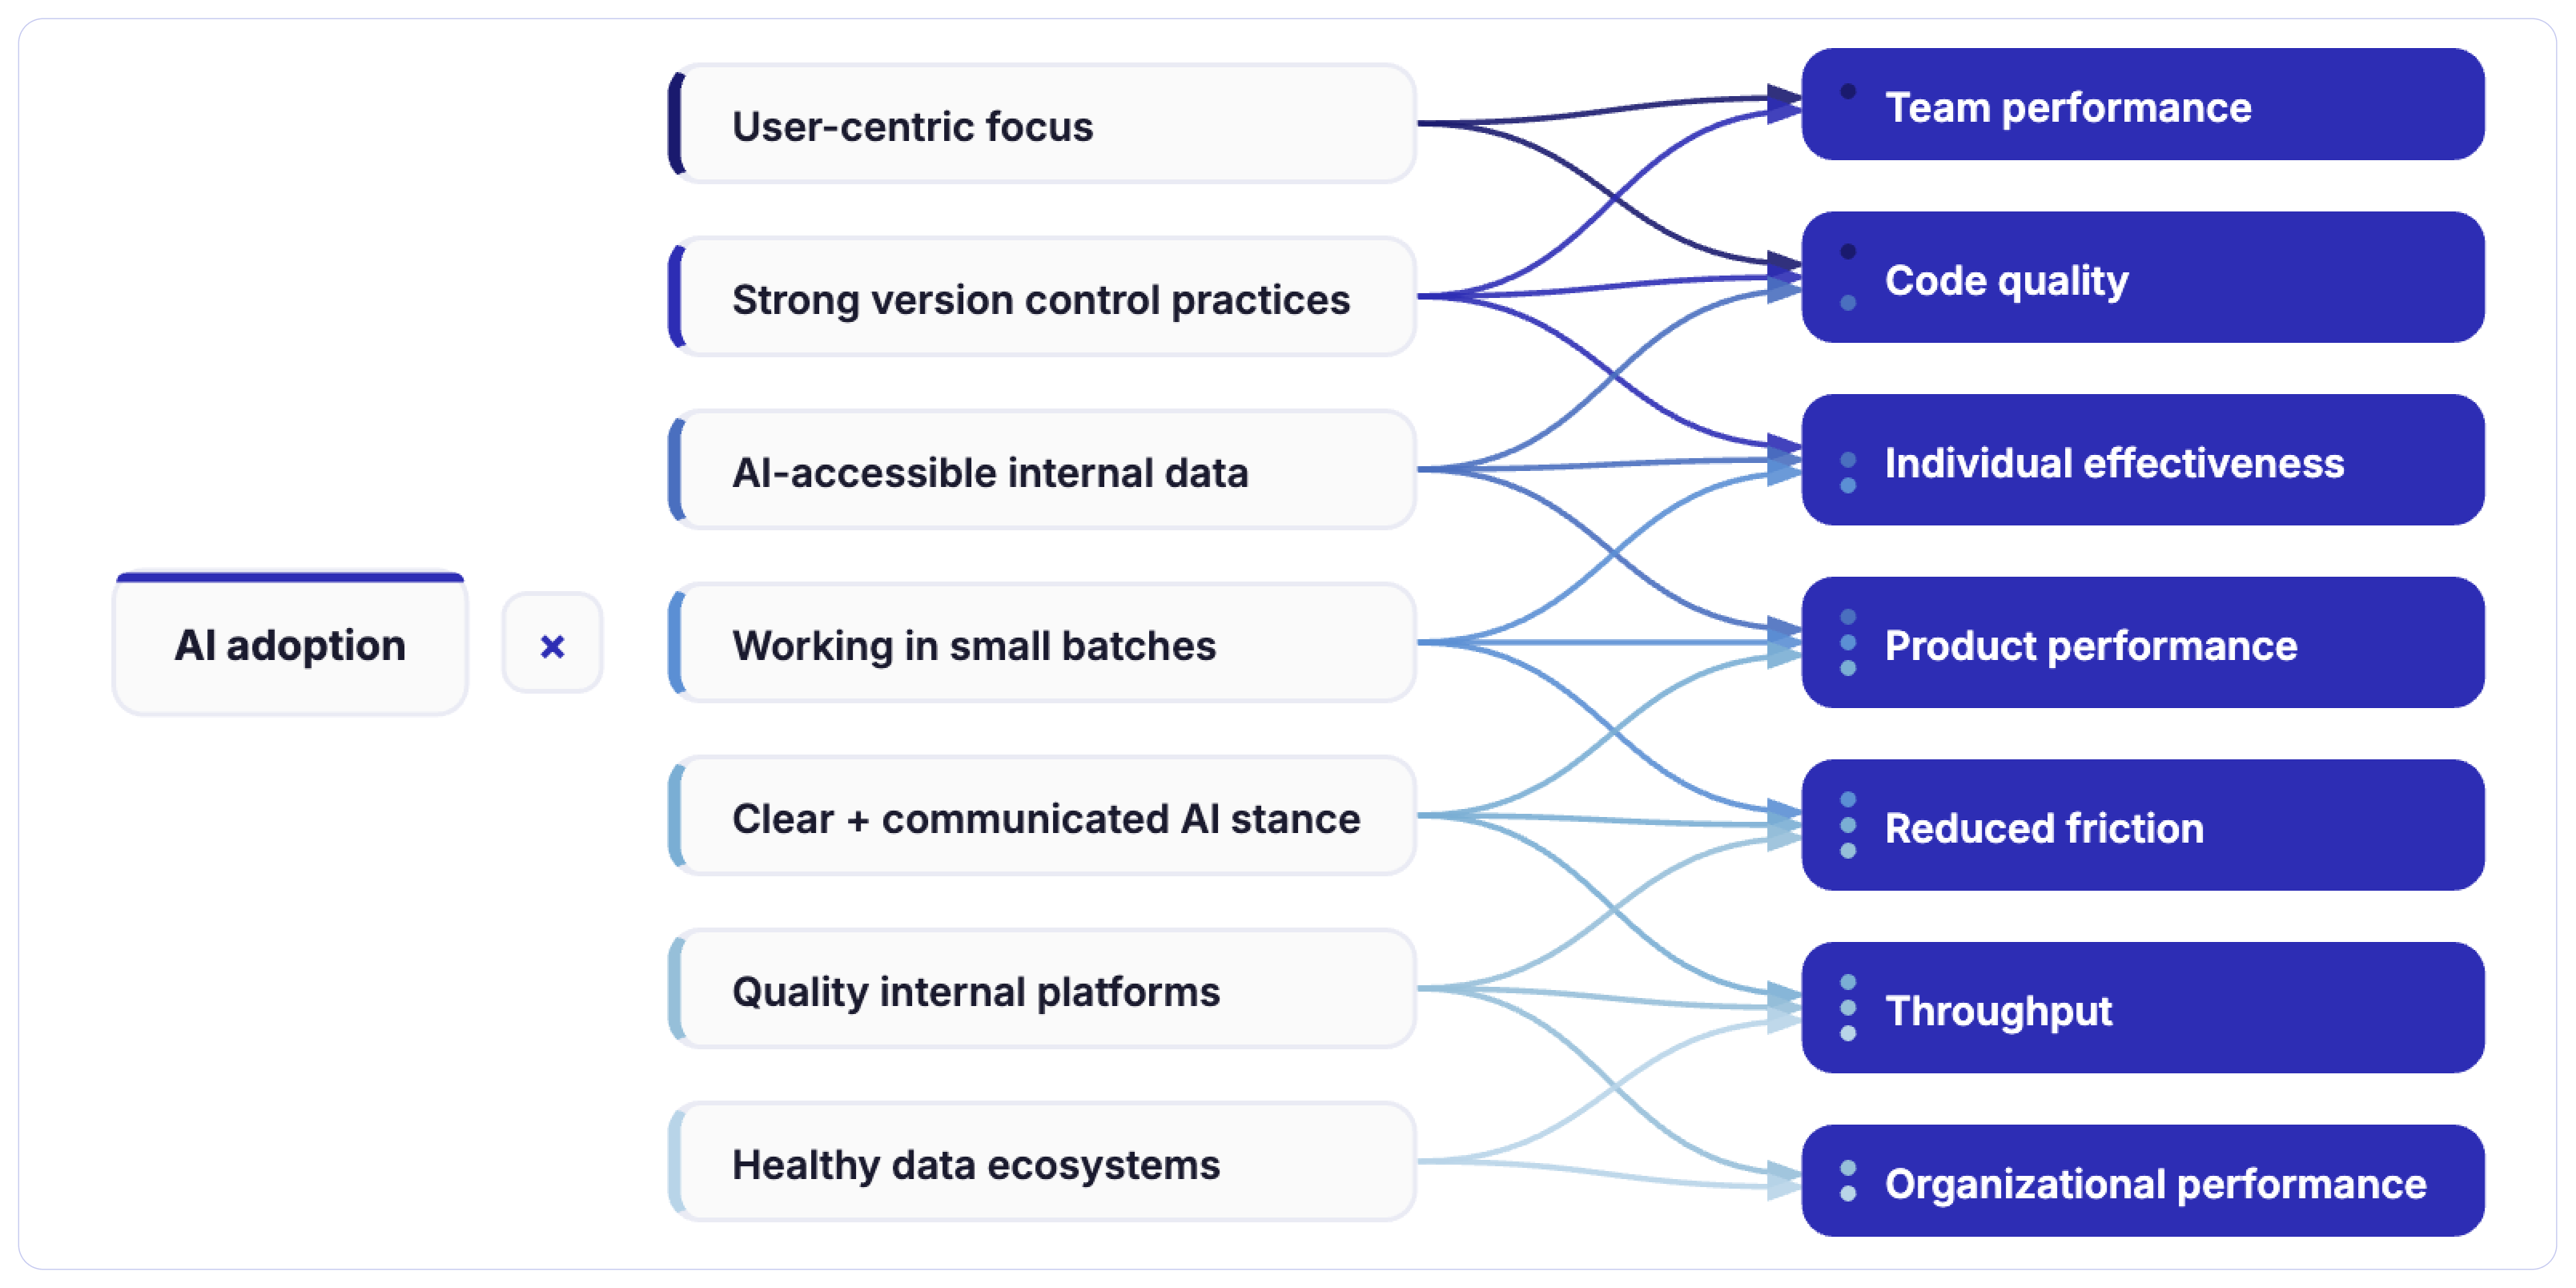
Considering the gravity of the situation, the DORA Research team kept the entire theme of their most recent report around AI. DORA’s 2025 AI Capabilities Model Report reveals a critical truth: AI’s primary role in software development is to amplify. It magnifies the
strengths of high-performing organizations and the dysfunctions of struggling ones.
Instead of only studying DevOps practices, the research now looks at how AI affects engineering teams, delivery pipelines, and system stability.
The report introduces AI as an amplifier. The following image depicts capabilities that amplify the effect of AI adoption on specific outcomes. This is the DORA AI Capabilities Model.
What it further reveals is that AI is accelerating coding, but not delivery. Developers can generate boilerplate code, write functions, or explore solutions much faster than before. However, software delivery includes many stages beyond writing code.
If these parts of the system remain slow, the overall delivery speed does not change much.
In many teams, AI simply moves the bottleneck from coding to other stages, especially code reviews and validation.
This creates a new challenge for engineering leaders.
For years, the focus was on improving developer productivity. AI is now solving part of that problem.
But the bigger question has changed.
If developers can write code faster than ever, why isn’t software reaching production faster?
The answer usually lies in the delivery system itself. And that is exactly what DORA metrics were designed to measure.
By tracking deployment frequency, lead time, failure rates, and recovery time, organizations can understand whether AI is actually improving delivery performance or just accelerating code generation.
So, it’s needless to say that DORA metrics help leaders see whether AI is improving software delivery or simply making code generation faster. And that’s why DORA is still relevant in AI-augmented development practices.
DORA 2025 research highlights an important nuance.
Writing code faster does not automatically mean delivering better software.
In many organizations, AI accelerates the creation of code, but the rest of the delivery system - reviews, testing, validation, and deployment - does not speed up at the same rate.
This mismatch introduces a new kind of risk.
In fact, some large technology companies are already responding to these challenges. After several coding incidents involving automated development tools, Amazon orders a 90-day reset after code mishaps cause millions of lost orders.
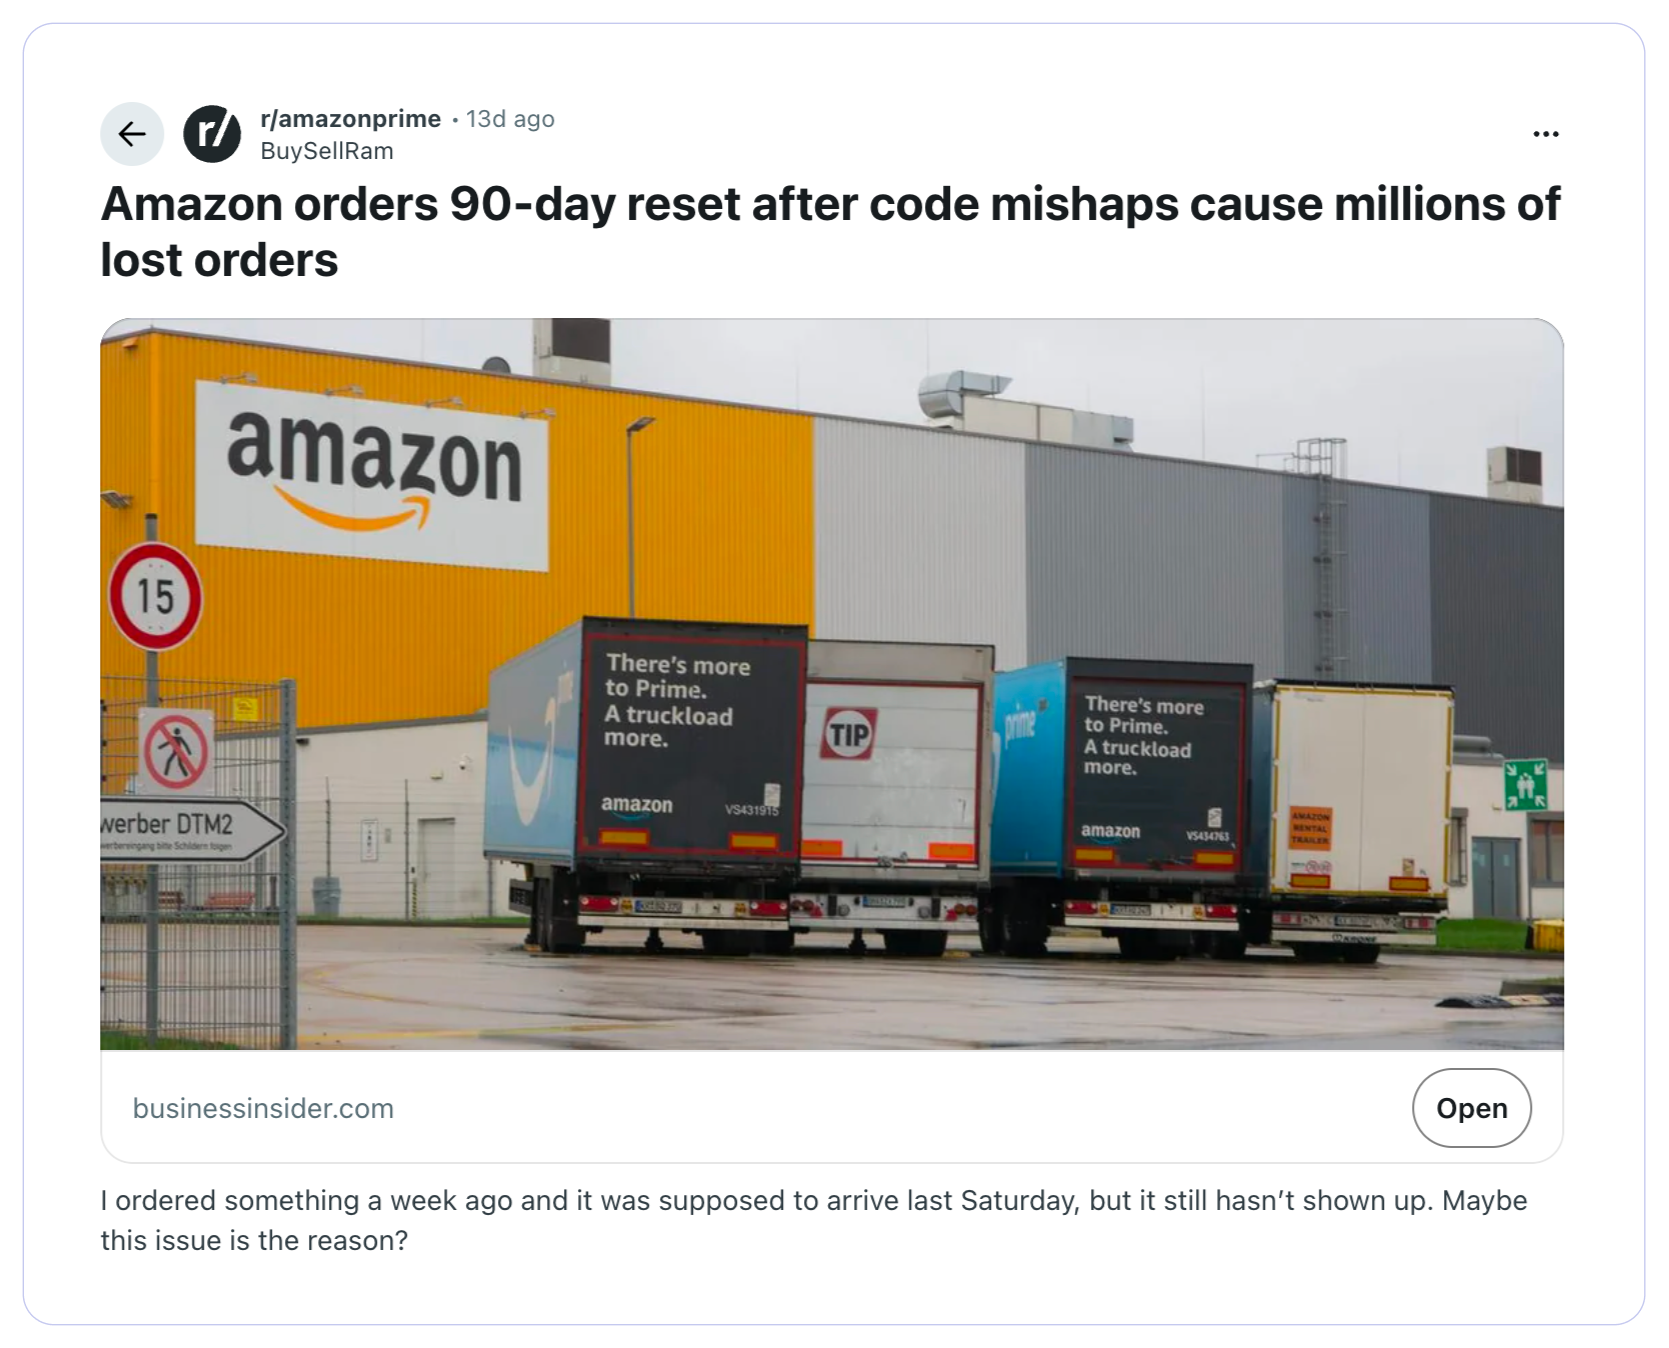
The move reflects a growing industry realization: faster code generation must be balanced with stronger safeguards in the delivery pipeline.
DORA's 2025 research found that higher AI adoption is associated with increased deployment instability. Teams generating more code with AI tools are, in many cases, experiencing more failures in production, not fewer.
More code means more surface area for bugs. More PRs mean more review load on the same number of senior engineers. More changes batching up against the same deployment windows means bigger, riskier releases. The system gets congested - and congested systems fail more often and recover more slowly.
AI didn't create any of these problems. But it turbocharged them. This leads to the Throughput Trap!
Systems that aren't optimized for AI can actually reduce delivery throughput over time when there is increased AI adoption.
Think about what happens to a delivery pipeline when the volume of code going into it suddenly doubles. Every stage downstream from code generation now has twice the work to process.
When an individual developer can write a function in five minutes that used to take an hour, that feels like a genuine, meaningful productivity gain.
But individual productivity and system-level delivery performance are different things. The gap just wasn't this visible before AI made individual productivity gains so dramatic.
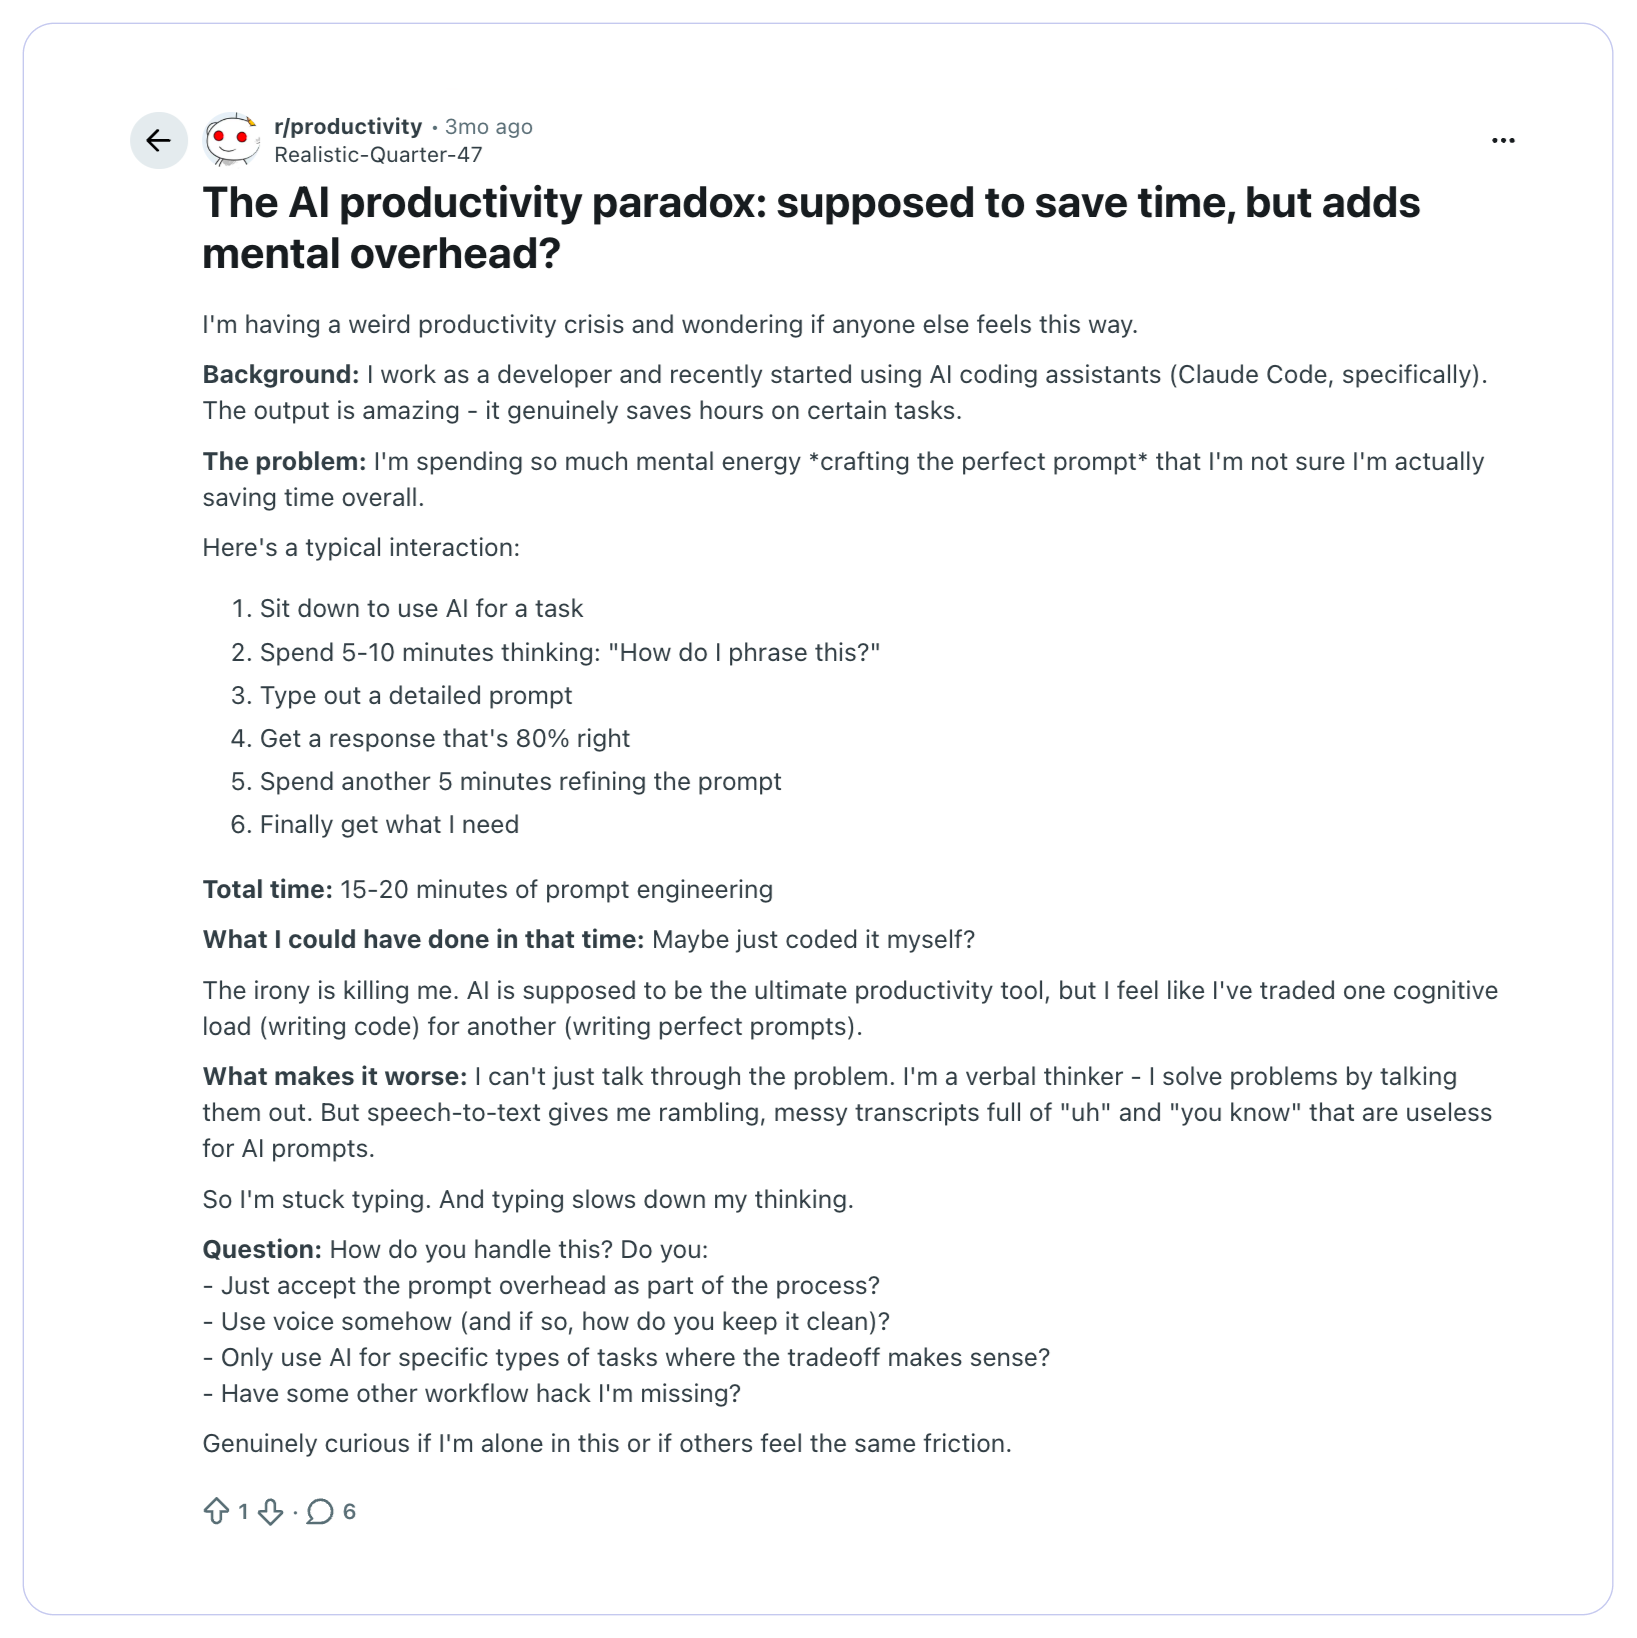
However, several developers acknowledge that AI is infusing artificial productivity gain by making them feel productive for the time being. In this Reddit thread, one developer shares his frustration with the idea of being productive by using AI.
In many cases, the time saved during coding is later spent reviewing, validating, or fixing AI-generated logic. Developers may write more code in less time, but they also need to spend additional effort ensuring the generated code actually works as intended.
This creates a subtle illusion of progress - developers feel faster, while the overall delivery pipeline may remain unchanged.
In the past, it was easier to interpret productivity signals. More commits or faster coding usually meant work was progressing.
With AI, those signals can become misleading.
A developer may generate large amounts of code quickly, yet the system may take longer to review, test, and deploy that code safely.
This creates a new leadership question: Are teams actually delivering faster, or are they simply generating code faster?
This is precisely why DORA metrics matter more in the AI era. Deployment frequency, lead time for changes, change failure rate, and MTTR measure the system. They can't be fooled by how productive someone feels. They measure what the pipeline is actually producing.
If AI is genuinely improving your delivery performance, it will show in those numbers. If AI is generating more code in a congested pipeline while your change failure rate climbs and your lead time extends, that will show too.
The DORA research program introduced a new framework to help organizations understand why AI improves performance in some teams but not in others.
This framework is called the DORA AI Capabilities Model.
Instead of focusing on AI tools themselves, the model highlights organizational and engineering capabilities.
The key insight from the research is simple: AI success depends far more on system design and engineering practices than on the tools themselves.
The DORA research shows that AI acts as a multiplier.
When these capabilities exist, AI amplifies productivity, improves product outcomes, and increases organizational performance.
But when these foundations are weak, AI can amplify the opposite effects - introducing instability, increasing friction, and exposing weaknesses in the delivery system.
In other words, AI does not automatically make engineering teams high-performing.
The surrounding system determines whether AI becomes an accelerator or a source of new complexity.
One of the most important insights from the latest DORA research is that AI tools alone cannot improve software delivery performance.
AI can make developers faster at writing code. It can suggest implementations, generate tests, and reduce the time spent on repetitive tasks. At the level of an individual engineer, these gains can feel dramatic.
But software delivery performance is determined by how effectively an entire engineering system moves changes from development to production.
This is exactly what DORA metrics measure.
The research repeatedly highlights a critical principle:
AI amplifies the system it operates in.
If an organization already has strong delivery practices - small batch changes, reliable CI/CD pipelines, strong testing, and well-structured platforms - AI accelerates those systems. Teams can deliver improvements faster and with less friction.
But if the delivery system has weaknesses, AI tends to magnify them.
Faster code generation may produce:
In this case, AI increases activity in the system without improving the system itself.
Where Many Organizations Struggle When it Comes to Improving DORA
The organizations that fail to see improvements in DORA metrics after adopting AI usually share a common set of gaps.
In these situations, AI produces localized productivity gains.
The DORA research ultimately reinforces a principle that has been consistent for more than a decade:
Engineering performance is determined by the system, not individual productivity.
AI improves how quickly developers can produce code. But the outcomes that matter - deployment frequency, lead time, stability, and recovery - depend on the health of the entire delivery pipeline.
When organizations strengthen that system, AI becomes a powerful accelerator.
When they do not, AI simply adds more velocity to the first step of the process while the rest of the system struggles to keep up.
And that is why, even in the age of AI-assisted development, DORA metrics remain essential for understanding real engineering performance.
How Engineering Leaders Use DORA Metrics in Practice
Understanding DORA metrics is useful. But their real value appears when teams use them to continuously improve how software is delivered.
Many engineering organizations operationalize DORA metrics using a continuous improvement approach similar to the PDCA Cycle, a widely used framework in Lean and quality engineering.
This approach helps teams improve delivery systems incrementally instead of attempting large transformations all at once.
The following are the 4 major use cases of DORA for engineering leaders.
Engineering leaders use DORA metrics as an operational dashboard for their delivery systems.
Signals such as deployment frequency and lead time help teams understand whether the pipeline is flowing smoothly or slowing down.
Sudden changes in these metrics often indicate friction in the system long before major delivery problems appear.
DORA metrics are also extremely effective at locating hidden bottlenecks.
For example:
Code review is one of the most common bottlenecks revealed by DORA metrics.
When lead time grows, teams often discover that pull requests are too large or reviewers are overloaded.
Engineering leaders improve review cycles by:
These changes reduce review delays and improve delivery flow.
The most powerful use of DORA metrics is tracking improvement trends over time.
Instead of focusing on benchmarks alone, high-performing teams observe how metrics evolve as their systems improve.
Over time, they expect to see patterns such as:
This turns DORA metrics into a continuous improvement engine for software delivery.
DORA metrics are powerful, but only when teams can measure them consistently and reliably.
Common Ways Teams Track DORA Metrics…
Most mature organizations eventually move toward engineering intelligence platforms or DORA metrics tools because they provide a system-level view of software delivery.
Not every tool that claims to track DORA metrics provides meaningful insights. The most effective platforms typically offer several key capabilities.
When implemented well, these tools turn DORA metrics into a real-time view of engineering delivery performance.
And as software systems grow more complex - especially in the AI era - this level of context-rich insights becomes increasingly essential.
Engineering organizations have spent years trying to answer a simple but difficult question:
How do we measure the true performance of software teams?
The introduction of DORA metrics or DevOps metrics shifted the industry toward measuring system-level delivery performance.
However, today’s teams operate in environments shaped by distributed architectures, platform engineering, and increasingly AI-assisted development. These changes have made it clear that understanding delivery performance alone is not enough.
Organizations now want to understand how engineers work within the system as well.
Expanding the Measurement Stack
Modern engineering leaders are beginning to combine DORA DevOps metrics with additional frameworks that capture a broader view of engineering performance.
The future of engineering metrics is therefore not about replacing DORA metrics.
Instead, it is about building a layered measurement model.
DORA continues to measure the health of the delivery system. Other frameworks add context about how developers experience that system and how work flows through it.
This combined approach allows organizations to optimize both sides of engineering performance:
When these two dimensions improve together, engineering teams achieve what every modern software organization ultimately aims for: faster innovation, more reliable systems, and sustainable developer productivity.
Final Thoughts: Measuring What Actually Drives Software Delivery
“Improving software delivery isn’t about pushing people harder. It’s about improving the system they work in.” - Jez Humble, Co-author of the book, Continuous Delivery & core member of early DORA leadership group
This statement challenges one of the oldest instincts in engineering leadership: when delivery slows down, the first reaction is often to push teams to work faster.
History shows that the approach rarely works.
Software delivery performance is not limited by individual effort. It is shaped by the system that surrounds the engineers.
When that system is inefficient, even the most talented developers struggle to deliver consistently. When the system is well designed, teams can ship faster without increasing risk or burnout.
The real engineering progress is measured differently.
It shows up in faster delivery of meaningful changes, more stable systems, and quicker recovery when things fail. That is what DORA metrics reveal.
And for engineering leaders willing to look honestly at those signals, they offer something far more valuable than a dashboard!

Uncover hidden productivity bottlenecks in your development workflow
Streamline code review processes to improve efficiency and reduce cycle times


We'll show you exactly how AI is impacting your speed and code quality.


