What happened?
Schedule a Free Demo


You're about to make a hiring decision. Double the team, or keep it lean?
Someone asks: "How productive is the current team?"
You look at your dashboards. Commits per developer. Lines of code. Story points completed. Tickets closed.
None of these numbers answers the question.
That's because measuring software engineering productivity in 2026 isn't like measuring factory output. You can't count widgets. Code isn't linear. Quality matters more than quantity. And the best developers often write less code, not more.
Even in developer communities, the consensus is clear. One popular Reddit thread summed it up bluntly: “Lines of code have never made sense at all to track.”
Yet the question persists. Because it matters.
When you're scaling, you need to know if adding headcount will actually increase output. When you're improving processes, you need to know if they're working. When you're investing in tooling, you need to understand the return.
The challenge isn't whether to measure developer productivity, it's how to measure it. Most productivity initiatives fail not because teams resist measurement, but because the wrong things are measured for the wrong reasons.
This guide shows you how to measure software developer productivity in a way that doesn’t distort behavior or break what makes engineering work, and reveals system health.
Software engineering productivity is the ability of an engineering system to consistently deliver valuable, reliable changes to production at a sustainable pace, without increasing risk, burnout, or operational instability.
This definition matters because it deliberately avoids:
Those are tempting proxies. They’re also where productivity measurement usually goes wrong.
What productivity is not:
As teams scale, productivity stops being an individual trait and becomes an emergent property of the system, shaped by workflow design, prioritization, tooling, dependencies, and feedback loops.
One-line takeaway:
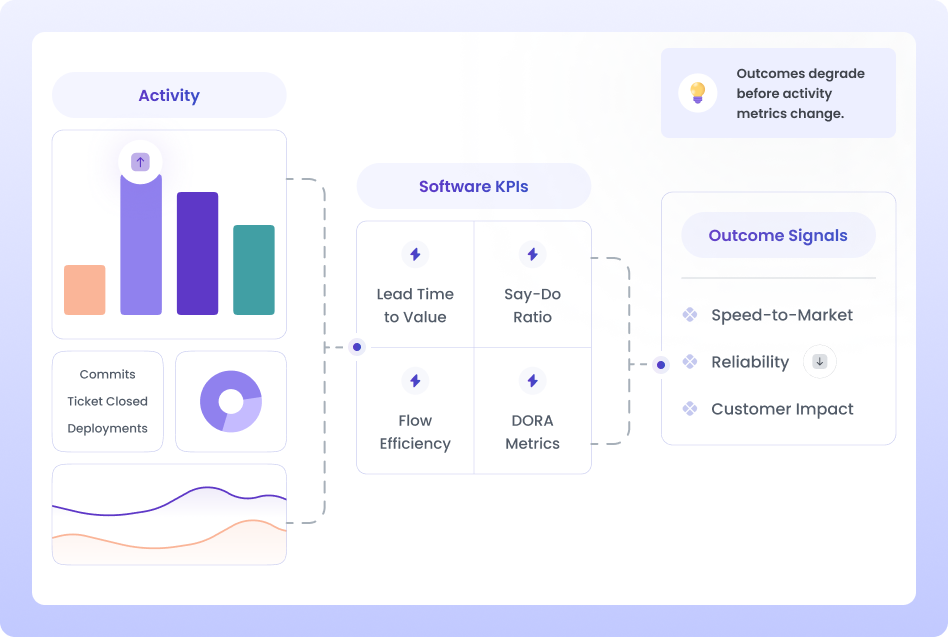
Engineering productivity measures how effectively effort is converted into stable, customer-impacting outcomes over time.
[Insert - Image 1]
Effort → Workflow → Outcomes → Stability
Developer productivity is the degree to which an individual developer can efficiently and correctly translate intent into working code, with minimal friction, cognitive overhead, and unnecessary delay.
Developer productivity is shaped by:
A productive developer can still contribute to an unproductive system if priorities, coordination, or architecture are misaligned.
Let's start with why this is difficult.
In manufacturing, productivity is simple: units produced per hour.
In software development, that breaks down immediately.
A developer who writes 1,000 lines of code might be less productive than one who deletes 500 lines while solving the same problem more elegantly.
A developer who spends a week refactoring technical debt might produce zero user-facing features but massively improve future velocity.
A developer who mentors junior engineers might have lower individual output but increase team productivity by 20%.
Output doesn't equal productivity.
When you measure the wrong things, teams optimize for the measurement instead of the outcome.
Examples:
Kent Beck said it best: "I'm not a great programmer. I'm just a good programmer with great habits."
The right metrics encourage great habits. The wrong ones destroy them.
Another complexity: productivity exists at multiple levels.
Most attempts at measuring developer productivity fail because they focus on individuals when they should focus on systems.
In 2026, measuring software developer productivity requires accounting for AI assistance.
According to GitHub's research, developers using AI coding assistants complete tasks 55% faster. But raw speed doesn't tell the full story.
New questions:
Traditional developer productivity metrics weren't built for this world.
Jack Atlman, a well-known podcaster and AI investor from the Bay Area, and younger brother of Sam Altman discussed the AI productivity paradox with the host.
https://x.com/jaltma/status/1950608781479731491
Instead of looking for a single "developer productivity metric," use a framework that captures multiple dimensions.
Measuring only one dimension gives you an incomplete picture. High throughput with low quality isn't productivity - it's technical debt accumulation.
Microsoft Research developed the SPACE framework for measuring developer productivity across five dimensions:
The framework explicitly rejects single-metric approaches. Instead, it combines multiple signals to understand productivity holistically.
What it sounds like: “We just know when things are slow.”
Start with:
Avoid:
What it sounds like: “We have dashboards, but we don’t trust them.”
Primary focus:
Introduce:
What it sounds like: “Different teams report different numbers.”
Primary focus:
Expand to include:
What it sounds like: “We use metrics weekly to make decisions.”
Primary focus:
Optimize with:
Let's break down specific metrics, when to use them, and what they actually tell you.
What it measures: How often code reaches production.
Why it works: High deployment frequency correlates with:
How to measure:
Limitations:
💡 Best practice: Track deployment frequency alongside change failure rate. Speed without stability isn't productivity.
What it measures: Time from first commit to production deployment.
Why it works: Shorter lead time means:
How to measure:
What it reveals:
Limitations:
💡Tip: A rising lead time with stable cycle time is almost always a sign of growing queues between stages not slower developers. The bottleneck is structural, not human.
What it measures: Time from work starting to work completing.
Why it works: Short, consistent cycle time indicates:
How to measure:
What it reveals:
Limitations:
💡 Best practice: Stable cycle time with increasing lead time is an early warning that queues are growing.
What it measures: Percentage of deployments causing incidents or requiring rollback.
Why it works: Low failure rates indicate:
How to measure:
What it reveals:
Limitations:
💡 Best practice: Create psychological safety around failures. If teams hide incidents to protect metrics, the data becomes worthless.
What it measures: Time from PR creation to merge.
Why it works: Long PR cycle times reveal:
How to measure:
What it reveals:
Limitations:
💡 Best practice: Track PR size alongside cycle time. Smaller PRs should merge faster. If they don't, you have a process problem.
What it measures: Percentage of work spent fixing or redoing previous work.
Why it works: High rework indicates:
How to measure:
What it reveals:
Limitations:
💡 Best practice: Rework is created upstream—from unclear requirements, late feedback, and shifting priorities. Fix the source, not the symptom.
What it measures: Number of tasks currently in progress.
Why it works: High WIP indicates:
How to measure:
What it reveals:
Limitations:
💡 Best practice: Limit WIP before trying to increase throughput. More parallel work usually means slower overall delivery.
What it measures: Lines of code rewritten shortly after being written.
Why it works: High churn suggests:
How to measure:
What it reveals:
Limitations:
💡 Best practice: Some churn is healthy. Look for patterns and outliers, not absolute numbers.
What it measures: How long it takes to restore service after a failure.
Why it works: Low MTTR indicates:
How to measure:
What it reveals:
Limitations:
💡 Best practice: Focus on reducing MTTR first, then work on preventing failures. Recovery capability matters more than failure avoidance.
Some metrics seem logical but create more problems than they solve.
Why it's tempting: Easy to measure. Seems objective.
Why it fails:
Real example: A developer spent a week reducing a 2,000-line function to 300 lines with better architecture. Metrics showed -1,700 LOC. Management questioned their productivity.
What to use instead: Focus on delivered value, not code volume.
Why it's tempting: Shows activity. Easy to track.
Why it fails:
Real example: A team started measuring commits per developer. Within a month, developers were breaking single logical changes into 5-10 commits to "look productive."
What to use instead: Track deployment frequency or feature delivery.
Why it's tempting: Seems to measure team capacity and velocity.
Why it fails:
Real example: Two teams reported the same velocity: 40 points per sprint. One shipped major features. The other inflated estimates and delivered minor updates.
What to use instead: Track actual delivery and cycle time.
Why it's tempting: Higher coverage should mean better quality.
Why it fails:
Real example: A team hit 90% code coverage. Tests passed. Production still had major bugs because tests checked that functions ran, not that they worked correctly.
What to use instead: Track defect escape rate and change failure rate.
Why it's tempting: Seems to show utilization and effort.
Why it fails:
Real example: A company implemented time tracking. Developers started "looking busy" instead of solving problems. Best performers left within six months.
What to use instead: Focus on outcomes and delivery, not input.
Theory is useful. Implementation is hard. Here's how to actually do this.
Before measuring anything, answer these questions:
What business outcomes matter?
What engineering outcomes support those?
What behaviors do you want to encourage?
Don't try to measure everything. Pick metrics that:
Example metric:
Before changing anything:
Baselines let you measure improvement and avoid overreacting to noise.
Good dashboards show:
Bad dashboards show:
Weekly: Look for major anomalies requiring immediate attention
Monthly: Review trends and identify patterns
Quarterly: Assess whether metrics still align with goals
Important: Don't react to every fluctuation. Productivity metrics are directional, not absolute.
Metrics tell you what happened. Developers tell you why.
Regular check-ins should ask:
Combine quantitative metrics with qualitative feedback.
What works at 10 developers doesn't work at 100. Here's how measurement changes with scale.
💡 Focus: Keep measurement lightweight. Use metrics to spot trends, not manage daily work.
💡 Focus: Measure teams as systems. Compare teams to themselves over time, not to each other.
💡 Focus: Understand system health and organizational patterns. Use metrics to find improvement opportunities, not to rank teams.
Even well-intentioned measurement programs fail. Here's why.
The error: Tracking productivity per developer and comparing team members.
Why it backfires:
The fix: Measure teams and systems. Use individual data only for coaching, never for comparison.
The error: "We need to increase deployment frequency" becomes the only goal.
Why it backfires:
The fix: Always use balanced scorecards. Track speed + quality + sustainability together.
The error: Comparing metrics across teams with different:
Why it backfires:
The fix: Compare teams to themselves over time. Use benchmarks as guides, not goals.
The error: Tying compensation or promotion decisions to productivity metrics.
Why it backfires:
The fix: Use metrics for system improvement, not individual evaluation. Keep performance reviews qualitative and holistic.
The error: Tracking inputs (hours, commits, meetings) instead of outputs (features, reliability, customer value).
Why it backfires:
The fix: Focus on business outcomes and delivery results. Activity metrics are diagnostic tools, not success measures.
The error: Creating comprehensive dashboards with 20+ metrics that no one actually uses.
Why it backfires:
The fix: Start with 3-5 core metrics. Add more only when you're actively using what you have.
Developer Productivity Measurement Tools
Measuring software engineering productivity requires the right tooling infrastructure.
Automatic data collection:
Context-rich analysis:
Privacy-respecting:
Actionable insights:
Version control (GitHub, GitLab, Bitbucket):
CI/CD (Jenkins, CircleCI, GitHub Actions):
Issue tracking (Jira, Linear, Asana):
Incident management (PagerDuty, Opsgenie):
Communication (Slack, Teams):
Traditional measurement tools weren't built for AI-assisted development.
What's missing:
What modern tools need:
According to Stack Overflow's 2025 survey, 84% of developers are using or planning to use AI tools. Productivity measurement must evolve to match.
Hivel was built specifically for this new reality.
Instead of bolting AI metrics onto traditional productivity tracking, Hivel:
Measures what actually matters:
Provides context-rich insights:
Respects engineering culture:
Global engineering teams using Hivel insights:
Theory meets reality. Here's how different companies approach this.
Context:
Challenge: Shipping fast but breaking things. How to balance speed and stability?
Metrics chosen:
What they learned:
Actions taken:
Results after 3 months:
Key insight: Sometimes you ship faster by shipping less frequently with higher quality.
Context:
Challenge: Inconsistent delivery. Some teams shipping weekly, others quarterly. Why?
Metrics chosen:
What they learned:
Actions taken:
Results after 6 months:
Key insight: The slowest teams weren't less productive—they faced more organizational friction.
Context:
Challenge: Developers shipping faster with AI, but is code quality suffering?
Metrics chosen:
What they learned:
Actions taken:
Results after 4 months:
Key insight: AI accelerates development, but requires new review practices and architectural oversight.
The landscape is shifting. Here's where it's headed.
Traditional metrics measured activity. Modern metrics measure impact.
The shift: From counting to understanding impact.
The focus is moving from developer performance to system performance.
Old approach:
New approach:
The shift: From optimizing people to optimizing systems.
Measurement is becoming a tool for improvement, not control.
Old approach:
New approach:
The shift: From monitoring to enabling.
AI coding assistants are changing what productivity means.
Current reality:
Emerging questions:
The shift: From measuring human output to measuring human + AI outcomes.
You don't need perfect measurement to start. Here's what to do now.
Actions:
Output: A one-page document defining what productivity means for your context.
Actions:
Output: A short list of metrics with definitions everyone understands.
Actions:
Output: Baseline data showing where you are today.
Actions:
Output: A usable dashboard that people actually look at.
Actions:
Output: Regular measurement rhythm and continuous improvement.
The goal of measuring software engineering productivity isn't to rank developers or enforce quotas.
It's to understand your system well enough to improve it.
Good measurement:
Bad measurement:
The test of good measurement: Do your teams want to look at the metrics? Do they use them to improve their work? Do they trust the numbers?
If the answer is no, you're measuring wrong.
If the answer is yes, you're on the right path.
Metrics don’t create productivity, they reveal leadership tradeoffs.
If measurement creates fear, then the system is broken, not the team.
Ready to measure what actually matters? Book a demo to see how Hivel helps engineering teams track productivity without surveillance.
AI coding assistants change what to measure:The 40-20-40 rule in software engineering takes about where engineering time goes.
Traditional metrics (commits, LOC) become less meaningful
Need to track AI suggestion acceptance rates
Must correlate AI usage with quality outcomes
Review processes need adjustment for AI-generated code
Focus shifts to problem-solving ability vs. code writing speed
Modern measurement tools must account for AI assistance.
Developer productivity measures output and efficiency of the development process (how much value is created with available resources).
Developer performance evaluates how well individual developers or teams execute their responsibilities (quality of work, collaboration, growth).
Productivity is about the system. Performance is about the people. Both matter, but require different measurement approaches.
Start with 3-5 core metrics that:
Balance different dimensions (speed, quality, sustainability)
Support specific decisions
Complement each other
Are actually actionable
Add more only when you're consistently using what you have. Too many metrics create noise and overwhelm.
Measure agile engineering productivity using:
Cycle time (how long work takes once started)
Deployment frequency (how often you ship)
Work in progress (how much is in flight)
Customer feedback and adoption
Avoid using story points or velocity as productivity measures—they're planning tools, not performance indicators.
Developer efficiency metrics measure how smoothly work flows:
Lead time for changes (end-to-end delivery speed)
Cycle time (active work duration)
Work in progress (queue size)
PR cycle time (review speed)
Wait time between stages
Efficiency metrics show where work gets stuck, not how hard people work.
Measure systems and teams, not individuals:
Focus on team-level metrics
Track outcomes, not activity
Review trends, not daily snapshots
Use metrics for improvement, not judgment
Combine quantitative data with qualitative feedback
Create psychological safety. When developers trust measurement won't be used against them, metrics become useful instead of toxic.

Uncover hidden productivity bottlenecks in your development workflow
Streamline code review processes to improve efficiency and reduce cycle times


