Book a demo

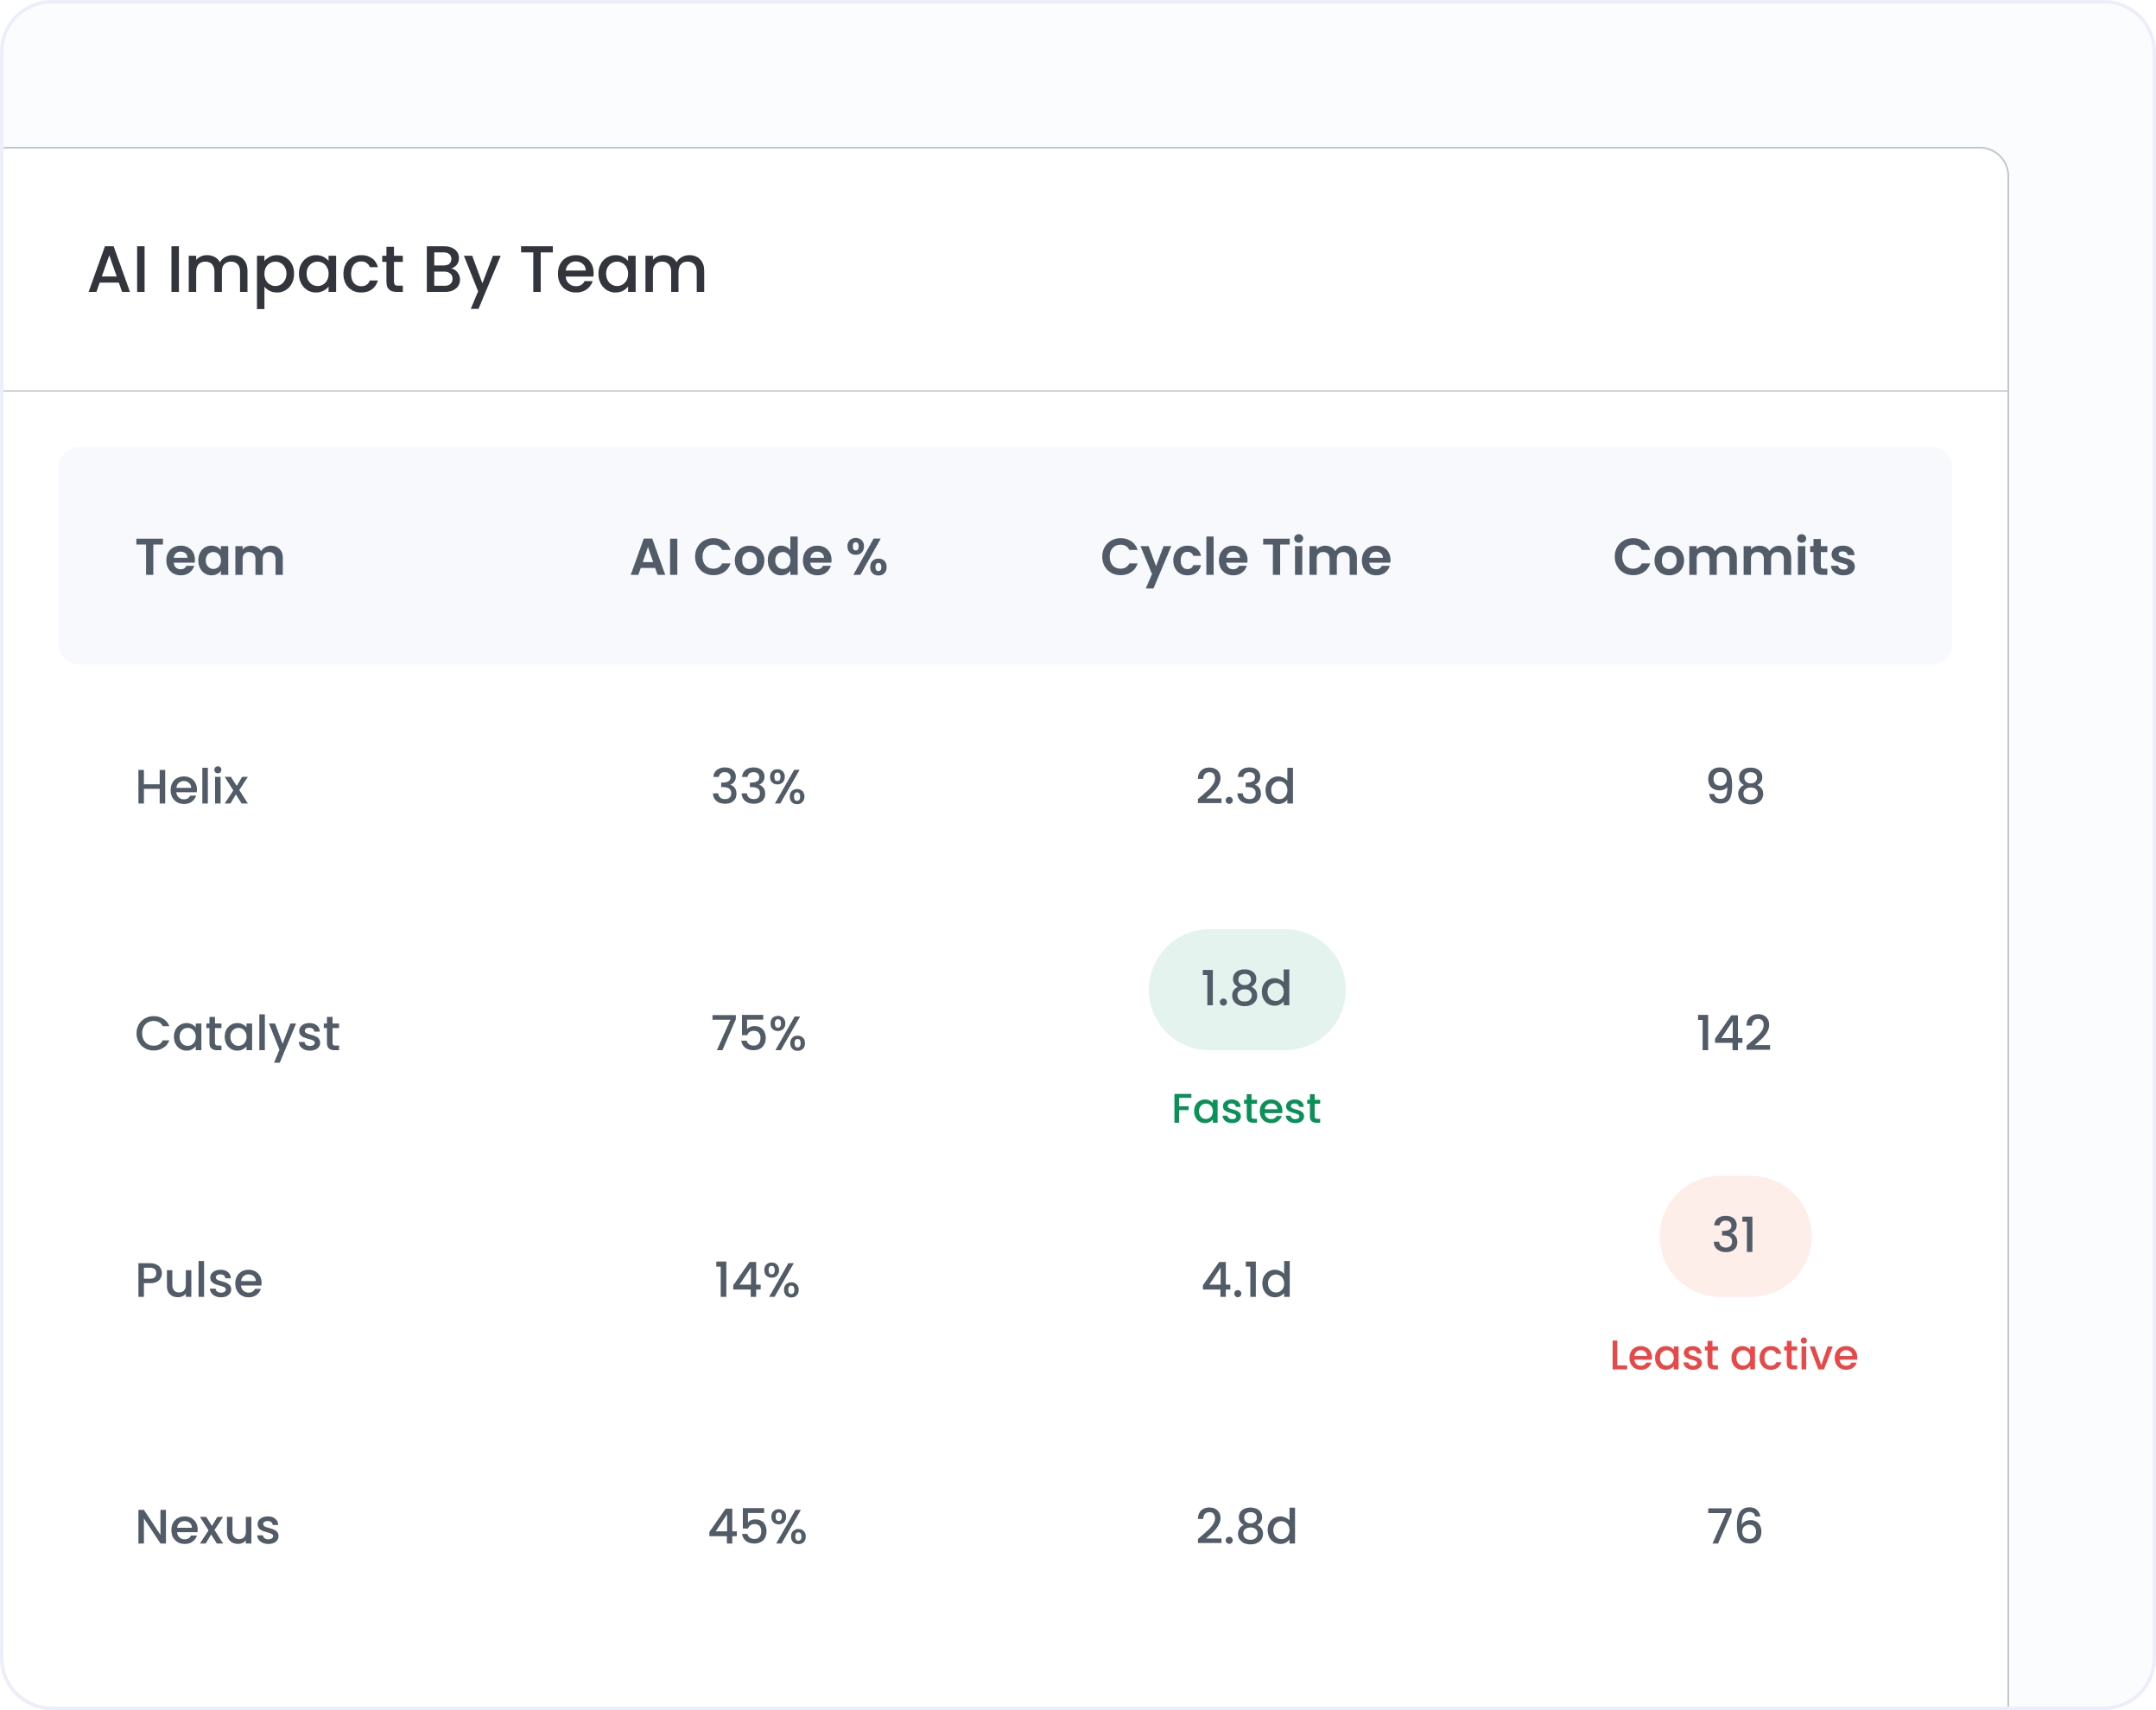
We'll show you exactly how AI is impacting your speed and code quality.

4.7/5
AI Code Telemetry (ACT)

See how much AI code you really ship.

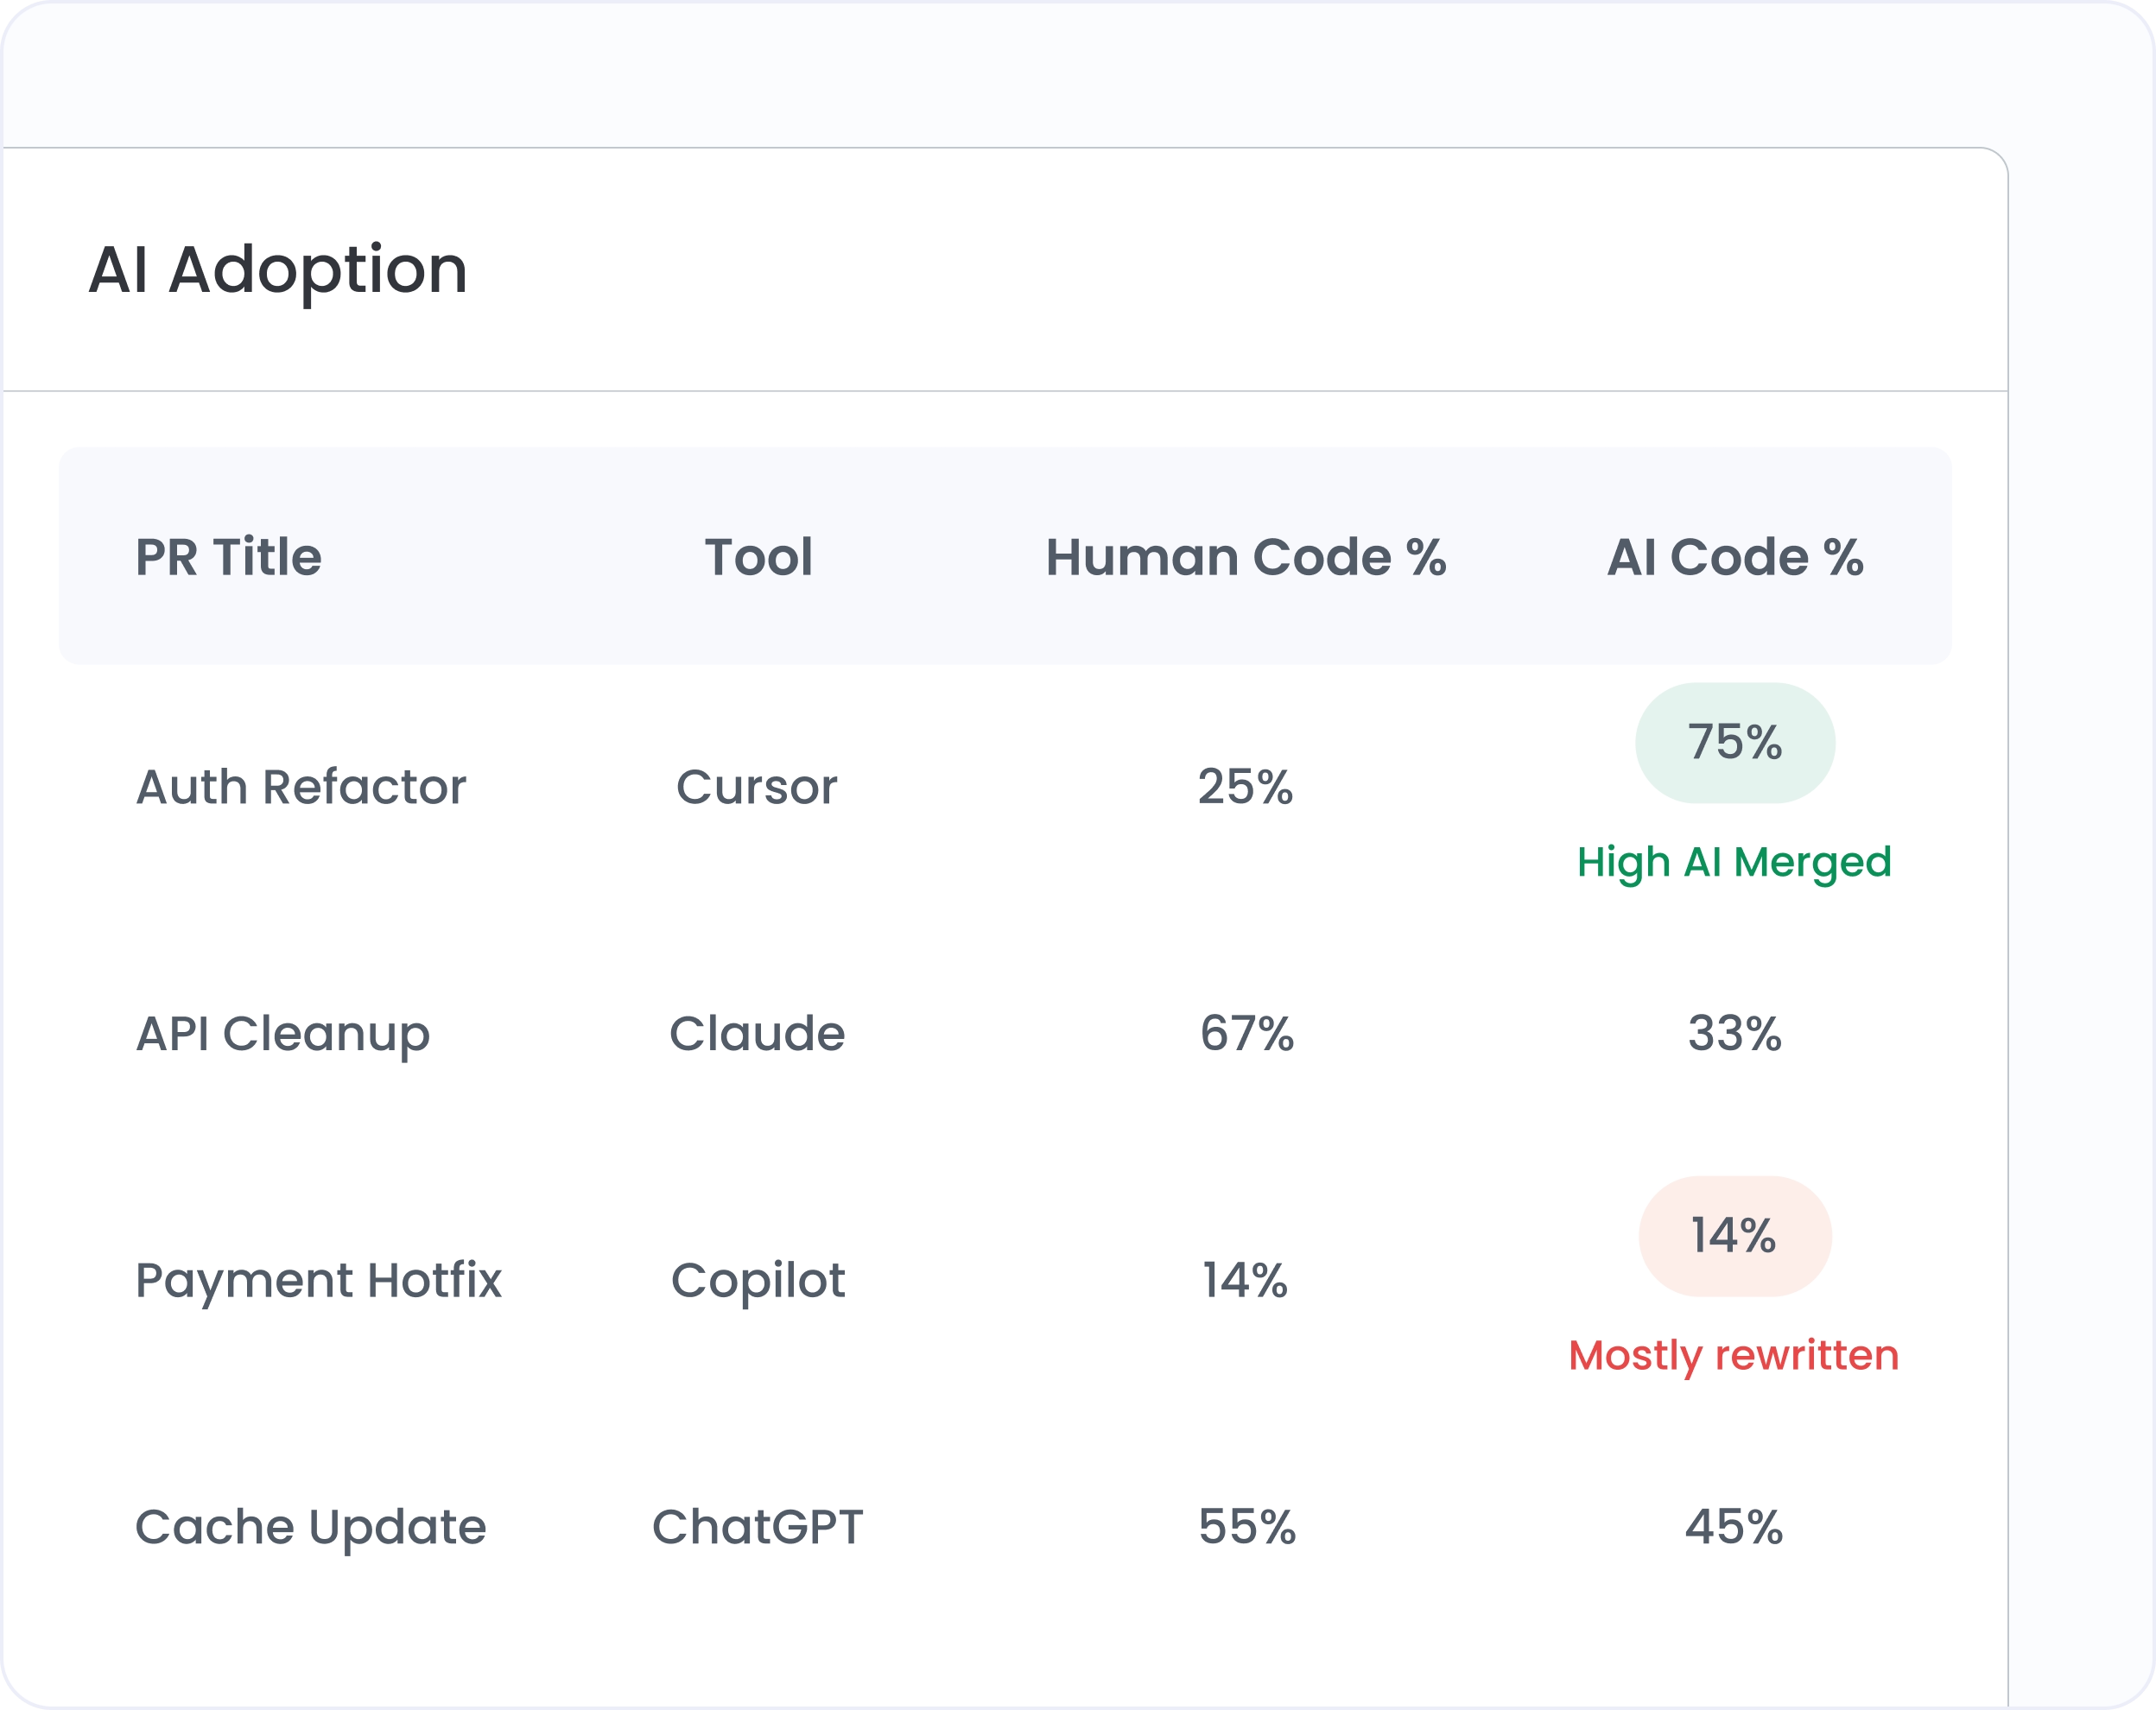
Vendor dashboards inflate adoption numbers with activity that never reaches production. ACT measures AI-generated code that survives review and merges, so you can prove real adoption, impact, and ROI.
4.7/5

From activity to shipped code to financial impact.

Measure AI code that survives review and reaches merge

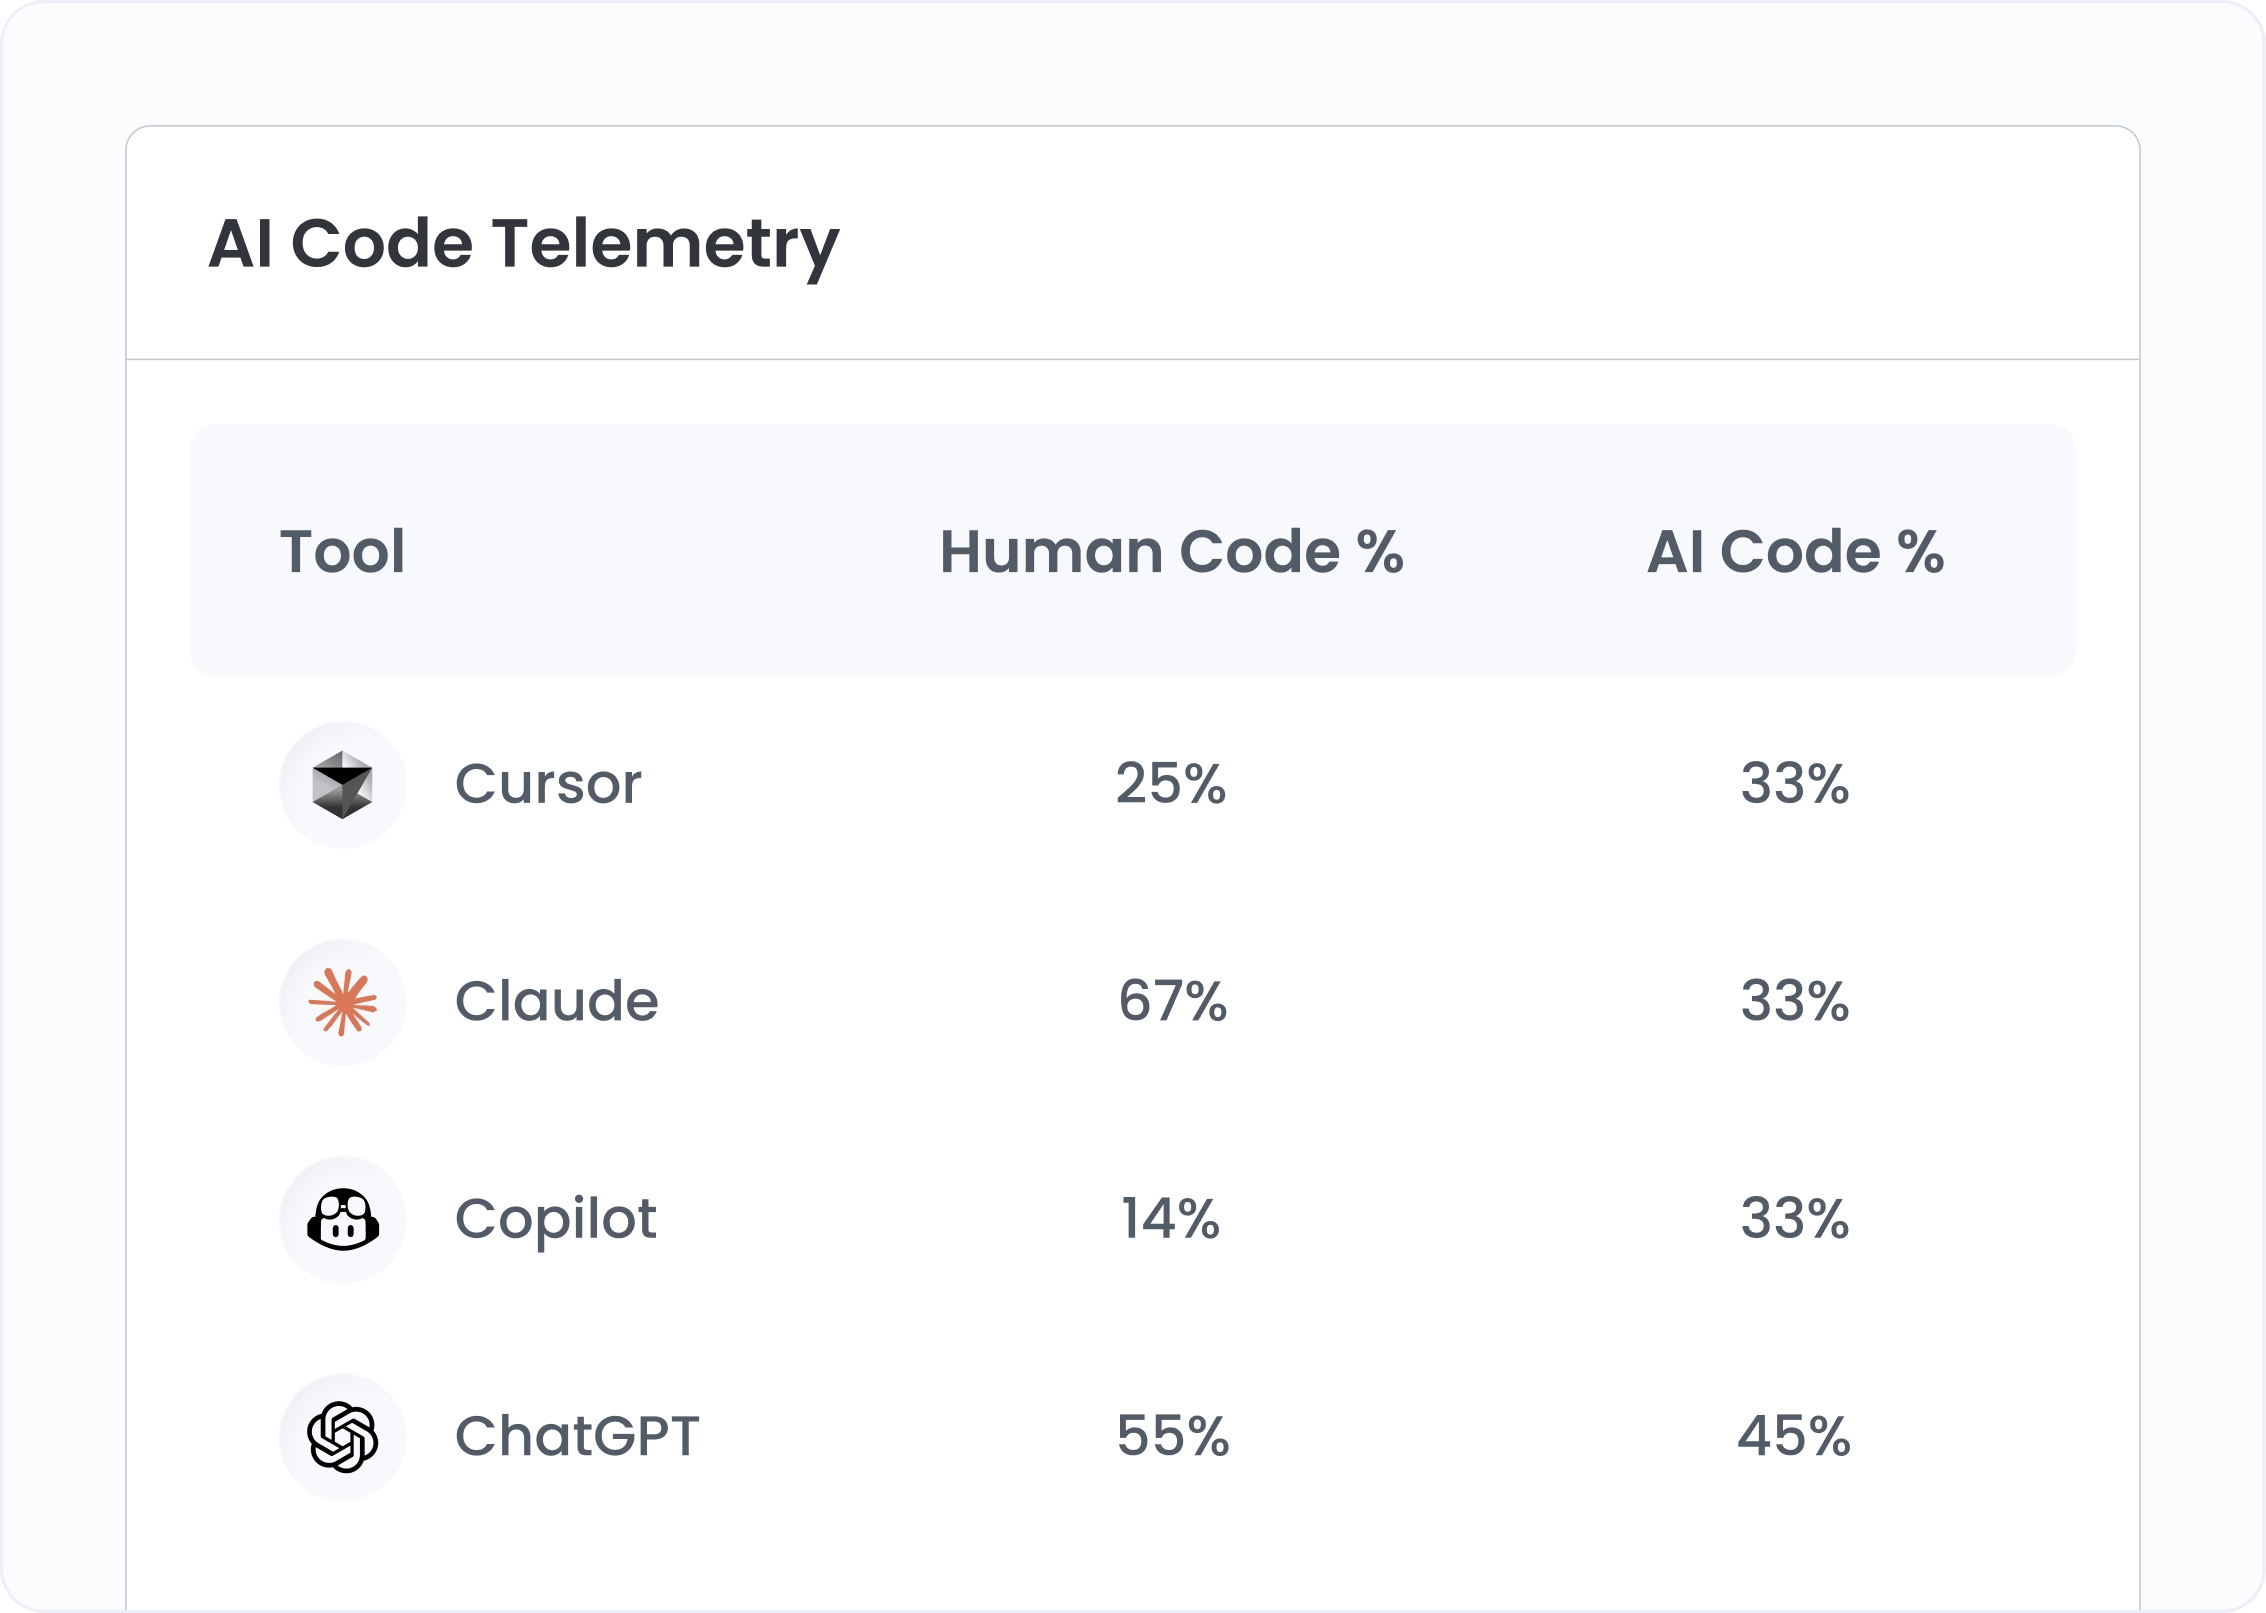
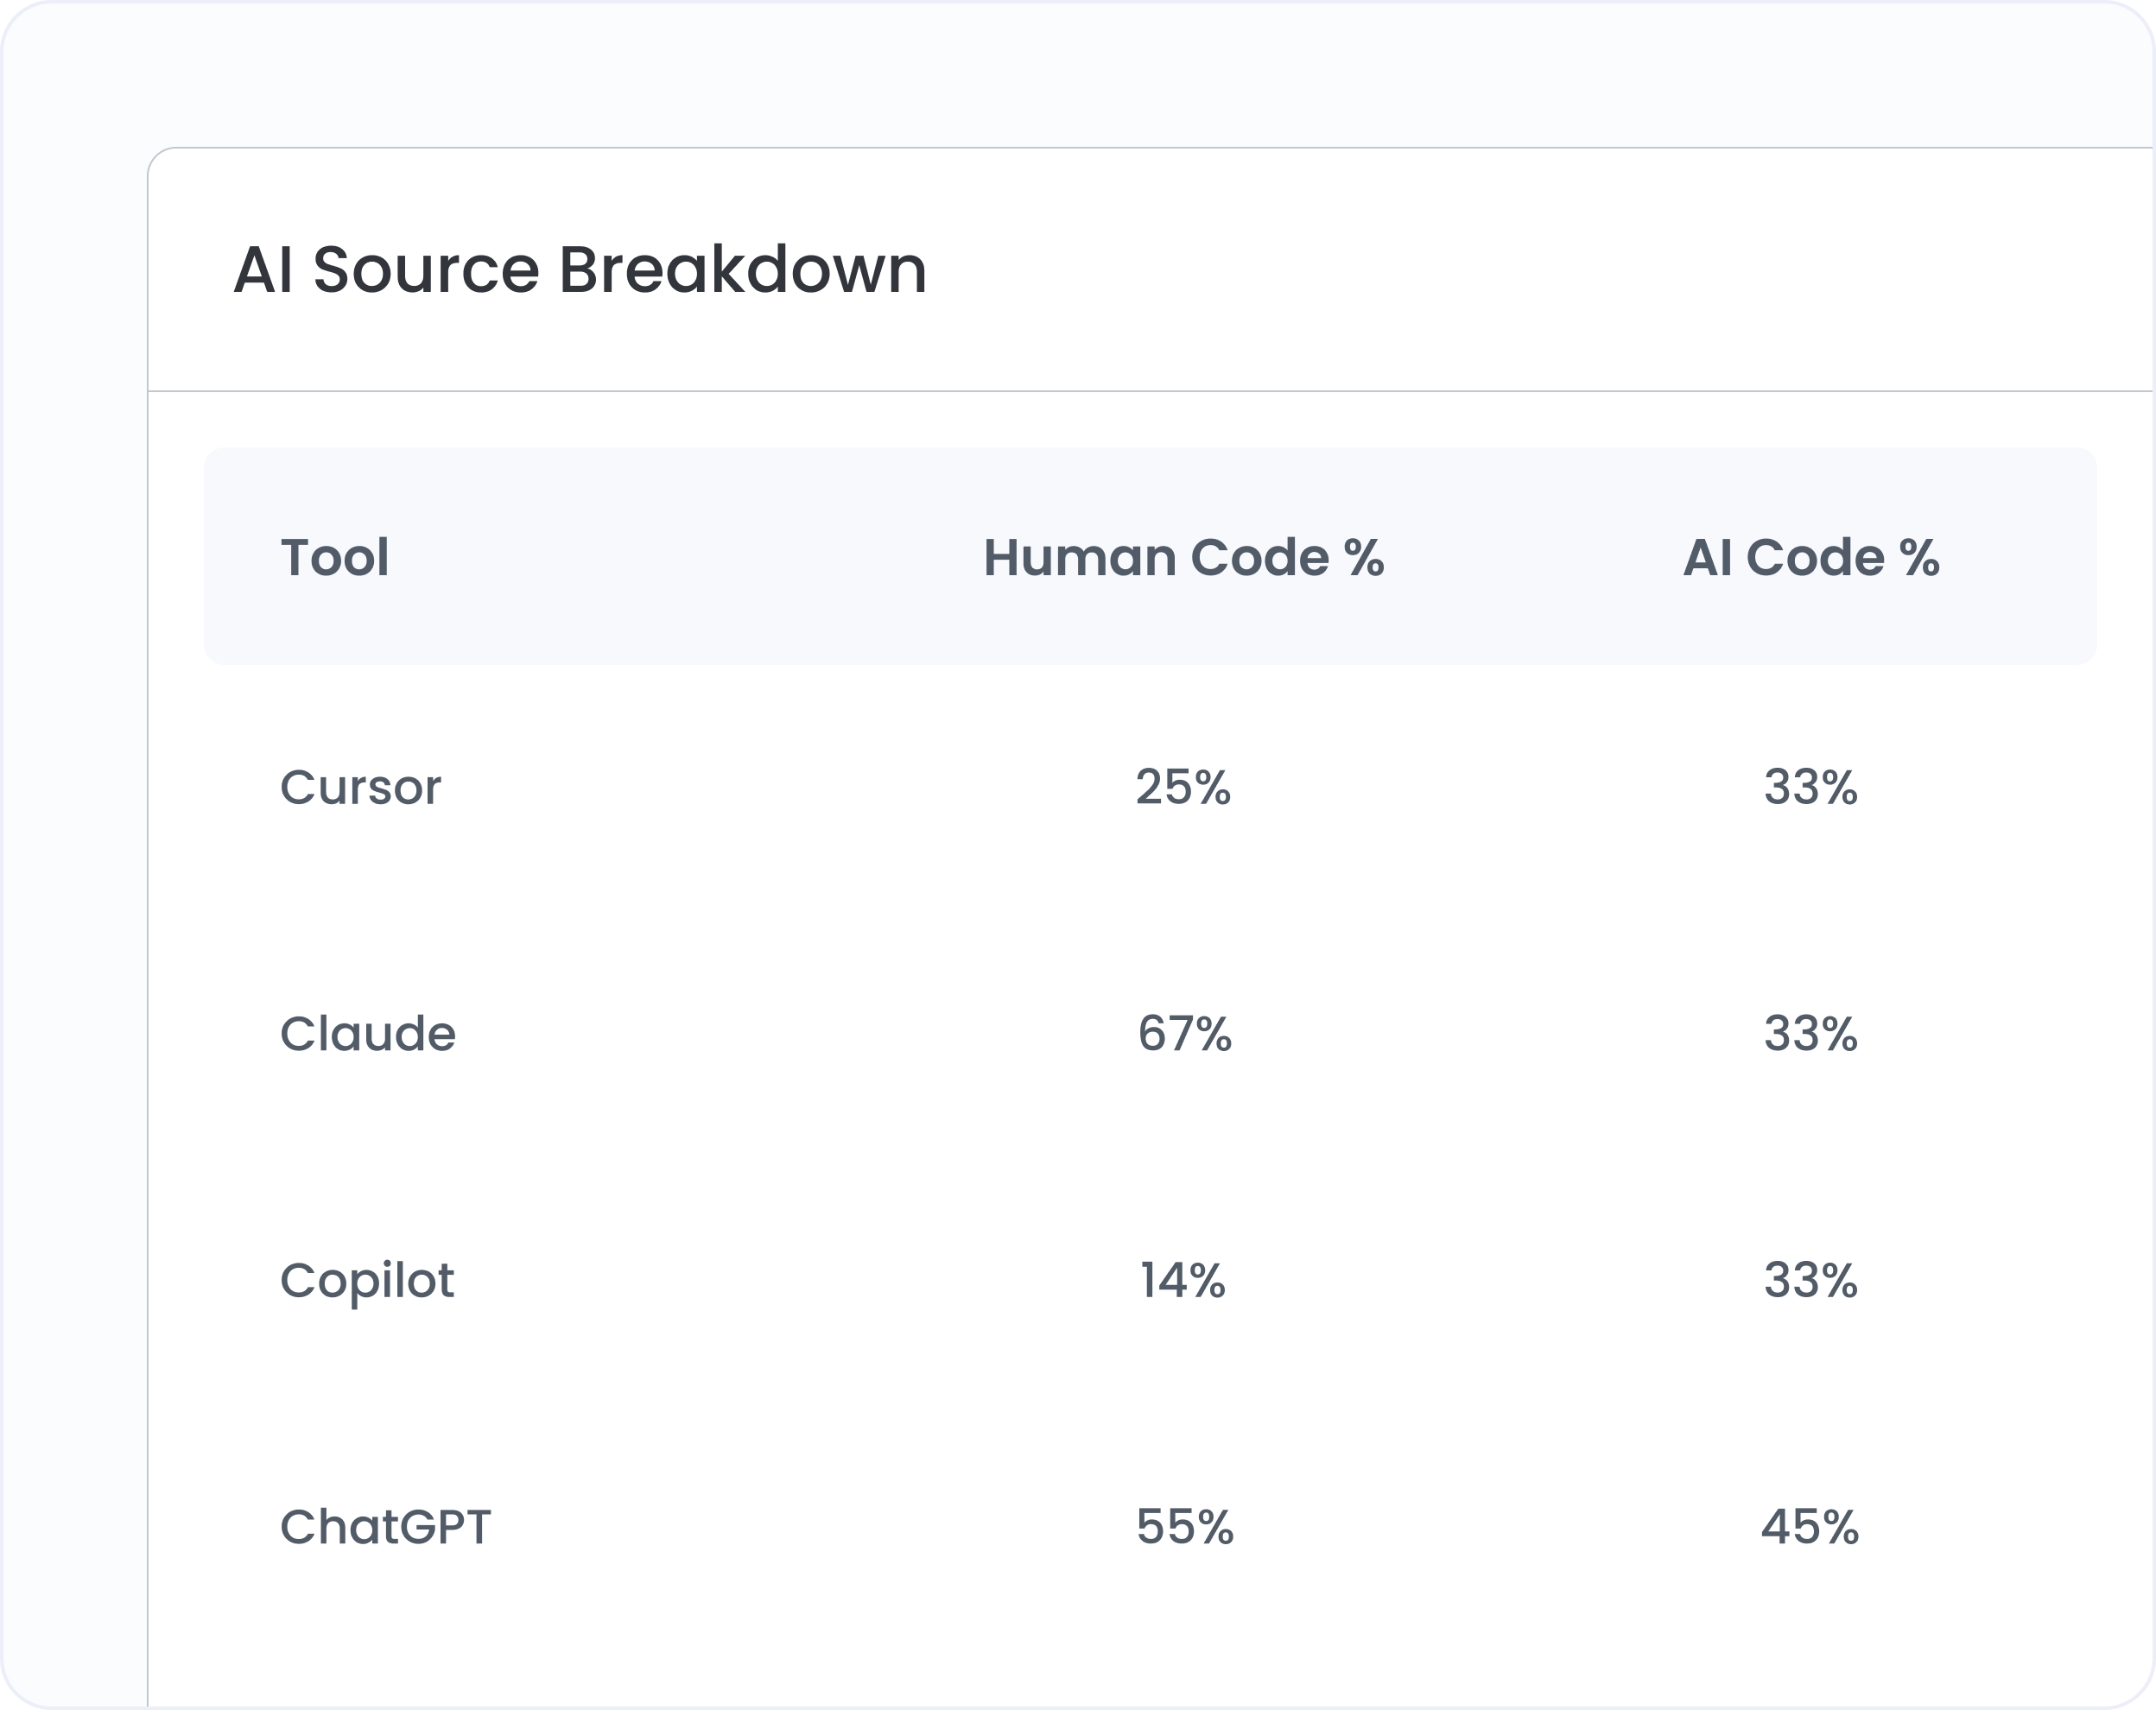
ACT tracks AI-generated code from merged PRs, not IDE acceptance. It captures contributions from Copilot, Cursor, Claude, ChatGPT, Gemini, and any pasted code, so adoption reflects what shipped, not what was clicked.

Catch AI code from chat tools, plugins, and pastes

Code pasted from ChatGPT or Claude rarely shows up in vendor adoption reports. ACT identifies AI-pasted code regardless of source. The complete picture, including the tools you didn't even know your teams were using.

Tie AI usage to speed, quality, and throughput

Connect merged AI code to cycle time, deployment frequency, and rework. See where AI accelerates delivery and where the rework load slows it. Surface power-user patterns to coach the rest of the org.

Quantify delivered value, not activity volume

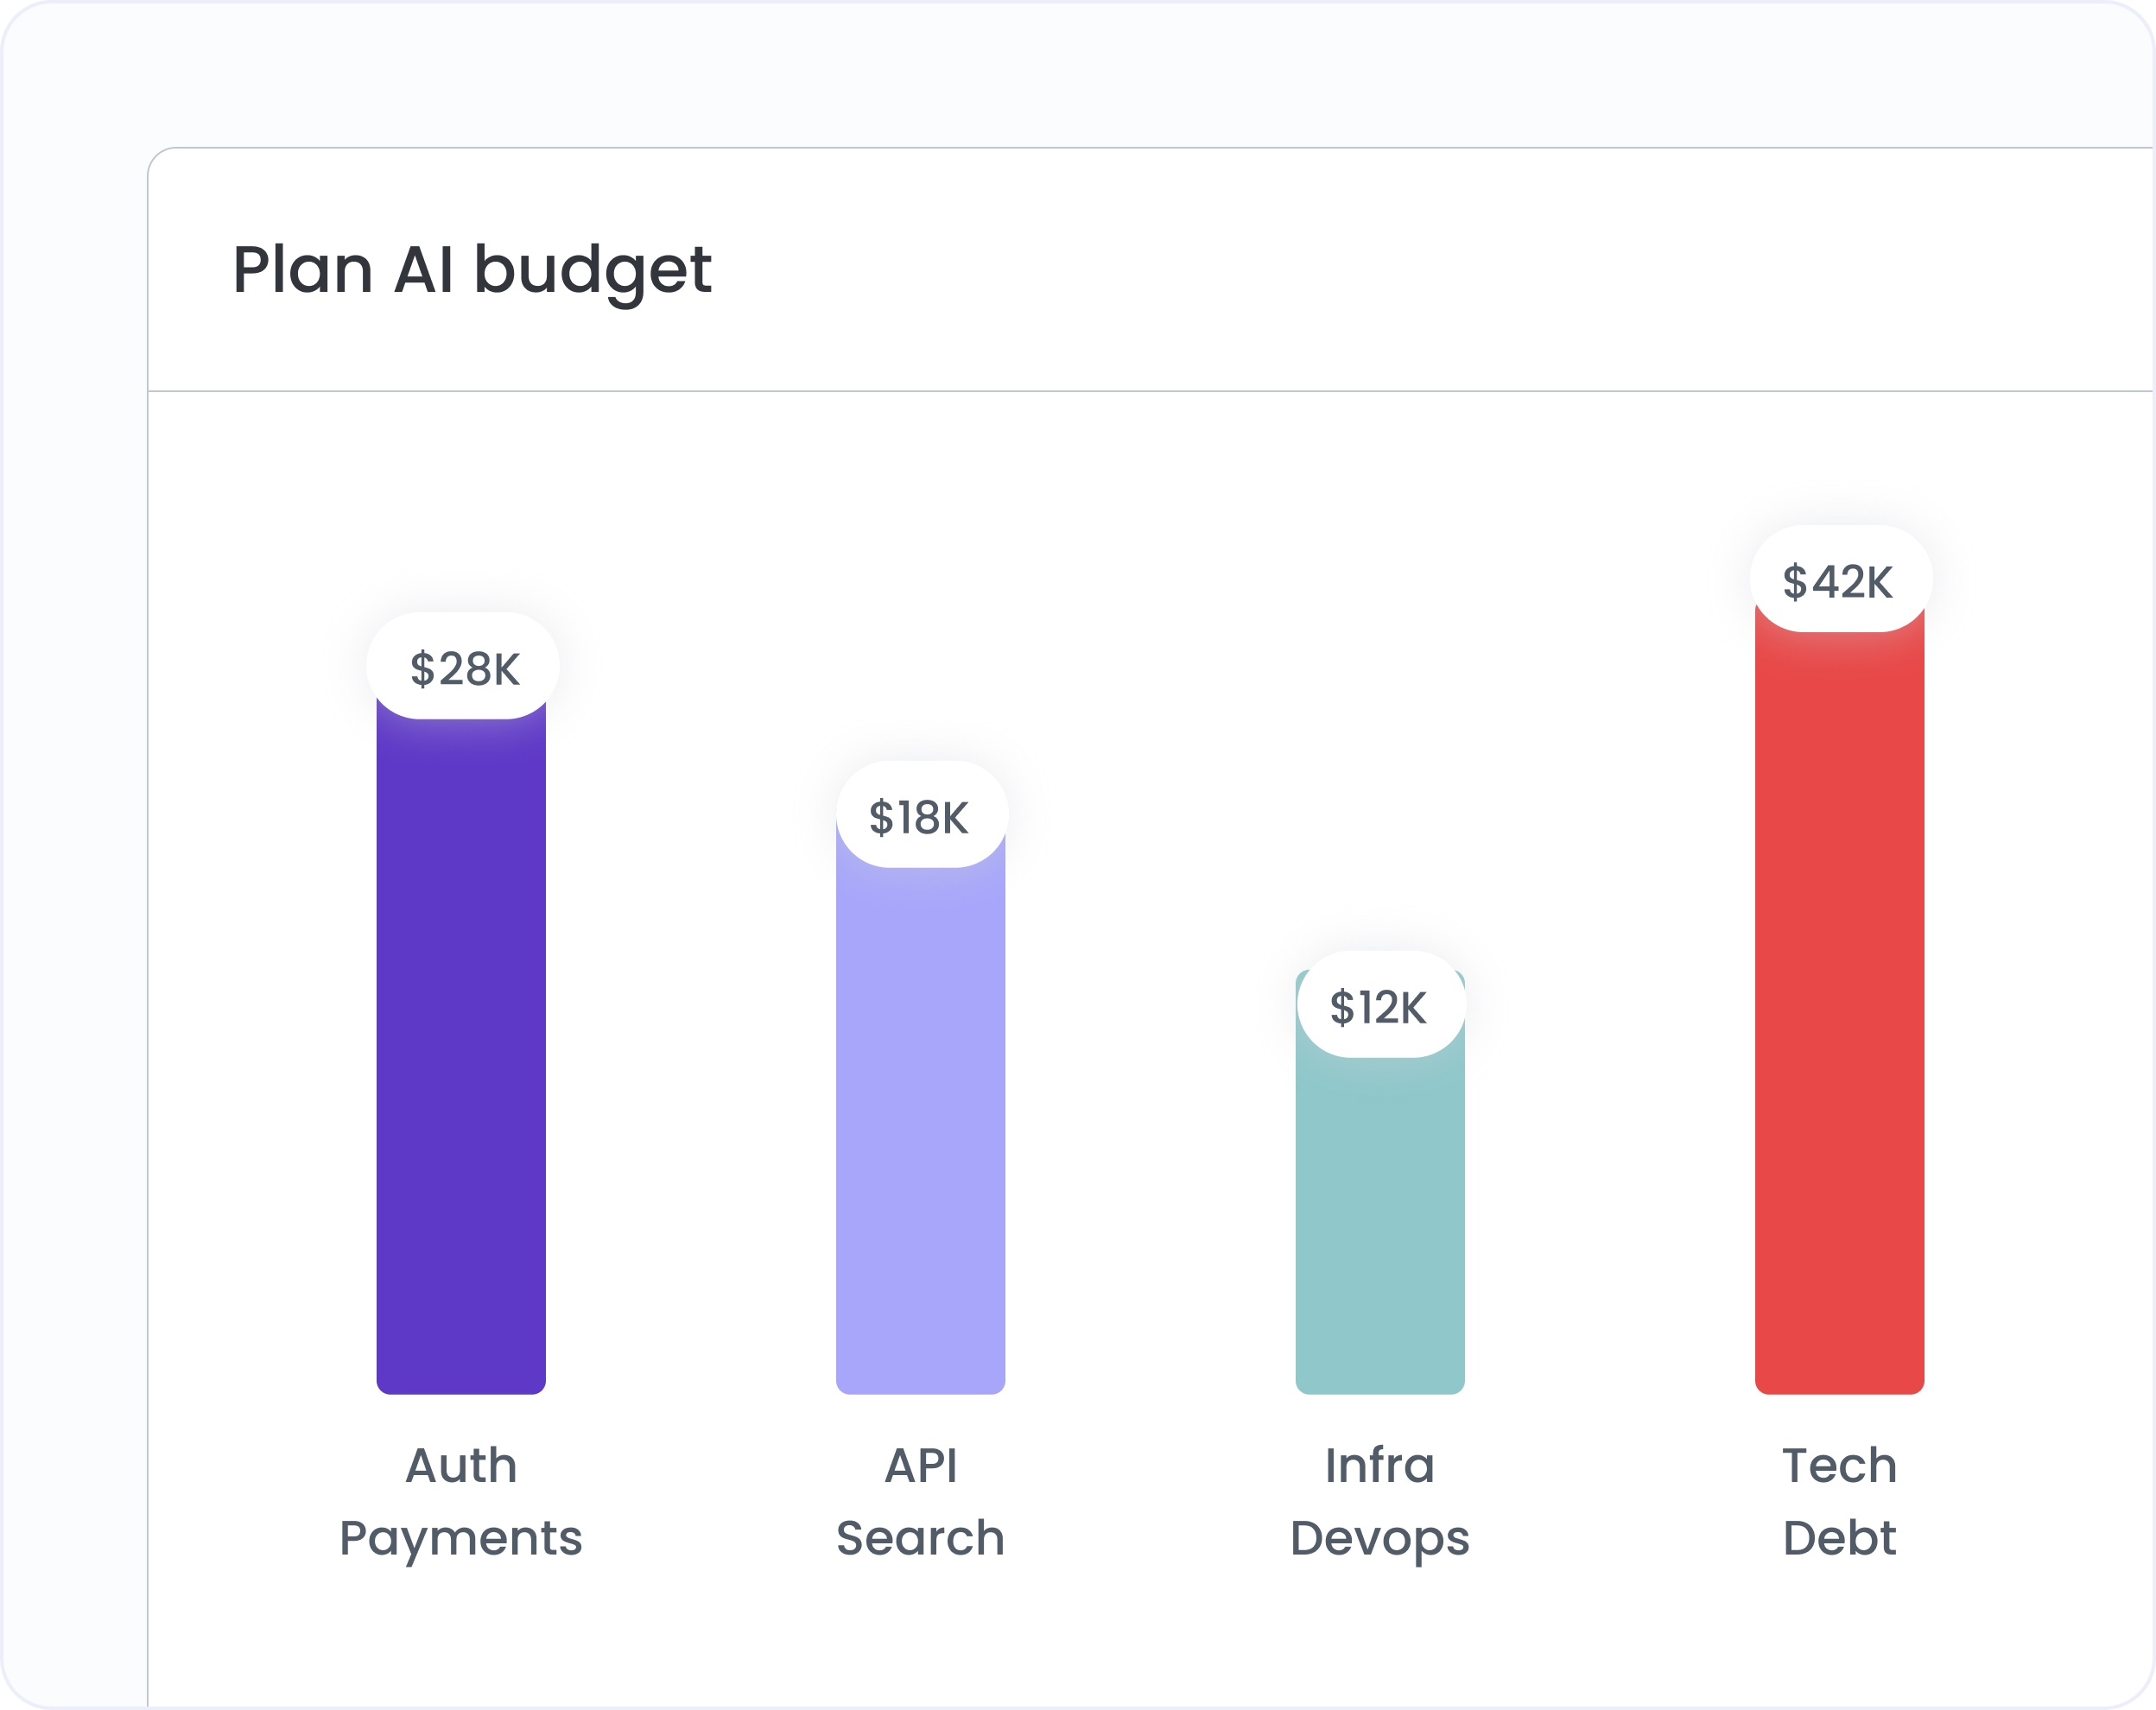
ACT translates merged AI code into dollar value: cost reduced, velocity gained, productivity lifted. Plan AI budget on outcomes your finance team can audit, not on adoption counters that don't survive scrutiny.

AI changed how code is written. It's time to change how you measure it.

Get your report now

10 minutes to connect your tools, 48 hrs until you have a board-ready benchmark

Sample report: ROI of AI · Date range: Q2 ’26, compared with Q1 ’26

Know it. Prove it. Improve it.

Sample insights for engineering leaders to expect from Hivel to measure the ROI of AI, built on Hivel’s SURGE framework.

Figures are grounded in real, anonymized Hivel client data. Some values are illustrative, adjusted to present a clean sample of the reporting format.

Know it

See what you actually have

S · SpendU · Utilization

Prove it

Show the impact in outcomes

G · Gains

Improve it

Act on what you found

R · RecoveryE · Efficiency

Know it

Spend + Utilization · See what you actually have
Insight 01S · Spend

As adoption climbed from 22% to 71%, every new engineer made AI cheaper for the whole org. You’re paying 42% less per PR today than in January.

AI spend per merged PR

JanFebMarAprMayJun

Monthly active AI adoption

JanFebMarAprMayJun
How we got here
Insight 02U · Utilization

85 of 296 committing accounts are bots, duplicates, or vendors. Your per-engineer productivity is 40% higher than your dashboards show.

Committing accounts
296
minus 21 bots and agent identities
After removing bots
275
minus 51 second and third accounts of people already counted
After merging duplicates
224
minus 13 external vendors and unidentifiable outsiders
Real engineers
211 engineers

No single tool can show you this. Git reports 296 committers, each AI tool reports its own license list, and your project tracker reports something else again. Every siloed view is inflated by bots, duplicate accounts, and vendors, and none of them agree. Only entity resolution across all the tools produces the real number: 211 engineers, growth of 27% rather than the 53% raw accounts suggest.

How we got here
Insight 03U · Utilization

Daily habit engineers ship in 3.4 days with 31 PRs. Dormant engineers take 6.2 days and ship half the work items.

Cohort · Q2 ’26, 63 working daysEngineersCycle timePRs / engWork items / engRework %
Daily habitAI-active 41+ of 63 days1123.4d31427%
Occasional11 to 40 days564.1d20329%
Rarely used1 to 10 days375.6d13218%
Dormantnever opened66.2d10218%
Better than org averageWorse than org average
How we got here
Insight 04U · Utilization

Your top 10% of engineers ship 46% of all production code. The bottom 50% contribute just 9%.

Top 10% of engineers
45.9%
Next 10%
19.7%
Next 30%
25.3%
Bottom 50%
9.1%
How we got here
Insight 05U · Utilization

AI code in production grew 2.7x in 6 months while PRs merged grew 1.7x. AI adoption is picking up pace and driving more output every month.

AI lines keptPRs merged
JanFebMarAprMayJun
Q1 ’26Q2 ’26 · REPORT BASIS

Participation widened too. Engineers active in AI in a given month rose from 137 in Jan ’26 to about 168 in Jun ’26, spread across teams. Q2 ’26 ends at its peak, so Q3 ’26 starts from a higher base.

How we got here

Prove it

Gains · Show the impact in outcomes, not activity
Insight 06G · Gains

The journey of AI code from generation to production

For every 100 lines of AI code generated, only 39 make it to production. 61% is filtered out across acceptance, review, and post-merge reverts.

AI code generated
100%
38% not accepted by the engineer
Accepted by engineer
62%
7% dropped before commit
Committed
55%
9% removed or rewritten in code review
Survived code review
46%
1% in PRs that never merged
Merged to main
45%
6% reworked or reverted after incidents
In production after 30 days
39%

The funnel widens as teams learn. The acceptance step shown above rose from 51% in Q1 ’26 to 62% in Q2 ’26, and survival to 30 days in production rose from 31% to 39% over the same two quarters.

How we got here
Insight 07G · Gains

6 of 7 teams landed more merges per month in their heavier-AI months. AI adoption is translating into real output gains across most of the org.

Lighter-AI months · in Q2 ’26Heavier-AI months · in Q2 ’26

Merges landed per month · each line is one team

Higher cadence in heavier-AI monthsFlat or lower
How we got here
Insight 08G · Gains

Q2 ’26 vs Q1 ’26: cycle time down 17%, merges needing a hotfix down 40%, real feature work up 45%.

FASTER
-17%

Cycle time, commit to production

Q1 ’26
4.8d
Q2 ’26
4.0d
BETTER
-40%

Merges needing a hotfix

Q1 ’26
20
Q2 ’26
12
MORE
+45%

Real feature work, bot traffic stripped

Q1 ’26
100
Q2 ’26
145

Report real work, not raw traffic. Most of the raw doubling was the release process shuffling code between branches on its own. Strip it out and feature work still grew 45% quarter on quarter, built by a team that grew 27%.

How we got here
Insight 09G · Gains

AI-assisted code isn’t just faster to write, it performs better across all 4 quality metrics: less rework, less refactor churn, fewer hotfixes, and faster recovery.

AI-assisted PRsNon-AI PRsEach pair is scaled to its own maximum: read within a measure, not across them
6.8%
7.4%

Rework
30-day churn

4.1%
4.4%

Refactor
30+ day churn

0.2%
0.3%

Hotfix rate

3.1h
3.4h

MTTR

One thing to take away: on all four quality measures, AI-assisted code is at least as good as the rest. The speed gains in Insight 08 did not come out of quality.

How we got here
Insight 10G · Gains

Your AI tools returned $374K in value against $120K in spend. For every dollar invested in AI, you got 3.1x back.

+$310K

Throughput gain

+$40K

Rework avoided

+$24K

Recovered licenses

$374K

Total value

$120K

AI spend

3.1xROI in Q2 ’26

Directional, not final: the $24K recovered-license line is modeled from Insight 11 and still needs finance confirmation, and no renewal or seat-reduction saving is booked yet. Read the rollup as directional until the cost-recovery data lands.

How we got here

Improve it

Recovery + Efficiency · Act on what you found
Insight 11R · Recovery

48 of 239 licenses, 20% of the estate, were used on ten days or fewer across Q2 ’26.

7

Dormant
never opened

41

Rarely used
1-10 days

62

Occasional
11-40 days

129

Daily habit
41+ of 63 days

The clearest cost lever in the report. Redeploy the 48 dormant and rarely-used licenses before renewal, and reclaim the duplicates: 28 engineers hold two or more paid AI licenses and use one.

How we got here
Insight 12E · Efficiency

Coding time fell 54% quarter over quarter, but review is now the longest stage in your cycle. The win in coding speed is being absorbed by a growing review bottleneck.

CodingWaiting for reviewIn reviewDeploy
Q1 ’26
2.4d
0.9d
1.1d
4.8d
Q2 ’26
1.1d
1.0d
1.5d
4.0d

The bottleneck moved. Review time grew 36% while coding time fell 54%. The next unlock is review capacity, not more AI seats. Insights 13 to 16 are what is happening inside that review stage.

How we got here
Insight 13E · Efficiency

45.3% of Jun ’26 merges were not reviewed by anyone, worse than May ’26 (41.1%).

54.7% reviewed by a person
22.1% agent only
23.2% not reviewed
Jun ’26: 1,817 merges, split by who reviewed them= 45.3% not reviewed by a person

The trap: agent comments count as reviewed in raw dashboard numbers, so review coverage looks fine while people stop reading the code. Insight 16 shows why: capacity, not engagement.

How we got here
Insight 14E · Efficiency

The bigger the change, the less likely it gets reviewed by a human. Your largest PRs are 2.2x more likely to skip review than small ones.

Smaller PRsunder 110 lines
82.1% reviewed
17.9% not reviewed
Bigger PRsabove 110 lines
60.1% reviewed
39.9% not reviewed

Attention is inversely proportional to risk. The 22-point gap is a 2.2x difference in unreviewed rate, concentrated on exactly the changes most likely to break something.

How we got here
Insight 15E · Efficiency

Your PRs are merging before the review agent even finishes. Code is hitting production unchecked.

MERGE
TODAY
PR opens
merged in 14 min
review, too late
THE FIX
PR opens
review, 104 sec
merge waits

One decision: run the reviewer the moment a PR opens and hold the merge until it finishes. It takes 104 seconds.

How we got here
Insight 16E · Efficiency

Review comments per merged PR fell from 1.3 to 0.9 between Q1 ’26 and Q2 ’26.

1.3

Q1 ’26

0.9

Q2 ’26

Human review comments per merged PR, same unit in both quarters

A capacity gap, not an engagement problem. Merged PRs grew 41%, but total human review comments stayed roughly flat, down about 2%. That’s fixable by scheduling: explicit reviewer capacity per team, automated checks taking the routine changes so people concentrate on the risky ones.

How we got here
Insight 17E · Efficiency

High AI adoption doesn’t always guarantee speed: some teams have converted it into real gains, others haven’t.

Speed: cycle-time gain vs Q1 ’26 →
Low AI adoption, high speed High AI adoption, high speed Low AI adoption, low speed High AI adoption, low speed
Platform
Payments
Infra
Data
Web
Mobile

Top right: high AI adoption, high speedTop left: low AI adoption, high speedBottom right: high AI adoption, low speedBottom left: low AI adoption, low speed

AI adoption in Q2 ’26 (share of daily habit engineers) →Dot size = team headcount · amber = high adoption, flat results

Adoption isn’t the win condition: some teams turned heavy AI use into real speed gains, one adopted just as hard and gained nothing.

How we got here

Let us build yours

We’ll run similar measures on your org — idle licenses, review coverage, real ROI — for free. We just need read-only access to Git, your project management tracker, your AI tools, and your incident system. No engineering effort. Board-ready output.

Get yours at hivel.ai.

Copy-paste approval request for your VP Eng or CFO

Subject: Free AI engineering leverage report, read-only Git access

We spend [your annual AI tool spend] a year on AI coding tools, and today we cannot connect that spend to output. Hivel offers a free report that does: it maps AI tool usage to our Git, project management, and incident data and returns a board-ready view of adoption, waste, and impact in 14 days.

It needs read-only access and no engineering effort. The measures it covers are in the attached report. I would like approval to run it.

Report basis Q2 ’26 (Apr to Jun 2026), compared against Q1 ’26 only. Trends across the two quarters are shown monthly. Figures are grounded in real, anonymized Hivel client data; some values are illustrative, adjusted to present a clean sample of the reporting format.

Thank you! Check your email for confirmation.

Four tabs. Every angle on engineering effort.

Tool-agnostic detection

Catches AI code from any source: Copilot, Cursor, Claude, ChatGPT, Gemini, plus code pasted from chat or generated externally.

‍

Confidence scoring

Every AI classification carries a confidence score. Finance and engineering know the strength of the signal behind every reported number.

Power-user patterns

Identify developers extracting the most value from AI. Surface their patterns and languages so the rest of the org can replicate.

‍

Adoption baseline

A one-time ACT Adoption Report gives finance, engineering, and procurement a shared, defensible starting point for every renewal conversation.

‍

Testimonials

Our clients’ success is our best testament

No items found.
How Freshworks measured AI impact across 1,500 engineers in real time

The Challenge

No standard way to measure AI adoption across 1,500 engineers
Couldn't tell which AI tools were helping vs just running
Surveys were the only answer - slow, expensive, inaccurate
Read Case Study

Book a demo

We'll show you exactly how AI is impacting your speed and code quality.

4.7/5
50+
‍Increase in engineering throughput
45%
Reduction in rework and maintenance
50+
More features released in key business units
45%
‍Improvement in time-to-market
No items found.
How AvidXchange reduced cycle time by 56% across engineering

The Challenge

Engineering performance data was scattered across 5 disconnected systems and no "North Star" metric.
Manual tracking created report generation bottlenecks for leadership.
Lack of visibility into Cycle Time and overall AI adoption impact.
Read Case Study

Book a demo

We'll show you exactly how AI is impacting your speed and code quality.

4.7/5
40%
‍Boost in feature released
5 to 1
Reduction in rework and maintenance
26%
Reduction in hotfix rate
56%
‍Improvement in time-to-market

Frequently asked questions

How does ACT detect AI code from chat tools?

ACT analyzes merged PR diffs for signals that distinguish AI-generated code from human-written code. These signals are independent of IDE plugins, so code pasted from ChatGPT, Claude, or Gemini gets classified the same way as code from Copilot or Cursor.

Why does ACT report lower AI usage than my Copilot or Cursor dashboard?

Vendor dashboards count IDE-level acceptance. ACT counts code that survived review and merged. Code accepted but later rewritten, deleted, or rejected in review never reaches the ACT number. The result reflects what shipped, not what was clicked.

How does ACT calculate financial impact?

ACT combines merged AI code volume with your team's fully-loaded engineering cost to estimate value delivered. Assumptions are transparent and configurable, so finance and engineering can agree on the methodology before the number reaches a budget conversation.

Trusted by 1000+ Engineering Teams

Vaibhav Bansal
V.P. Engineering
"Hivel has been phenomenal in helping us present our progress to leadership. Its insights into leading indicators have empowered our team leads to enhance review efficiency and ship features faster. Now, we are able to show the impact of our process changes, clearly identify areas of opportunity, and bring in a data-driven culture without spending time pulling manual reports."
Murali Swaminathan
Chief Technology Officer
"We were looking for a unique solution to understand engineering productivity and efficiency, with a single tool that could give leaders complete visibility. We evaluated other comparable tools, but none were comprehensive enough. When we came across Hivel, it checked all the boxes for measuring developer productivity across both AI and non-AI workflows."
Derek Mackie
Director of Engineering
"Using Hivel shone a light on the non-standard aspects of our work, emphasizing the need for crucial adjustments. The insights from Hivel helped us recognize areas for improvement, particularly in managing cycle times and streamlining development workflows. This guidance has been instrumental in our efforts to enhance operational efficiency and productivity."
Leonardo Pinheiro Ferrari
Chief Technology Officer
"Thanks to Hivel, we've seen a staggering 157% improvement in our deployment frequency. By identifying and addressing inefficiencies, and adopting best practices, we've significantly accelerated our progress. Hivel has been instrumental in our journey to operational excellence."
Chris Callander
Senior Engineering Manager
"Hivel has been instrumental in identifying areas for enhancement and guiding our strategic improvements. It has significantly contributed to our journey toward greater operational efficiency. The Activity and Dev360 features in Hivel have been particularly valuable for providing feedback to engineers during 1-1's, enhancing our communication and development practices."
Shiro Theuri
Chief Technology Officer
"Before Hivel, understanding our engineering team's dynamics was a game of guesswork. Now, with Hivel's clear dashboards and insights, our leaders have the clarity and time-saving tools they need to excel. It's been transformative in streamlining our operations."
Koti Reddy
Chief Technology Officer
"Incorporating Hivel into our daily operations has been a game-changer. It's not just a tool; it's a part of our strategic decision-making process, trusted by our leaders at every level. The impact on our engineering efficiency is undeniable and deeply valued."
Manoj Awasthi
Chief Technology Officer
"It has been great to partner with Hivel to get access to insights that help leaders at all levels gain visibility into bottlenecks and challenges that the teams face, build actionable plan to resolve them and track the progress over time. And thanks for the fantastic support!"
Ameen M
Engineering Manager
"Hivel has made a huge difference to how I manage my teams. Before every one-on-one or appraisal, I rely on it to dive into developer metrics and drive truly meaningful conversations. It helps me spot rework patterns, reward high performers, and benchmark our teams even against our US counterparts. The dashboards are intuitive, insightful, and honestly far more actionable than anything we get from Jira."
Paras Sood
Associate Director
"Hivel's insights have been pivotal in refining our engineering processes, elevating both efficiency and the developer experience. We're now making smarter decisions, faster, thanks to Hivel."
Vaibhav Bansal
V.P. Engineering
"Hivel has been phenomenal in helping us present our progress to leadership. Its insights into leading indicators have empowered our team leads to enhance review efficiency and ship features faster. Now, we are able to show the impact of our process changes, clearly identify areas of opportunity, and bring in a data-driven culture without spending time pulling manual reports."
Murali Swaminathan
Chief Technology Officer
“We were looking for a unique solution to understand engineering productivity and efficiency, with a single tool that could give leaders complete visibility. We evaluated other comparable tools, but none were comprehensive enough. When we came across Hivel, it checked all the boxes for measuring developer productivity across both AI and non-AI workflows.”
Vaibhav Bansal
V.P. Engineering
"Hivel has been phenomenal in helping us present our progress to leadership. Its insights into leading indicators have empowered our team leads to enhance review efficiency and ship features faster. Now, we are able to show the impact of our process changes, clearly identify areas of opportunity, and bring in a data-driven culture without spending time pulling manual reports."
Derek Mackie
Director of Engineering
"Using Hivel shone a light on the non-standard aspects of our work, emphasizing the need for crucial adjustments. The insights from Hivel helped us recognize areas for improvement, particularly in managing cycle times and streamlining development workflows. This guidance has been instrumental in our efforts to enhance operational efficiency and productivity."
Leonardo Pinheiro Ferrari
Chief Technology Officer
"Thanks to Hivel, we've seen a staggering 157% improvement in our deployment frequency. By identifying and addressing inefficiencies, and adopting best practices, we've significantly accelerated our progress. Hivel has been instrumental in our journey to operational excellence."

"The only tool our entire leadership team actually trusts"

Explore Hivel