The SURGE FRAMEWORK

Spend. Utilization. Recovery. Gains. Now prove the AI ROI.

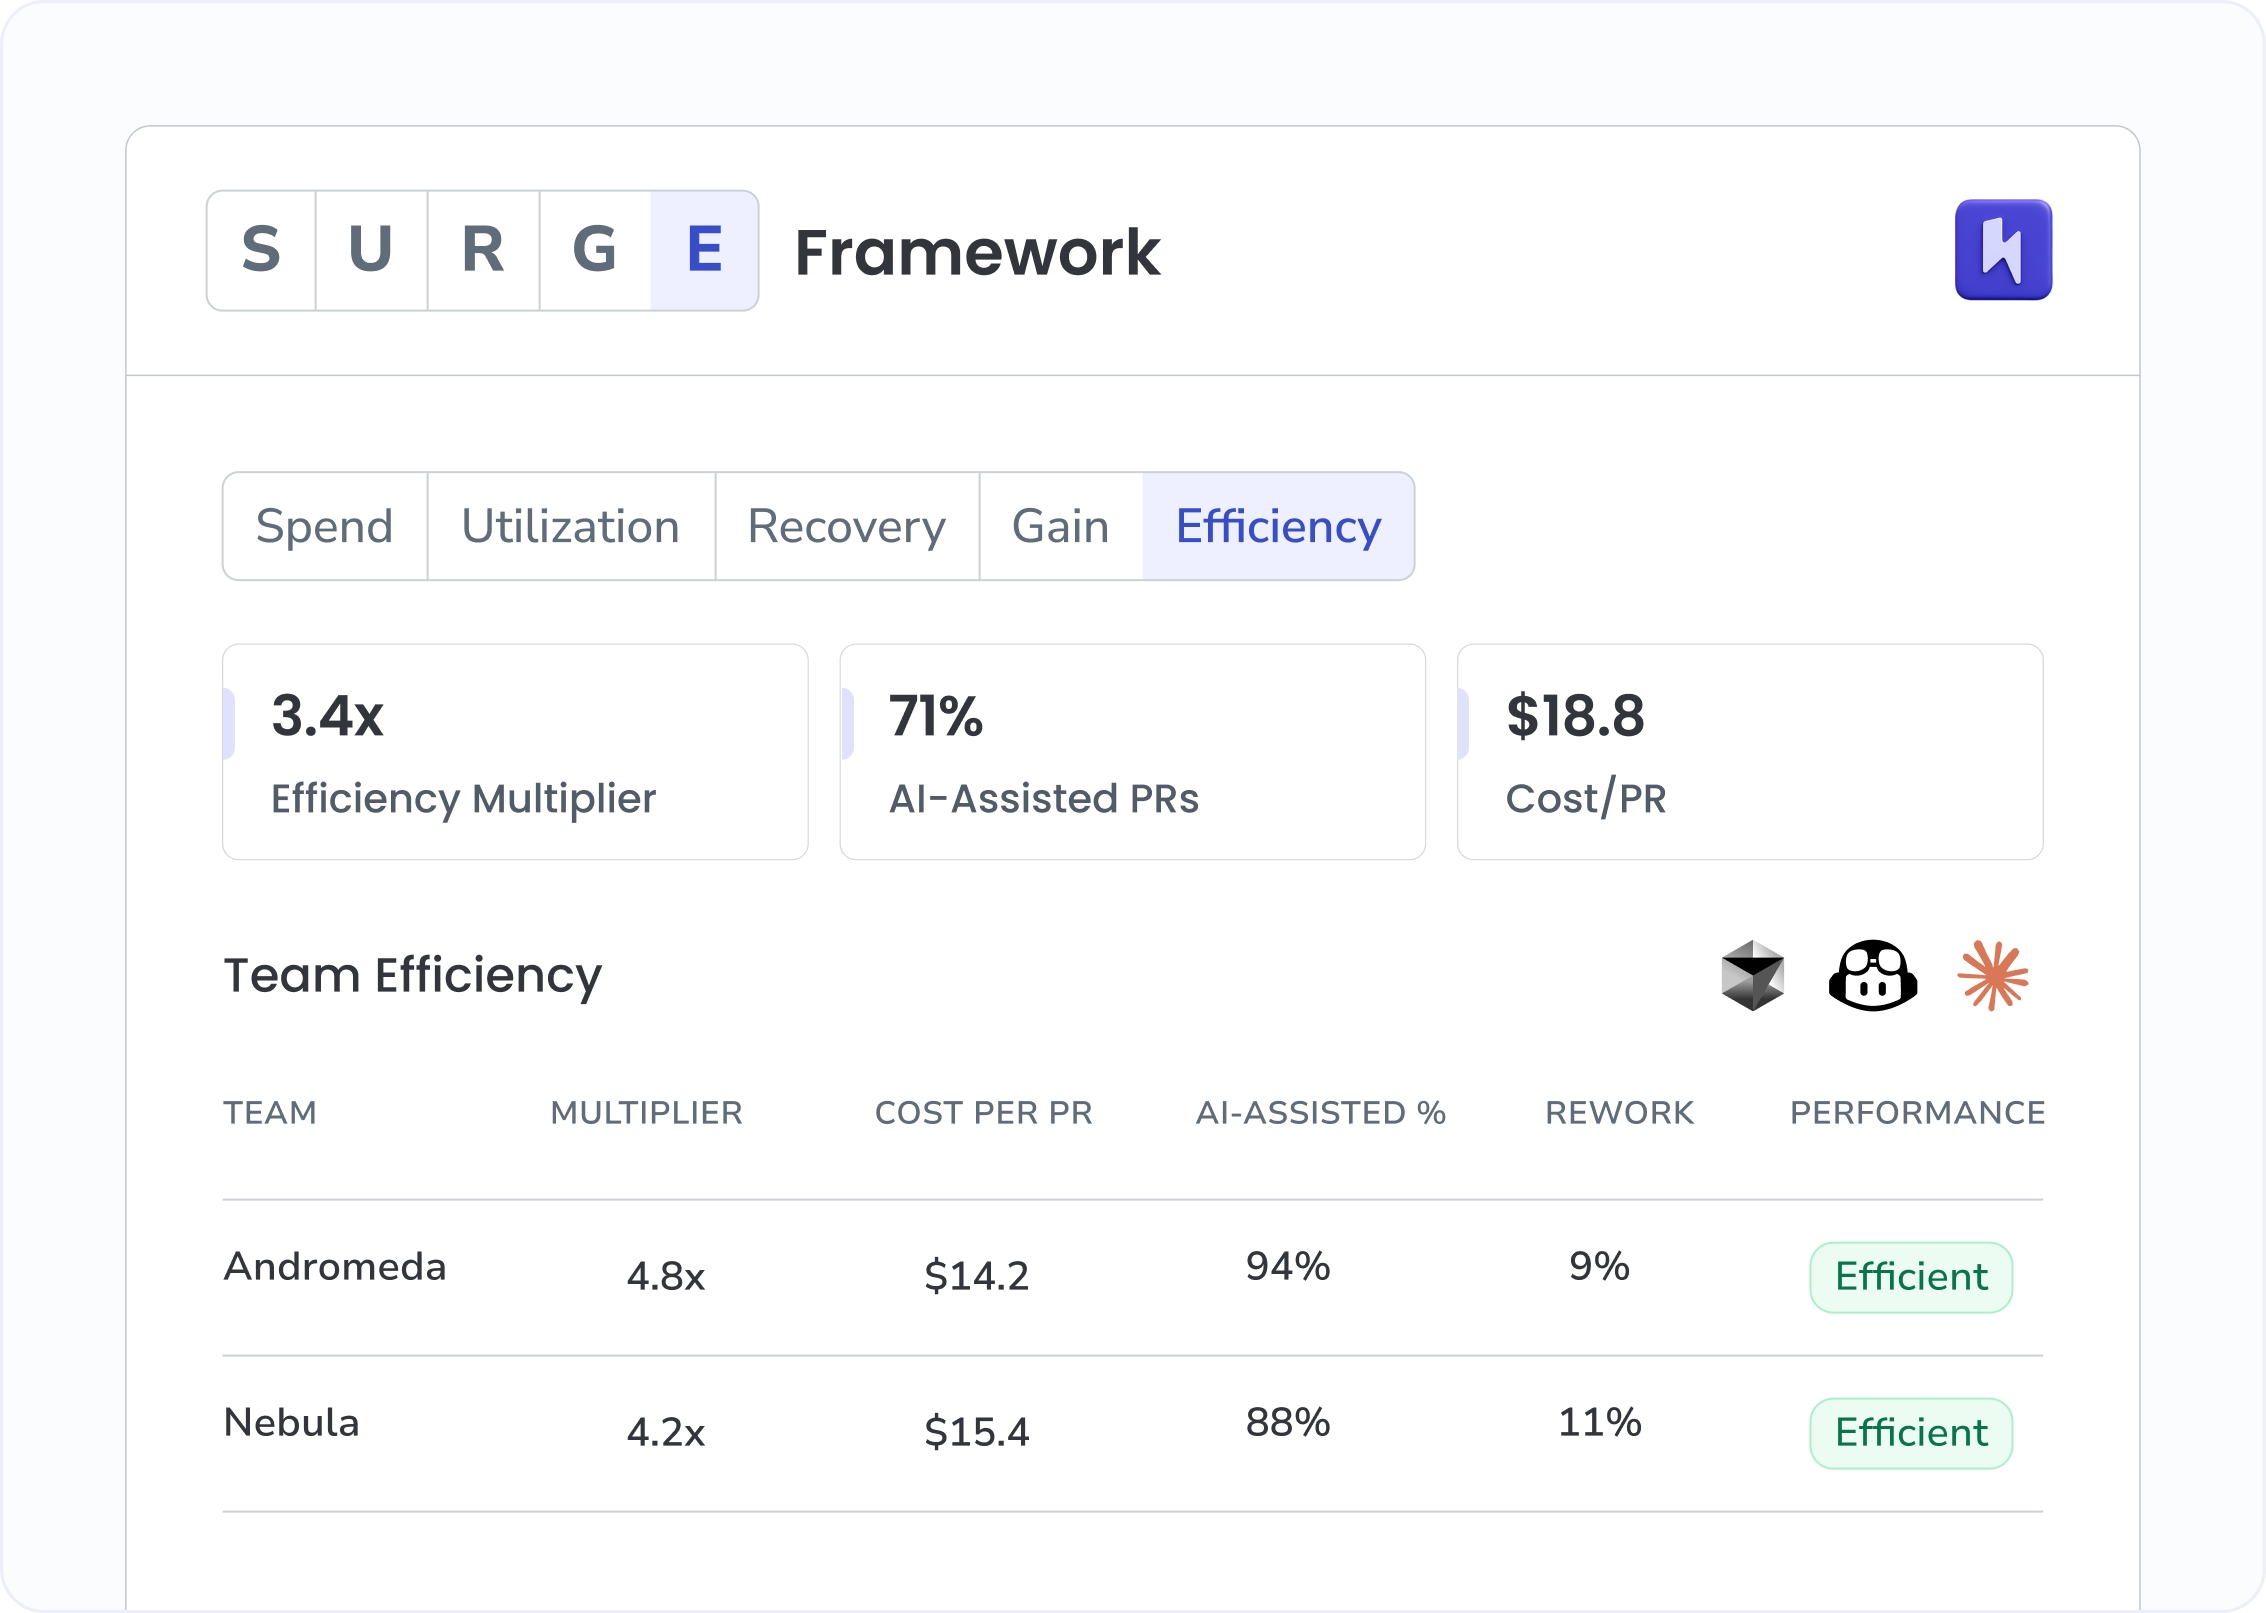
Efficiency is where SURGE delivers the bottom line. Efficiency Multiplier, Cost per PR, AI-Assisted PRs Merged, and Rework Rate, calibrated continuously. The board-grade AI ROI number every engineering investment conversation needs.

The problem

Every other AI dashboard ends at adoption. The ROI number lives one layer deeper.

A board doesn't ask whether AI was adopted. It asks whether engineering got faster, shipped more, and reworked less. The answer requires connecting AI spend to AI-assisted PRs, then both to throughput and rework over time. Without that chain, the AI ROI conversation defaults to estimates.

Adoption metrics don't equal ROI

License utilization at 74% looks good on a slide. Whether the team ships more, faster, or with fewer defects per AI dollar is a different question that requires different data.

High-spend teams aren't always high-output

Some teams burn AI budget without producing PRs. Others ship volume on minimal spend. The variance is invisible until you plot spend against output on the same axis.

Rework cancels AI productivity gains

A team ships 30% more PRs with AI but reworks 25% of them within two weeks. The net Efficiency gain is marginal. The board needs to see both numbers to evaluate the investment.

The questions Jira reports can't answer. Investment Profile can.

Efficiency multiplier

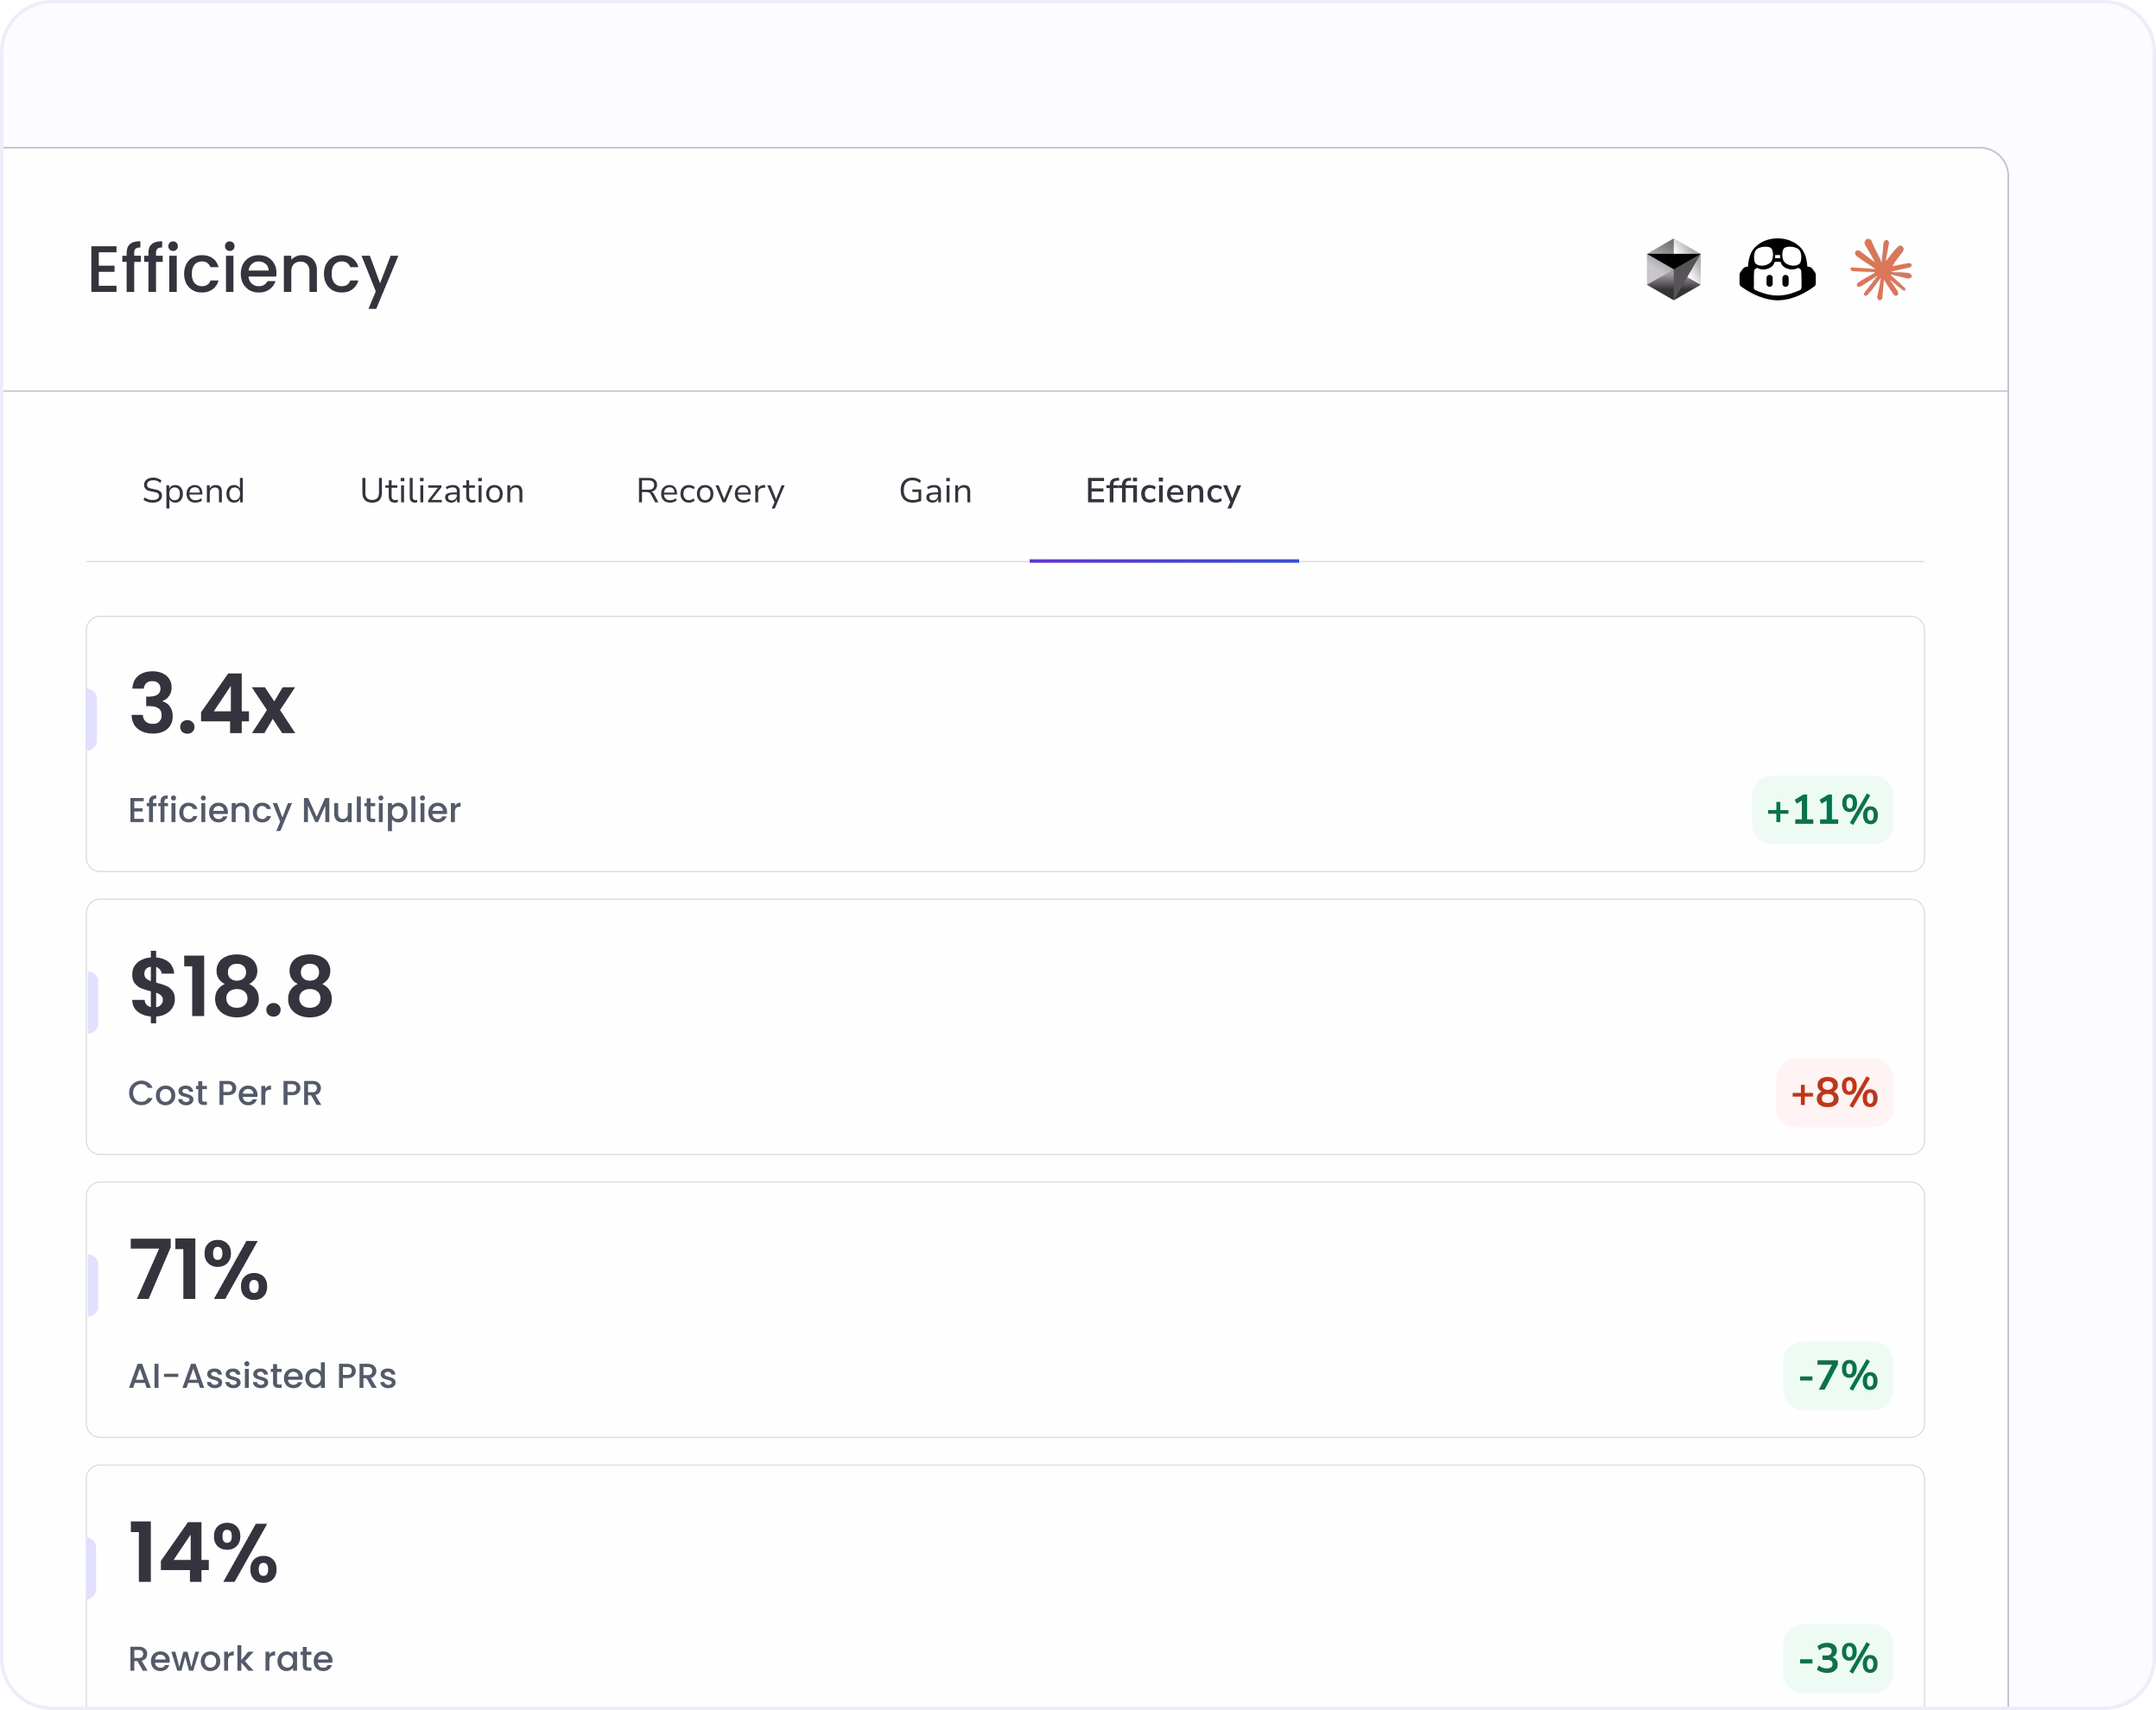
The single AI ROI number every board conversation needs

Calculated continuously from AI-assisted PRs merged, cost per PR, and rework rate. The headline number that answers whether AI investment is producing measurable engineering output, not just measurable activity.

Spend vs output quadrant

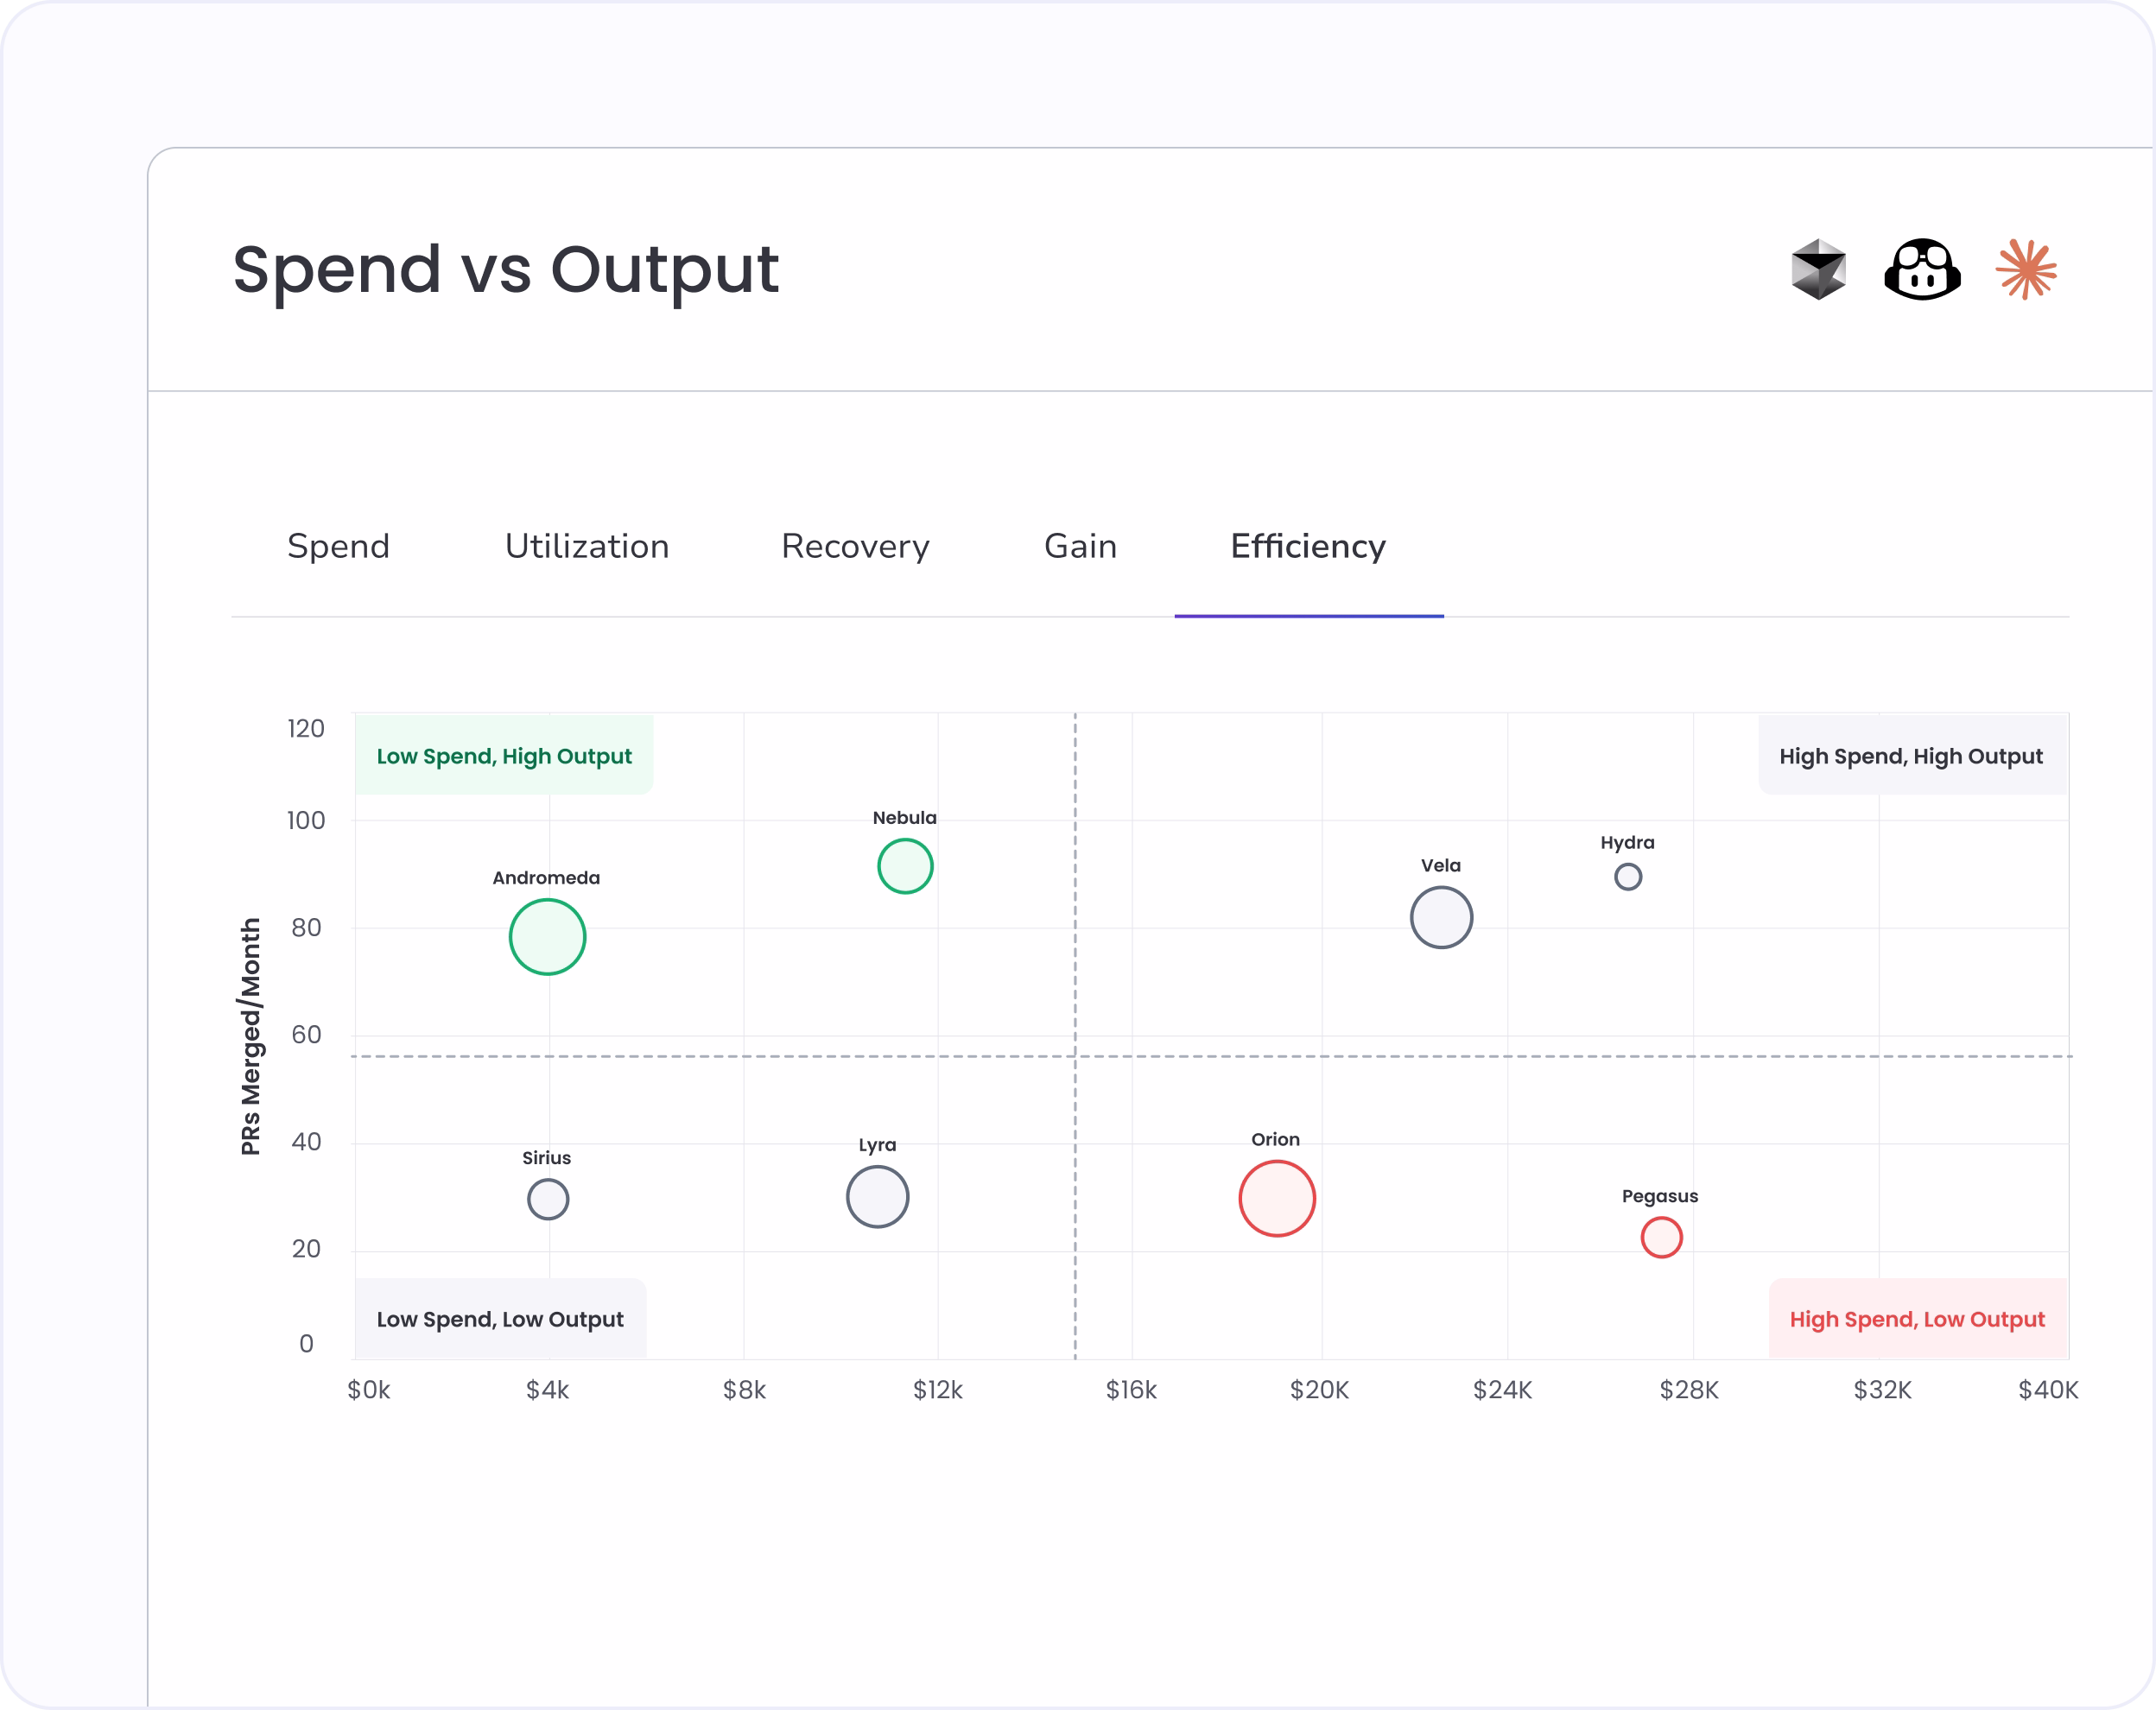
See which teams convert AI spend into shipped code, and which don't

The Hivel Quadrant plots every team by AI spend and PR output. Gain a unified dashboard that simultaneously guides software license reallocation, engineering training resources, and enterprise budget planning.

Team efficiency

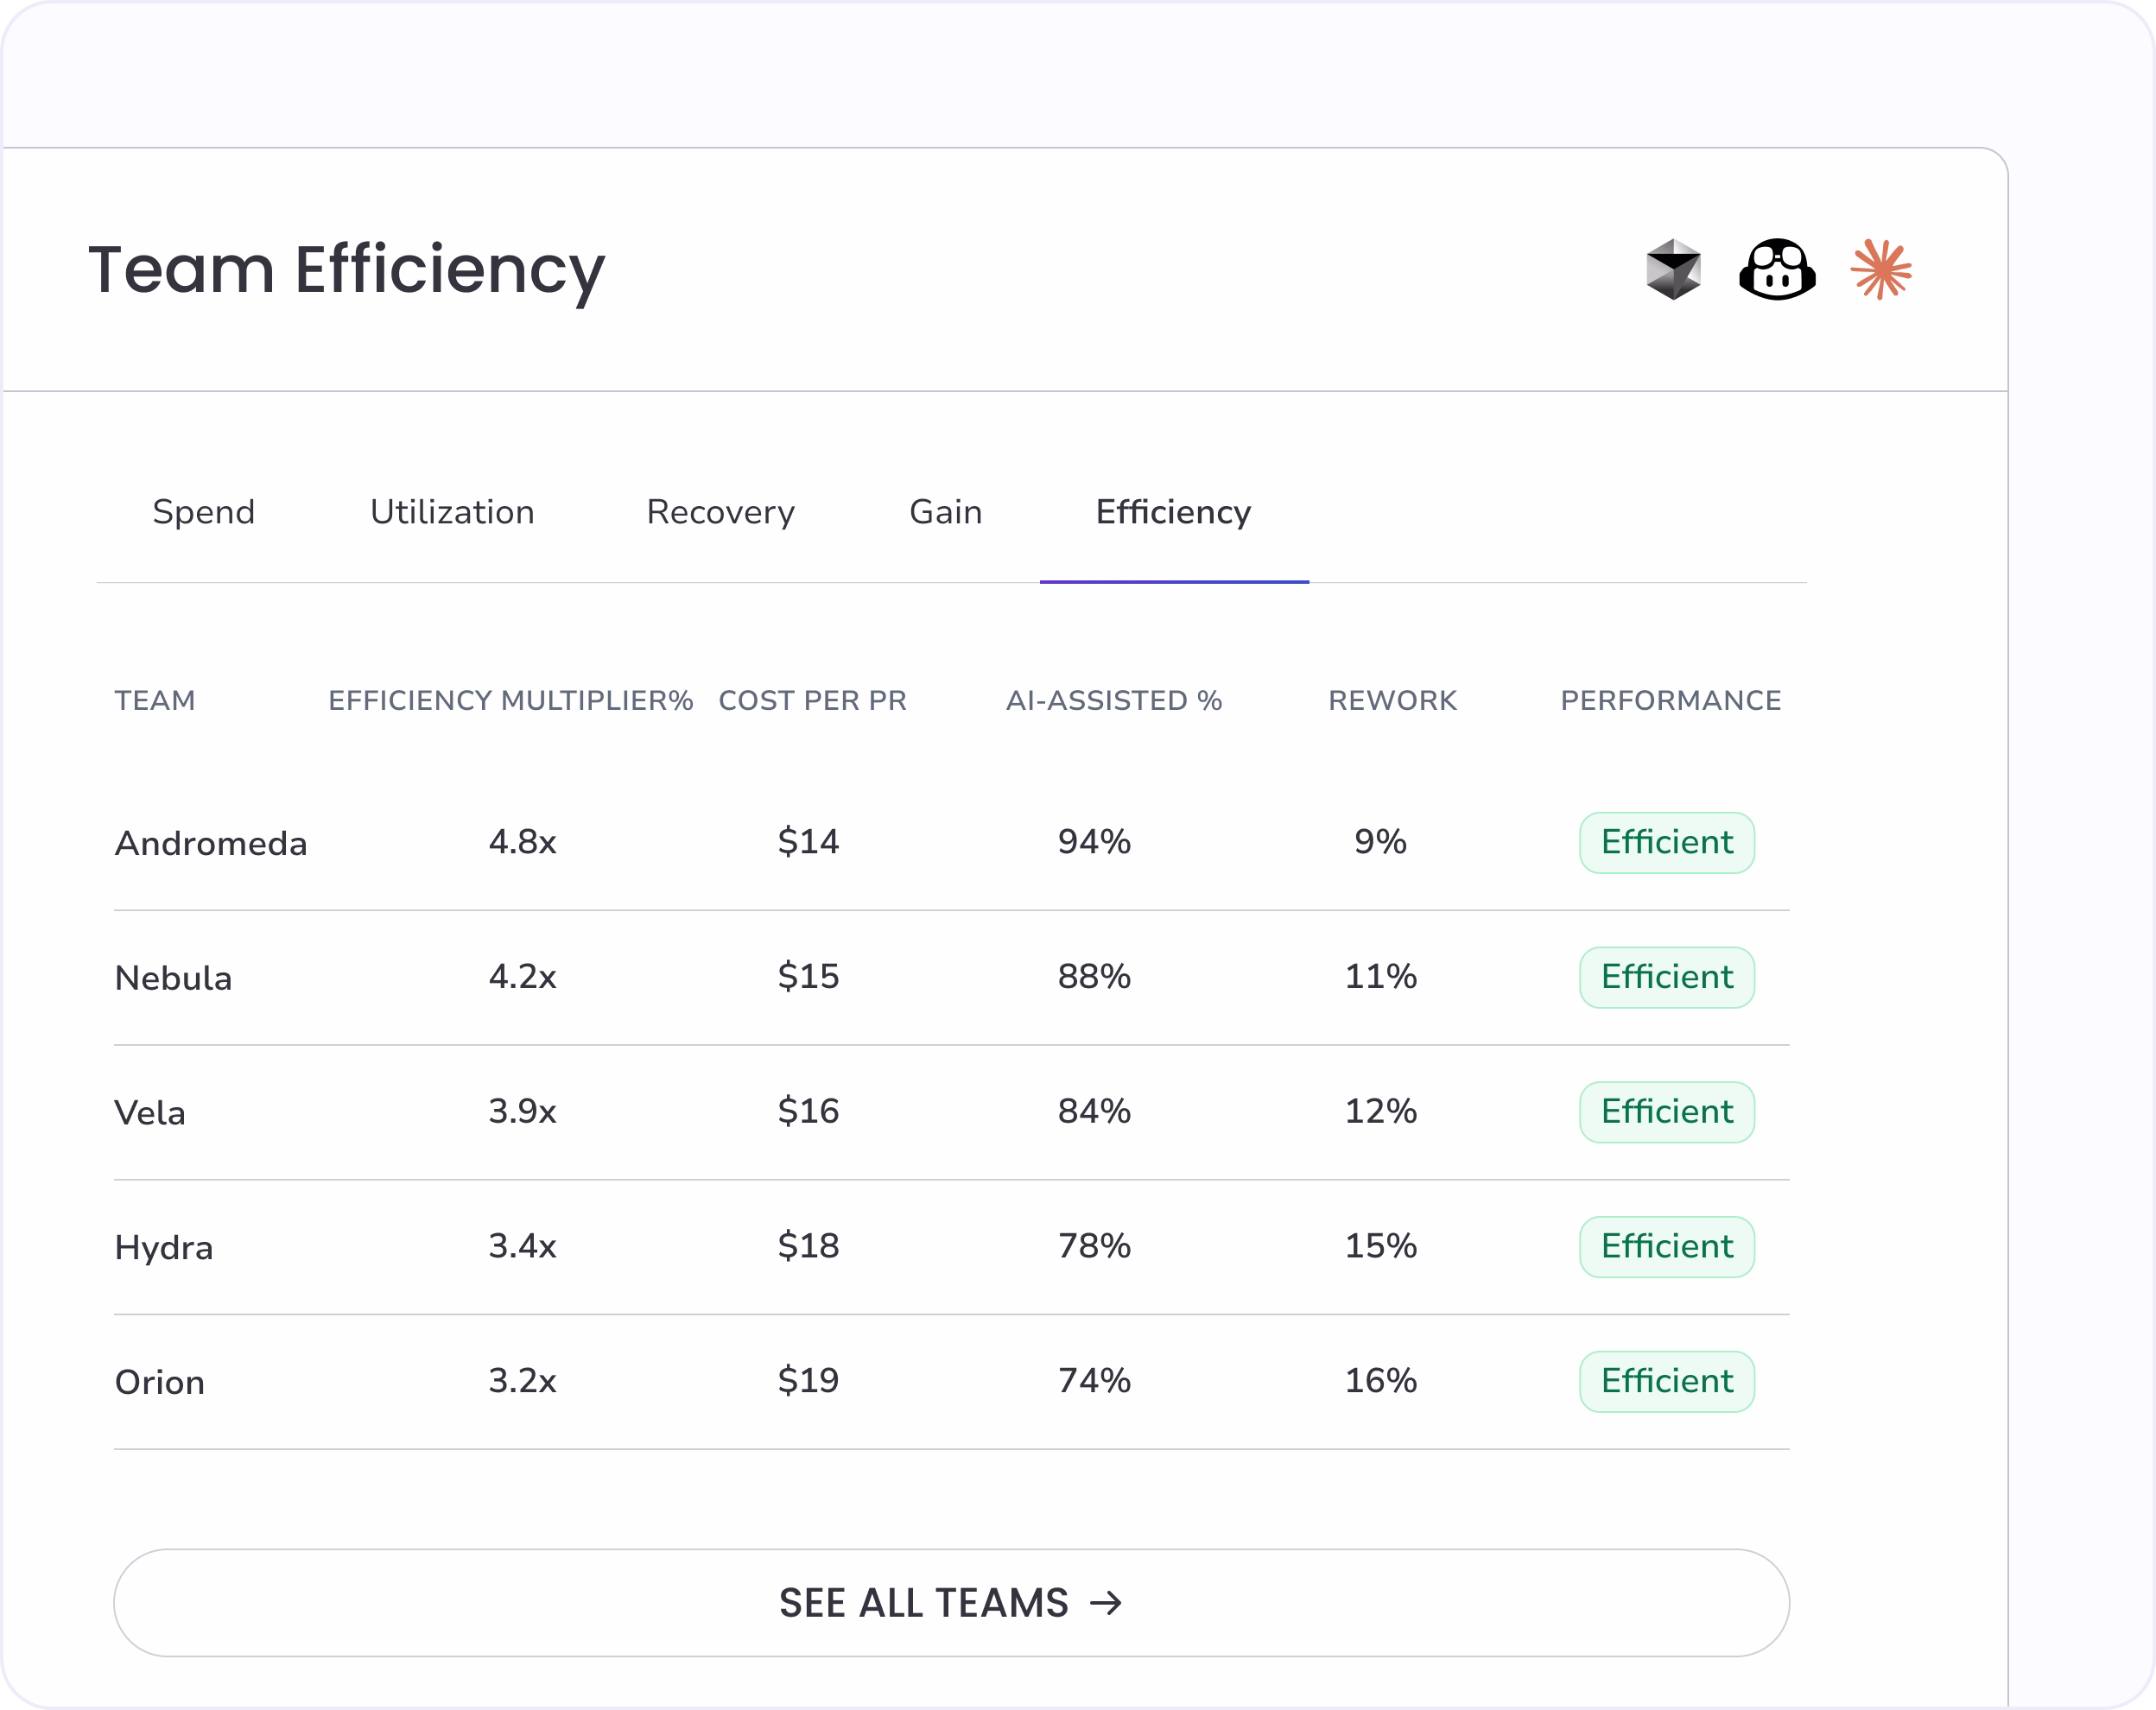
Surface the highest and lowest performing teams on AI ROI

The Team Efficiency table ranks teams by Efficiency Multiplier, Cost per PR, AI-Assisted percentage, and Rework Rate. Toggle between High and Low to see the top performers and the intervention list. Switch between team and developer views to drill into individual outliers.

SURGE rolled into Hivel Score

Efficiency feeds Hivel Score, Cockpit, Team Pulse, and Goals

SURGE Efficiency rolls into the Hivel Score for one calibrated number across Speed, Quality, and Throughput. Cockpit shows AI Impact per team. Team Pulse and Dev360 surface daily activity. Goals tracks quarter-over-quarter targets. The full SURGE chain, one engineering view.

The framework

Five pillars. One measurement model. Real engineering data.

SURGE measures the full value chain from AI investment to delivered outcome. Each pillar answers a question your current dashboards can't.

Efficiency Multiplier

A single configurable ROI metric combining AI-assisted PRs, cost per change, and rework rate. The headline AI value figure.

Hivel Quadrant

Spend vs output scatter plot with four quadrants. Identifies high-leverage teams, intervention candidates, and AI investment outliers visually.

Cost per Feature

Cost per shipped feature alongside Cost per PR. The unit economics view CFOs and product leaders ask for at every quarterly review.

Rework rate tracking

Surface where AI-assisted code is being rewritten within 30 days. The signal that distinguishes real Efficiency gains from inflated velocity.

Frequently asked questions

What goes into the Efficiency Multiplier?

The Efficiency Multiplier combines AI-assisted PRs merged, cost per PR, and rework rate into one configurable ROI number. The weighting is adjustable per organization, so a team that optimizes for quality isn't penalized by a velocity-heavy default. The output is a single comparable metric.

What is the Hivel Quadrant?

The Hivel Quadrant plots every team by AI spend (X-axis) and PR output (Y-axis), divided into four quadrants: Low Spend High Output (the model), High Spend High Output (validated investment), Low Spend Low Output (low engagement), High Spend Low Output (intervention needed). One chart for three decisions: coaching, procurement, and renewal.

How does Efficiency tie back to the other SURGE pillars?

Efficiency closes the SURGE loop. Spend supplies the denominator. Utilization supplies the adoption depth. Recovery surfaces the addressable waste. Gains measures what AI shipped. Efficiency synthesizes all four into a single ROI multiplier and feeds into Hivel Score, Cockpit, Team Pulse, and Goals dashboards.

Is our data secure?

Yes. Hivel reads from engineering tools and AI tool admin APIs with read-only access. Source code is never stored. Prompt content is not retained. SOC 2 Type II and ISO 27001 certified.

Trusted by 1000+ Engineering Teams

Vaibhav Bansal
V.P. Engineering
"Hivel has been phenomenal in helping us present our progress to leadership. Its insights into leading indicators have empowered our team leads to enhance review efficiency and ship features faster. Now, we are able to show the impact of our process changes, clearly identify areas of opportunity, and bring in a data-driven culture without spending time pulling manual reports."
Murali Swaminathan
Chief Technology Officer
"We were looking for a unique solution to understand engineering productivity and efficiency, with a single tool that could give leaders complete visibility. We evaluated other comparable tools, but none were comprehensive enough. When we came across Hivel, it checked all the boxes for measuring developer productivity across both AI and non-AI workflows."
Derek Mackie
Director of Engineering
"Using Hivel shone a light on the non-standard aspects of our work, emphasizing the need for crucial adjustments. The insights from Hivel helped us recognize areas for improvement, particularly in managing cycle times and streamlining development workflows. This guidance has been instrumental in our efforts to enhance operational efficiency and productivity."
Leonardo Pinheiro Ferrari
Chief Technology Officer
"Thanks to Hivel, we've seen a staggering 157% improvement in our deployment frequency. By identifying and addressing inefficiencies, and adopting best practices, we've significantly accelerated our progress. Hivel has been instrumental in our journey to operational excellence."
Chris Callander
Senior Engineering Manager
"Hivel has been instrumental in identifying areas for enhancement and guiding our strategic improvements. It has significantly contributed to our journey toward greater operational efficiency. The Activity and Dev360 features in Hivel have been particularly valuable for providing feedback to engineers during 1-1's, enhancing our communication and development practices."
Shiro Theuri
Chief Technology Officer
"Before Hivel, understanding our engineering team's dynamics was a game of guesswork. Now, with Hivel's clear dashboards and insights, our leaders have the clarity and time-saving tools they need to excel. It's been transformative in streamlining our operations."
Koti Reddy
Chief Technology Officer
"Incorporating Hivel into our daily operations has been a game-changer. It's not just a tool; it's a part of our strategic decision-making process, trusted by our leaders at every level. The impact on our engineering efficiency is undeniable and deeply valued."
Manoj Awasthi
Chief Technology Officer
"It has been great to partner with Hivel to get access to insights that help leaders at all levels gain visibility into bottlenecks and challenges that the teams face, build actionable plan to resolve them and track the progress over time. And thanks for the fantastic support!"
Ameen M
Engineering Manager
"Hivel has made a huge difference to how I manage my teams. Before every one-on-one or appraisal, I rely on it to dive into developer metrics and drive truly meaningful conversations. It helps me spot rework patterns, reward high performers, and benchmark our teams even against our US counterparts. The dashboards are intuitive, insightful, and honestly far more actionable than anything we get from Jira."
Paras Sood
Associate Director
"Hivel's insights have been pivotal in refining our engineering processes, elevating both efficiency and the developer experience. We're now making smarter decisions, faster, thanks to Hivel."
Vaibhav Bansal
V.P. Engineering
"Hivel has been phenomenal in helping us present our progress to leadership. Its insights into leading indicators have empowered our team leads to enhance review efficiency and ship features faster. Now, we are able to show the impact of our process changes, clearly identify areas of opportunity, and bring in a data-driven culture without spending time pulling manual reports."
Murali Swaminathan
Chief Technology Officer
“We were looking for a unique solution to understand engineering productivity and efficiency, with a single tool that could give leaders complete visibility. We evaluated other comparable tools, but none were comprehensive enough. When we came across Hivel, it checked all the boxes for measuring developer productivity across both AI and non-AI workflows.”
Vaibhav Bansal
V.P. Engineering
"Hivel has been phenomenal in helping us present our progress to leadership. Its insights into leading indicators have empowered our team leads to enhance review efficiency and ship features faster. Now, we are able to show the impact of our process changes, clearly identify areas of opportunity, and bring in a data-driven culture without spending time pulling manual reports."
Derek Mackie
Director of Engineering
"Using Hivel shone a light on the non-standard aspects of our work, emphasizing the need for crucial adjustments. The insights from Hivel helped us recognize areas for improvement, particularly in managing cycle times and streamlining development workflows. This guidance has been instrumental in our efforts to enhance operational efficiency and productivity."
Leonardo Pinheiro Ferrari
Chief Technology Officer
"Thanks to Hivel, we've seen a staggering 157% improvement in our deployment frequency. By identifying and addressing inefficiencies, and adopting best practices, we've significantly accelerated our progress. Hivel has been instrumental in our journey to operational excellence."

"The only tool our entire leadership team actually trusts"