Get the full picture on your AI adoption and impact.

We'll show you exactly how AI is impacting your speed and code quality.

NO CODE ACCESS
FREE AI ROI REPORT
NO CREDIT CARD
4.7/5

Product Leaders

Know what's causing the gap between your roadmap and what actually shipped last quarter.

Get visibility into what engineering committed to, what shipped, how capacity was split across new features versus rework, and whether bug volume is climbing against the releases you're planning — without waiting for the sprint retrospective to find out.
You set the roadmap. Rework, bugs, and unplanned work decide how much of it actually ships.

Every sprint starts with a plan. By the end, some features shipped, some spilled over, and some never made it to the board. The explanation is usually vague — "engineering was busy," "there were some bugs," "we had to refactor something." What was actually consuming capacity, and how much, stays invisible until the retrospective. By then, the next sprint's commitments are already made.

Sprint spillover has no root cause attached to it

A feature that didn't ship this sprint is a story point that moved to the next one. Whether it spilled because of a review bottleneck, a scope change, or a codebase that required three days of rework to touch — none of that is visible in the Jira ticket.

No view of how capacity splits across new work vs maintenance

How much of last quarter's engineering effort went to new features versus fixing existing ones? Most product leaders can't answer this — and can't make an accurate capacity commitment to stakeholders until they can.

Bug volume trends are invisible until they affect a release

Bugs accumulate quietly across Jira projects. By the time inflow outpaces resolution, a release timeline is already at risk. There's no cross-project view to catch it earlier.

Four tabs. Every angle on engineering effort.

"Did we ship what we committed to — and where did the gaps come from?"

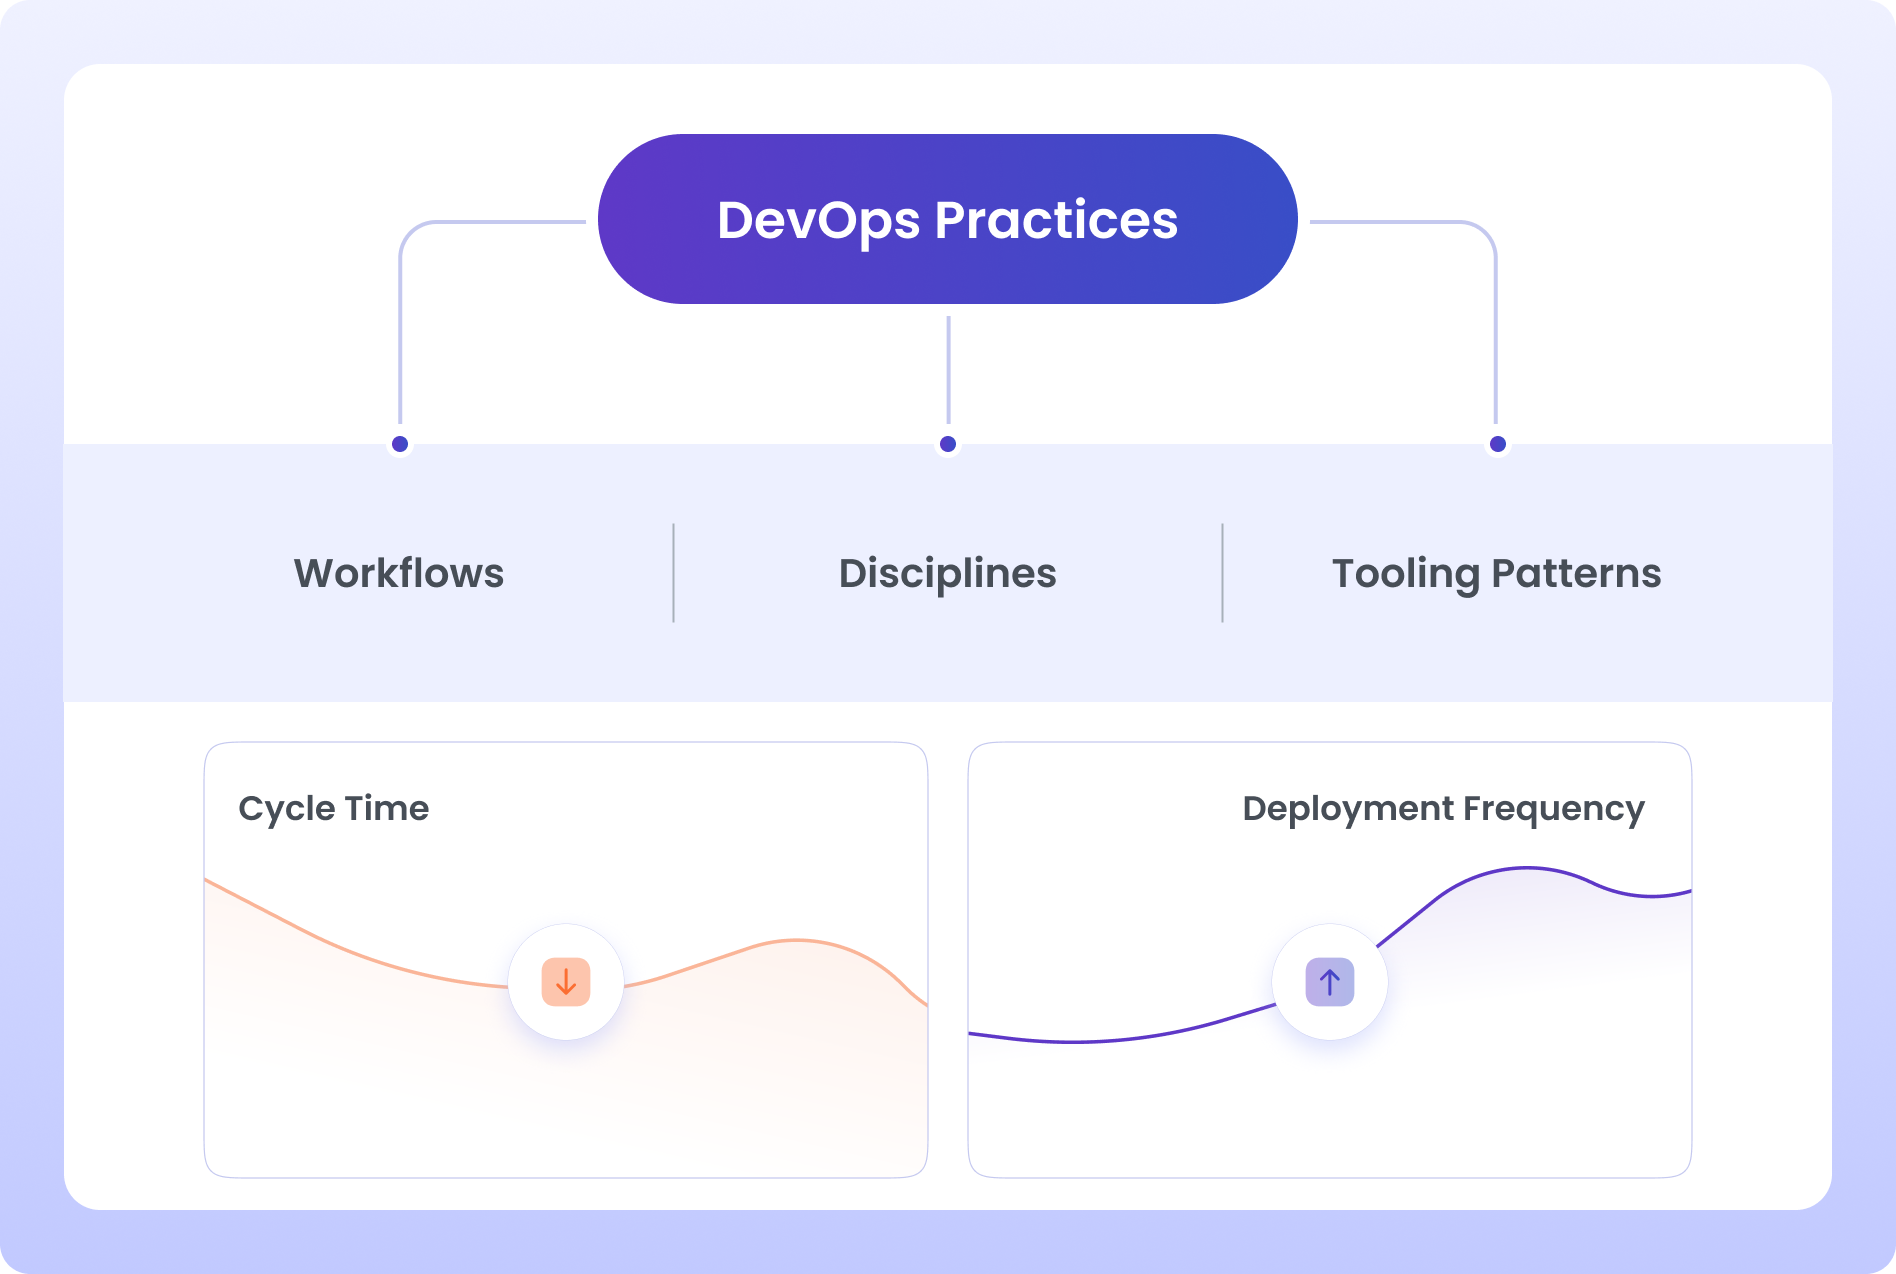
See sprint-by-sprint delivery accuracy: what was committed, what completed, and what spilled over — visualized as completion and spillover rates per sprint. Drill from the delivery view into the specific epics and issues that carried over to understand whether the pattern is improving or recurring.
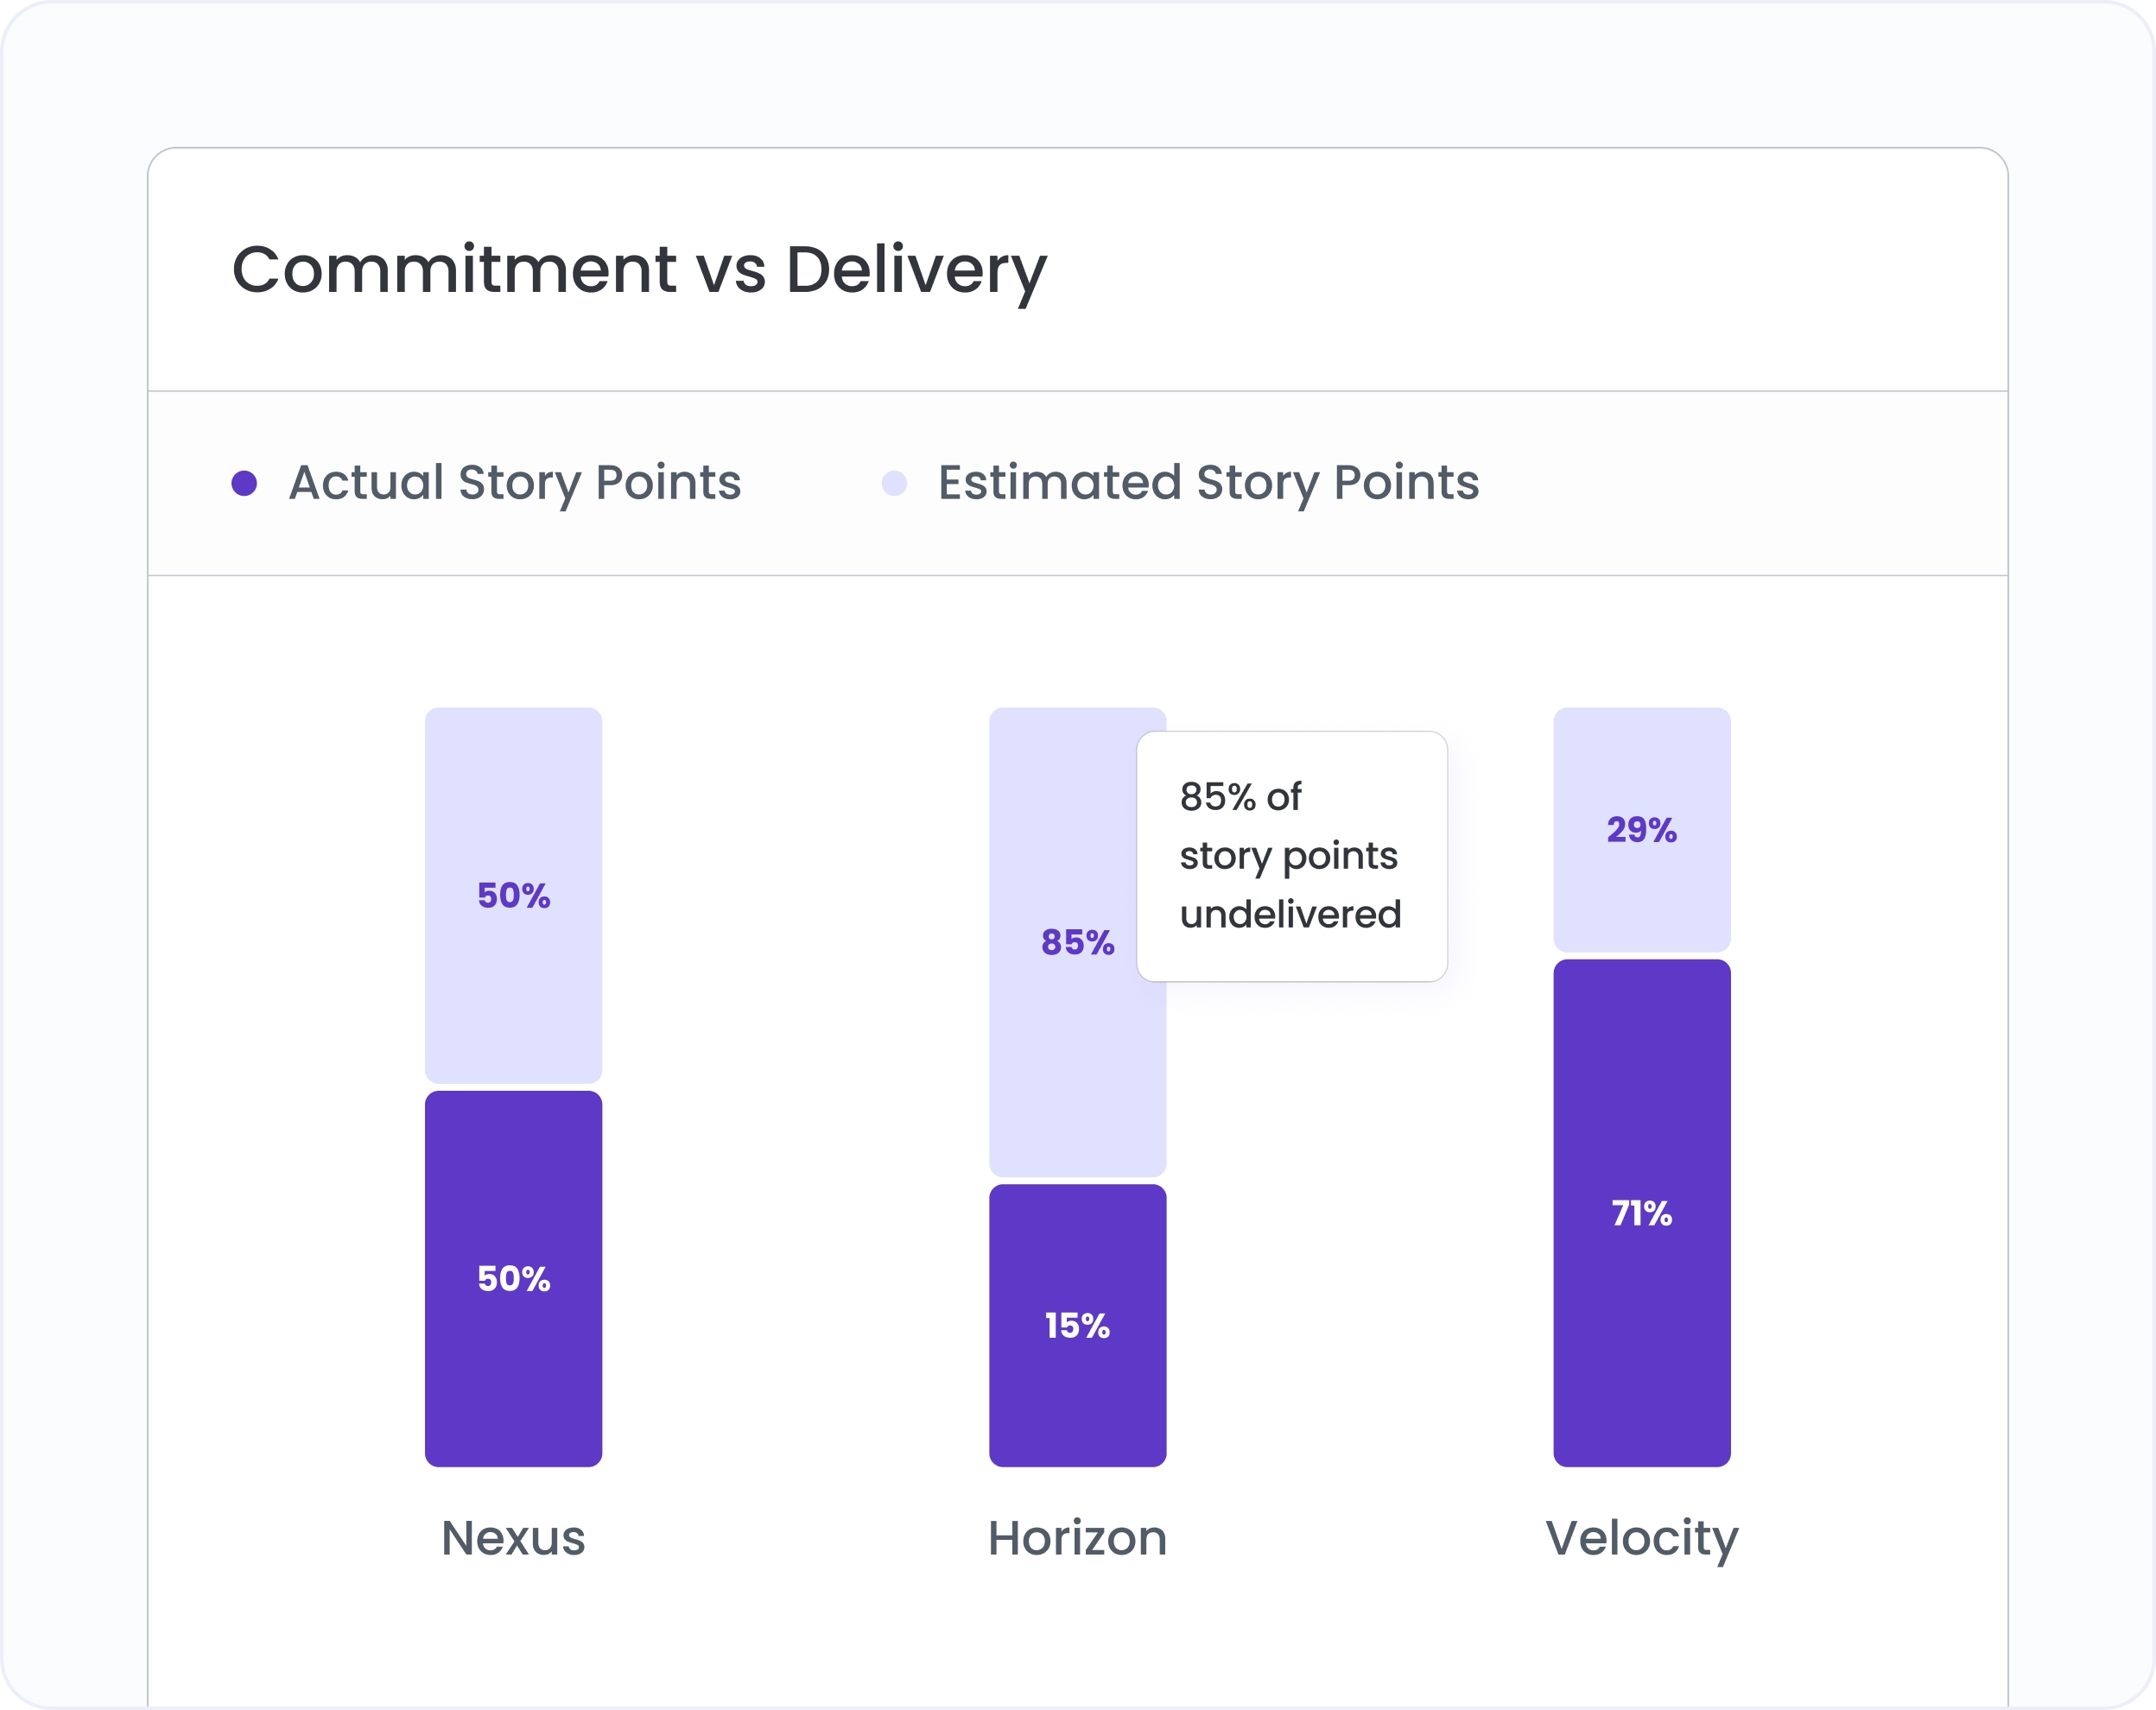
"How much capacity went to the roadmap — versus everything else?"

See how engineering capacity distributed across product areas, epics, and specific work items — in story points or ticket counts, by sprint or by date range. The allocation view shows where engineering time actually went versus where the roadmap assumed it would go.
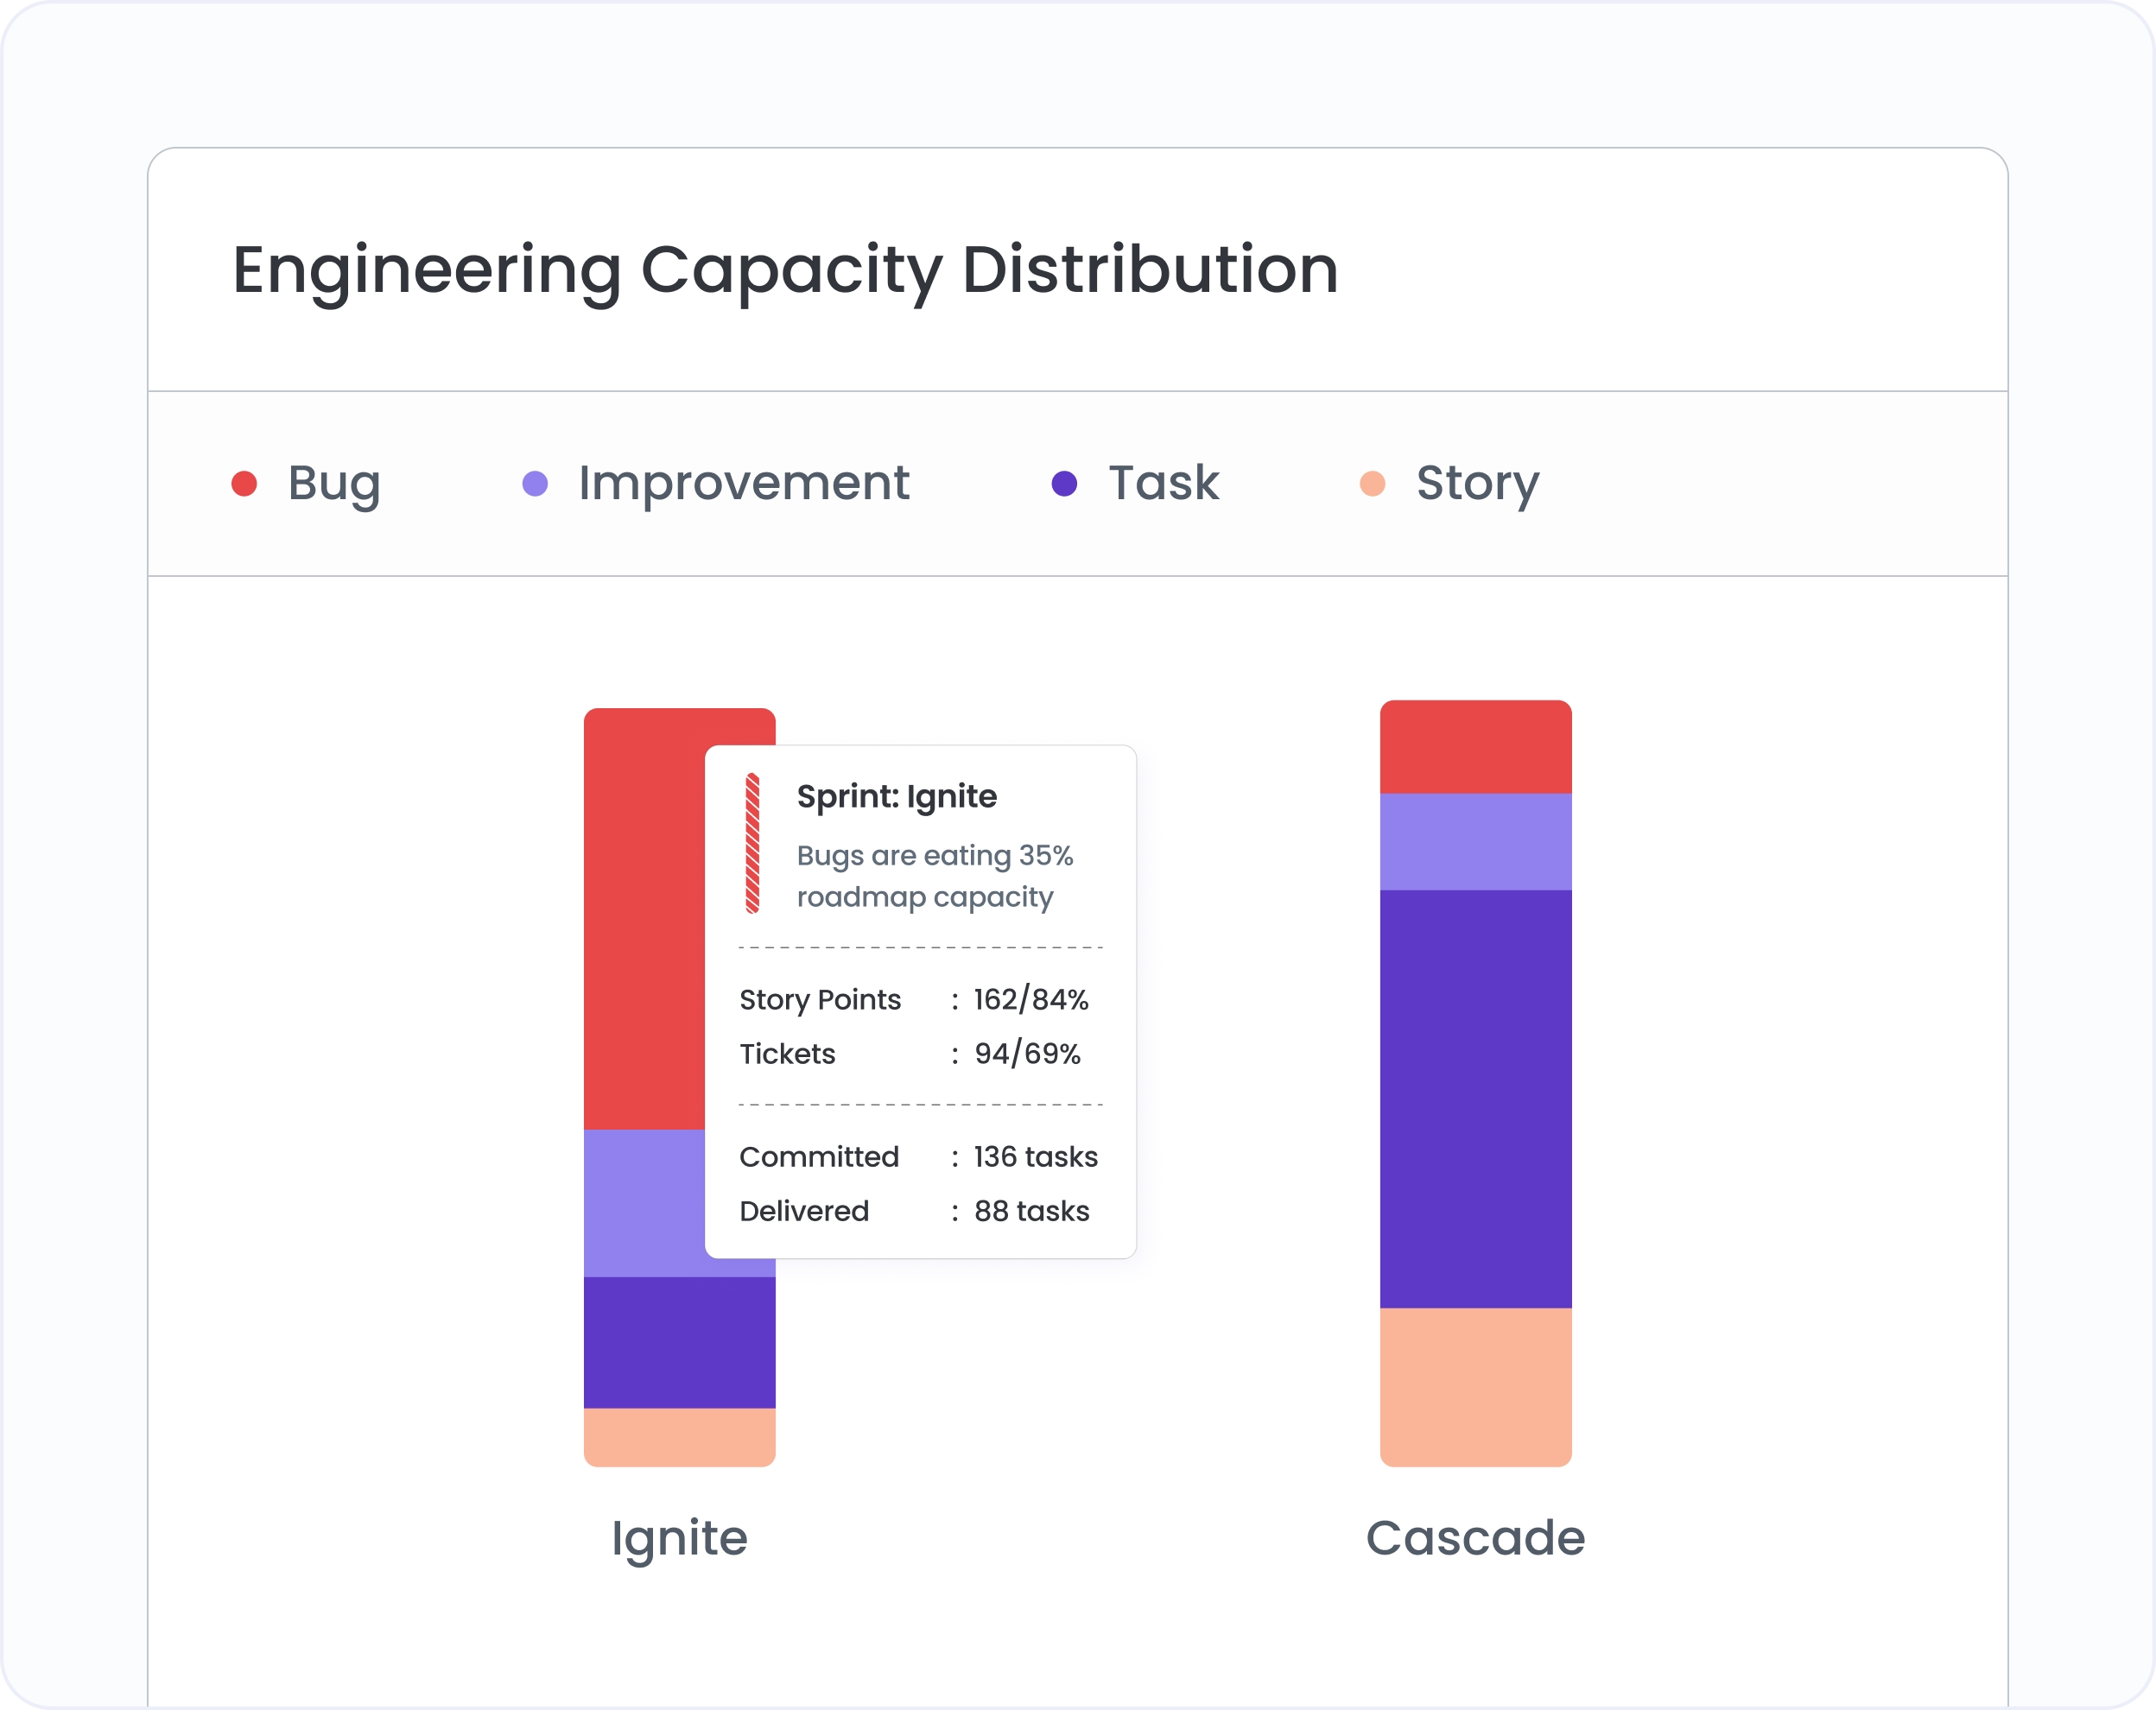
"How much of engineering capacity is going to new features — and how much to fixing existing ones?"

See the split between new feature development, rework, and maintenance — week by week, across every team. When rework is consuming 40% of a sprint, that's not an engineering problem — it's a signal that requirements or quality gates upstream need attention.

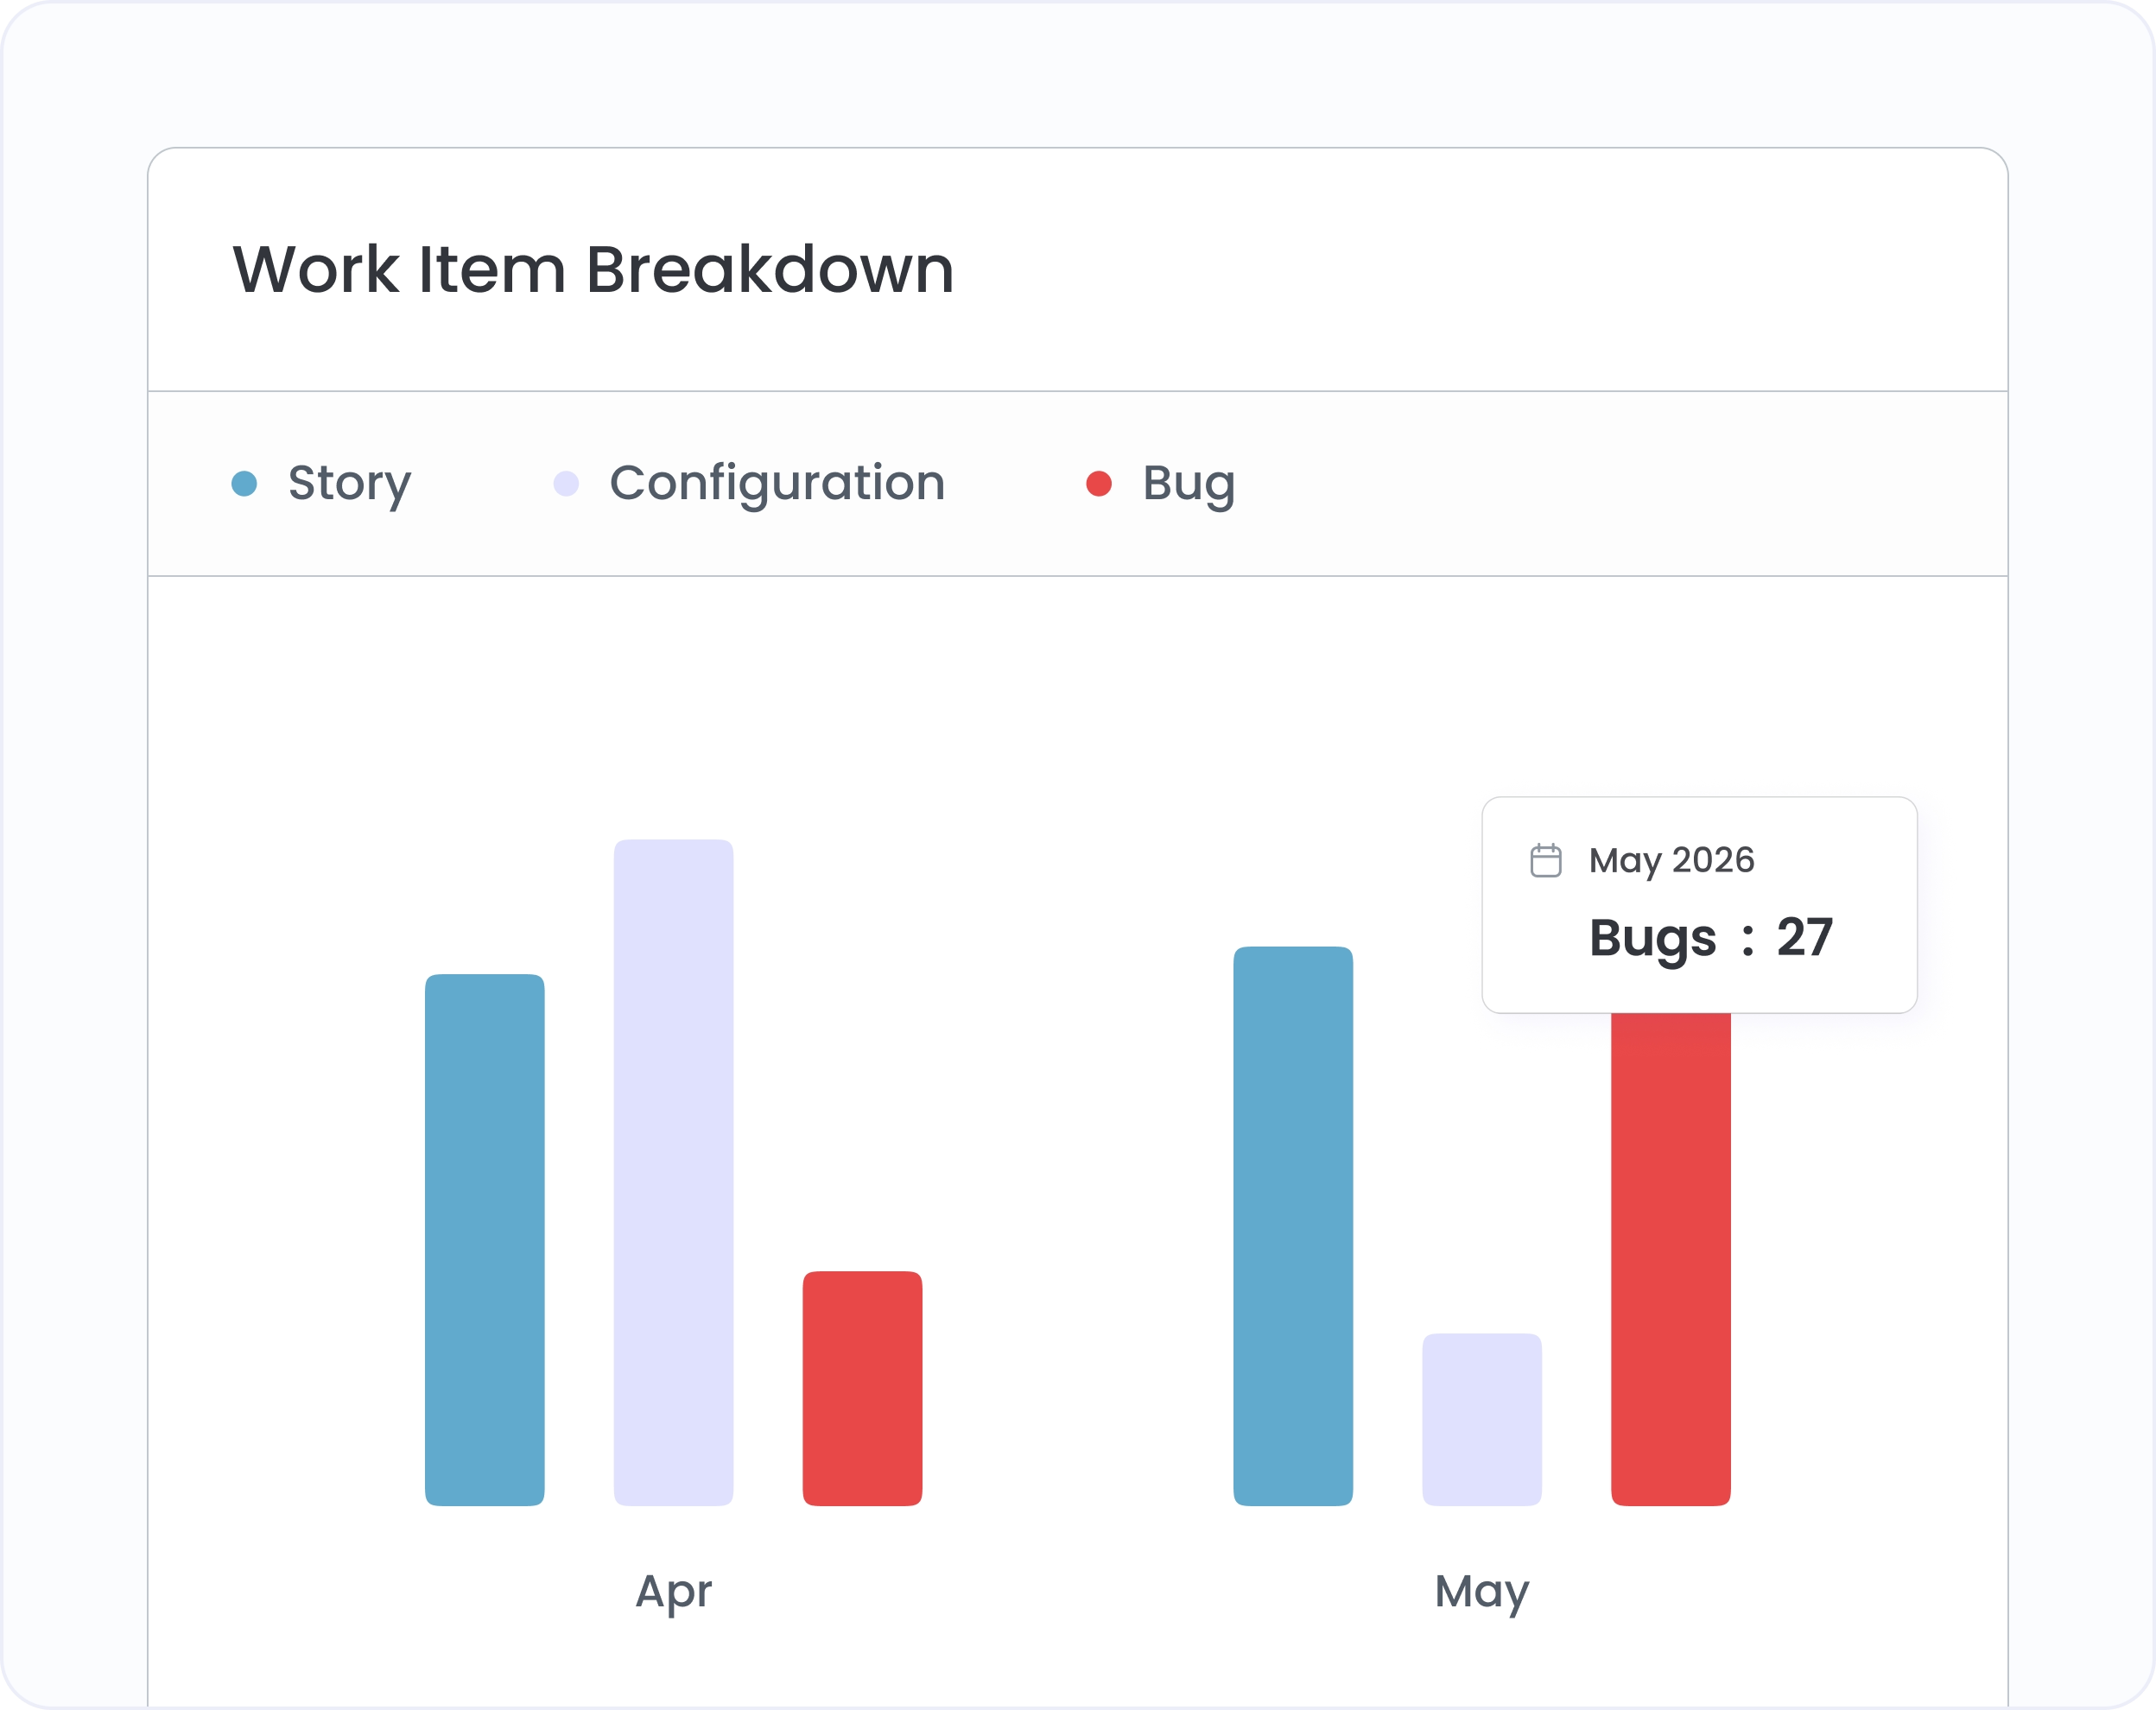
"Is quality holding as we push release velocity?"

See bug creation and resolution rates across every Jira project — grouped by time or by project. The quarter where bug inflow starts outpacing resolution is visible before it becomes a release decision. Compare bug-to-feature ratios across product areas to see where quality is under pressure.
Hivel × Freshworks Case Study Card
Freshworks NASDAQ: FRSH

How Freshworks measured AI impact across 1,500 engineers — in real time

No standard way to measure AI adoption across 1,500 engineers
Couldn't tell which AI tools were helping vs just running
Surveys were the only answer — slow, expensive, inaccurate
40% Increase in engineering throughput
50% Reduction in rework and maintenance
25% More features released in key business units
10% Improvement in time-to-market

Frequently asked questions

Can I see delivery accuracy at the epic level — not just the sprint level?

Yes. The investment view lets you switch between work item, epic, product, and allocation views — all filterable by sprint or date range. Drill from the sprint delivery summary into specific epics to see which ones completed, which spilled, and which were added mid-sprint.

How does Hivel define "rework"?

Rework is code modified or deleted within 30 days of being originally written — covering bug fixes caught in QA, scope changes mid-sprint, and integration failures. The 30-day window aligns to a typical 2-3 week sprint cycle. Code modified after 30 days is classified as maintenance. Both signal different upstream problems worth addressing in planning.

Can I track bug trends across multiple Jira projects simultaneously?

Yes. The bug inflow view supports multi-project selection — choose any combination of Jira projects and see issue type distribution grouped by time or by project. This gives product leaders a cross-product quality view that individual Jira boards can't provide.


Trusted by 1000+ Engineering Teams

Vaibhav Bansal
V.P. Engineering
"Hivel has been phenomenal in helping us present our progress to leadership. Its insights into leading indicators have empowered our team leads to enhance review efficiency and ship features faster. Now, we are able to show the impact of our process changes, clearly identify areas of opportunity, and bring in a data-driven culture without spending time pulling manual reports."
Murali Swaminathan
Chief Technology Officer
"We were looking for a unique solution to understand engineering productivity and efficiency, with a single tool that could give leaders complete visibility. We evaluated other comparable tools, but none were comprehensive enough. When we came across Hivel, it checked all the boxes for measuring developer productivity across both AI and non-AI workflows."
Derek Mackie
Director of Engineering
"Using Hivel shone a light on the non-standard aspects of our work, emphasizing the need for crucial adjustments. The insights from Hivel helped us recognize areas for improvement, particularly in managing cycle times and streamlining development workflows. This guidance has been instrumental in our efforts to enhance operational efficiency and productivity."
Leonardo Pinheiro Ferrari
Chief Technology Officer
"Thanks to Hivel, we've seen a staggering 157% improvement in our deployment frequency. By identifying and addressing inefficiencies, and adopting best practices, we've significantly accelerated our progress. Hivel has been instrumental in our journey to operational excellence."
Chris Callander
Senior Engineering Manager
"Hivel has been instrumental in identifying areas for enhancement and guiding our strategic improvements. It has significantly contributed to our journey toward greater operational efficiency. The Activity and Dev360 features in Hivel have been particularly valuable for providing feedback to engineers during 1-1's, enhancing our communication and development practices."
Shiro Theuri
Chief Technology Officer
"Before Hivel, understanding our engineering team's dynamics was a game of guesswork. Now, with Hivel's clear dashboards and insights, our leaders have the clarity and time-saving tools they need to excel. It's been transformative in streamlining our operations."
Koti Reddy
Chief Technology Officer
"Incorporating Hivel into our daily operations has been a game-changer. It's not just a tool; it's a part of our strategic decision-making process, trusted by our leaders at every level. The impact on our engineering efficiency is undeniable and deeply valued."
Manoj Awasthi
Chief Technology Officer
"It has been great to partner with Hivel to get access to insights that help leaders at all levels gain visibility into bottlenecks and challenges that the teams face, build actionable plan to resolve them and track the progress over time. And thanks for the fantastic support!"
Ameen M
Engineering Manager
"Hivel has made a huge difference to how I manage my teams. Before every one-on-one or appraisal, I rely on it to dive into developer metrics and drive truly meaningful conversations. It helps me spot rework patterns, reward high performers, and benchmark our teams even against our US counterparts. The dashboards are intuitive, insightful, and honestly far more actionable than anything we get from Jira."
Paras Sood
Associate Director
"Hivel's insights have been pivotal in refining our engineering processes, elevating both efficiency and the developer experience. We're now making smarter decisions, faster, thanks to Hivel."
Vaibhav Bansal
V.P. Engineering
"Hivel has been phenomenal in helping us present our progress to leadership. Its insights into leading indicators have empowered our team leads to enhance review efficiency and ship features faster. Now, we are able to show the impact of our process changes, clearly identify areas of opportunity, and bring in a data-driven culture without spending time pulling manual reports."
Murali Swaminathan
Chief Technology Officer
“We were looking for a unique solution to understand engineering productivity and efficiency, with a single tool that could give leaders complete visibility. We evaluated other comparable tools, but none were comprehensive enough. When we came across Hivel, it checked all the boxes for measuring developer productivity across both AI and non-AI workflows.”
Vaibhav Bansal
V.P. Engineering
"Hivel has been phenomenal in helping us present our progress to leadership. Its insights into leading indicators have empowered our team leads to enhance review efficiency and ship features faster. Now, we are able to show the impact of our process changes, clearly identify areas of opportunity, and bring in a data-driven culture without spending time pulling manual reports."
Derek Mackie
Director of Engineering
"Using Hivel shone a light on the non-standard aspects of our work, emphasizing the need for crucial adjustments. The insights from Hivel helped us recognize areas for improvement, particularly in managing cycle times and streamlining development workflows. This guidance has been instrumental in our efforts to enhance operational efficiency and productivity."
Leonardo Pinheiro Ferrari
Chief Technology Officer
"Thanks to Hivel, we've seen a staggering 157% improvement in our deployment frequency. By identifying and addressing inefficiencies, and adopting best practices, we've significantly accelerated our progress. Hivel has been instrumental in our journey to operational excellence."

"The only tool our entire leadership team actually trusts"