Get the full picture on your AI adoption and impact.
We'll show you exactly how AI is impacting your speed and code quality.
NO CODE ACCESS
FREE AI ROI REPORT
NO CREDIT CARD
4.7/5


We'll show you exactly how AI is impacting your speed and code quality.
Get a live view of engineering health across every team: where release timelines are at risk, which teams are slipping, and whether AI tools are producing better outcomes where they're used.
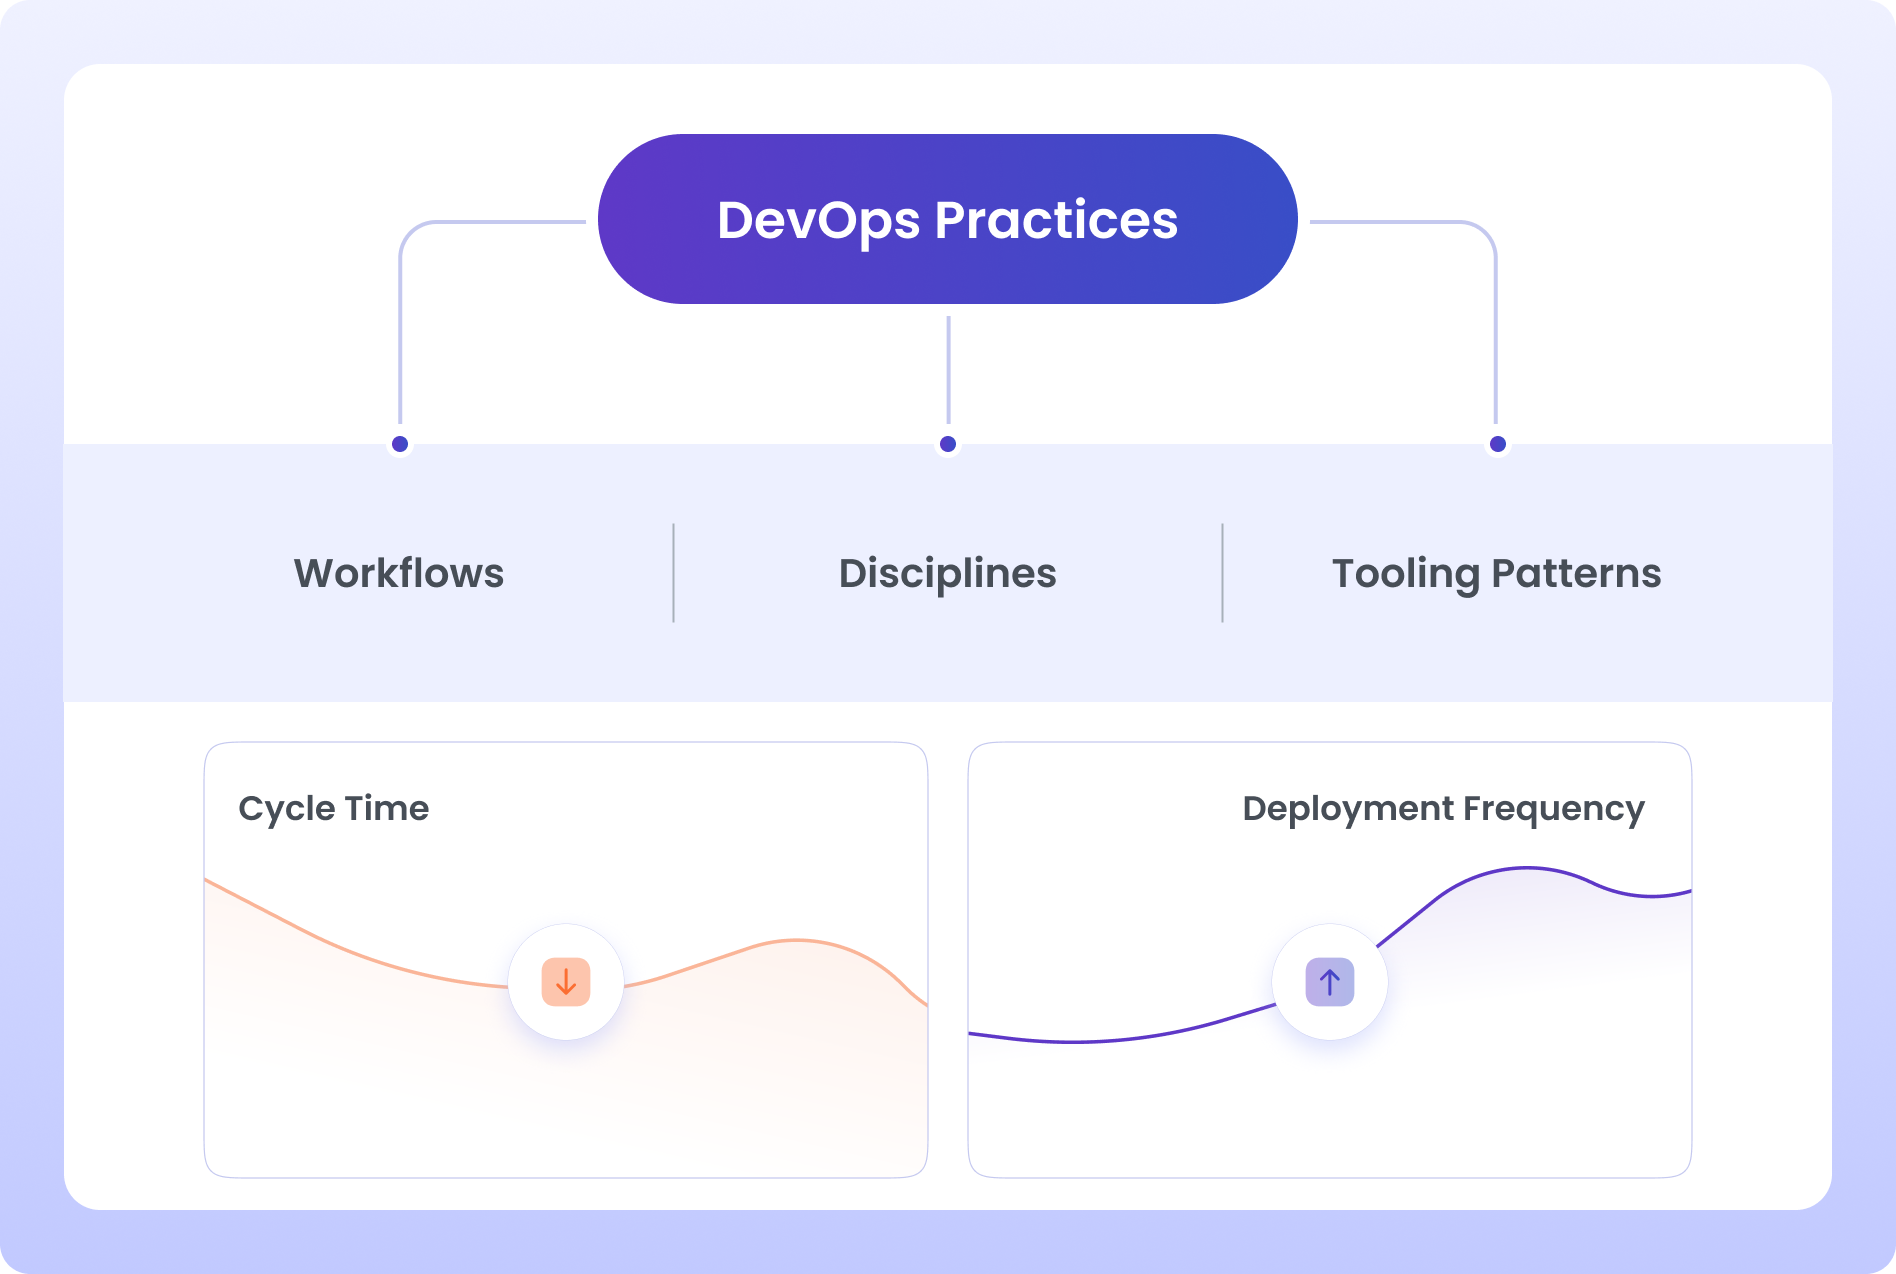
You're accountable for delivery across teams you can't watch at once. Timelines slip in one team. Review coverage drops in another. AI tools sit unused in a third. By the time you hear, course-correction has passed.
Each team runs its own dashboards, metrics, and interpretation of what's going well. Cross-team release health gets built manually, and only after a release misses.
The sprint where review time spiked and slowed the whole release was visible in the data for three weeks. Nobody looked. The next sprint repeated the pattern.
Some teams adopted Copilot immediately. Others barely use it. Whether the adopters outperform the laggards, and by how much, is a question most VPs can't answer.
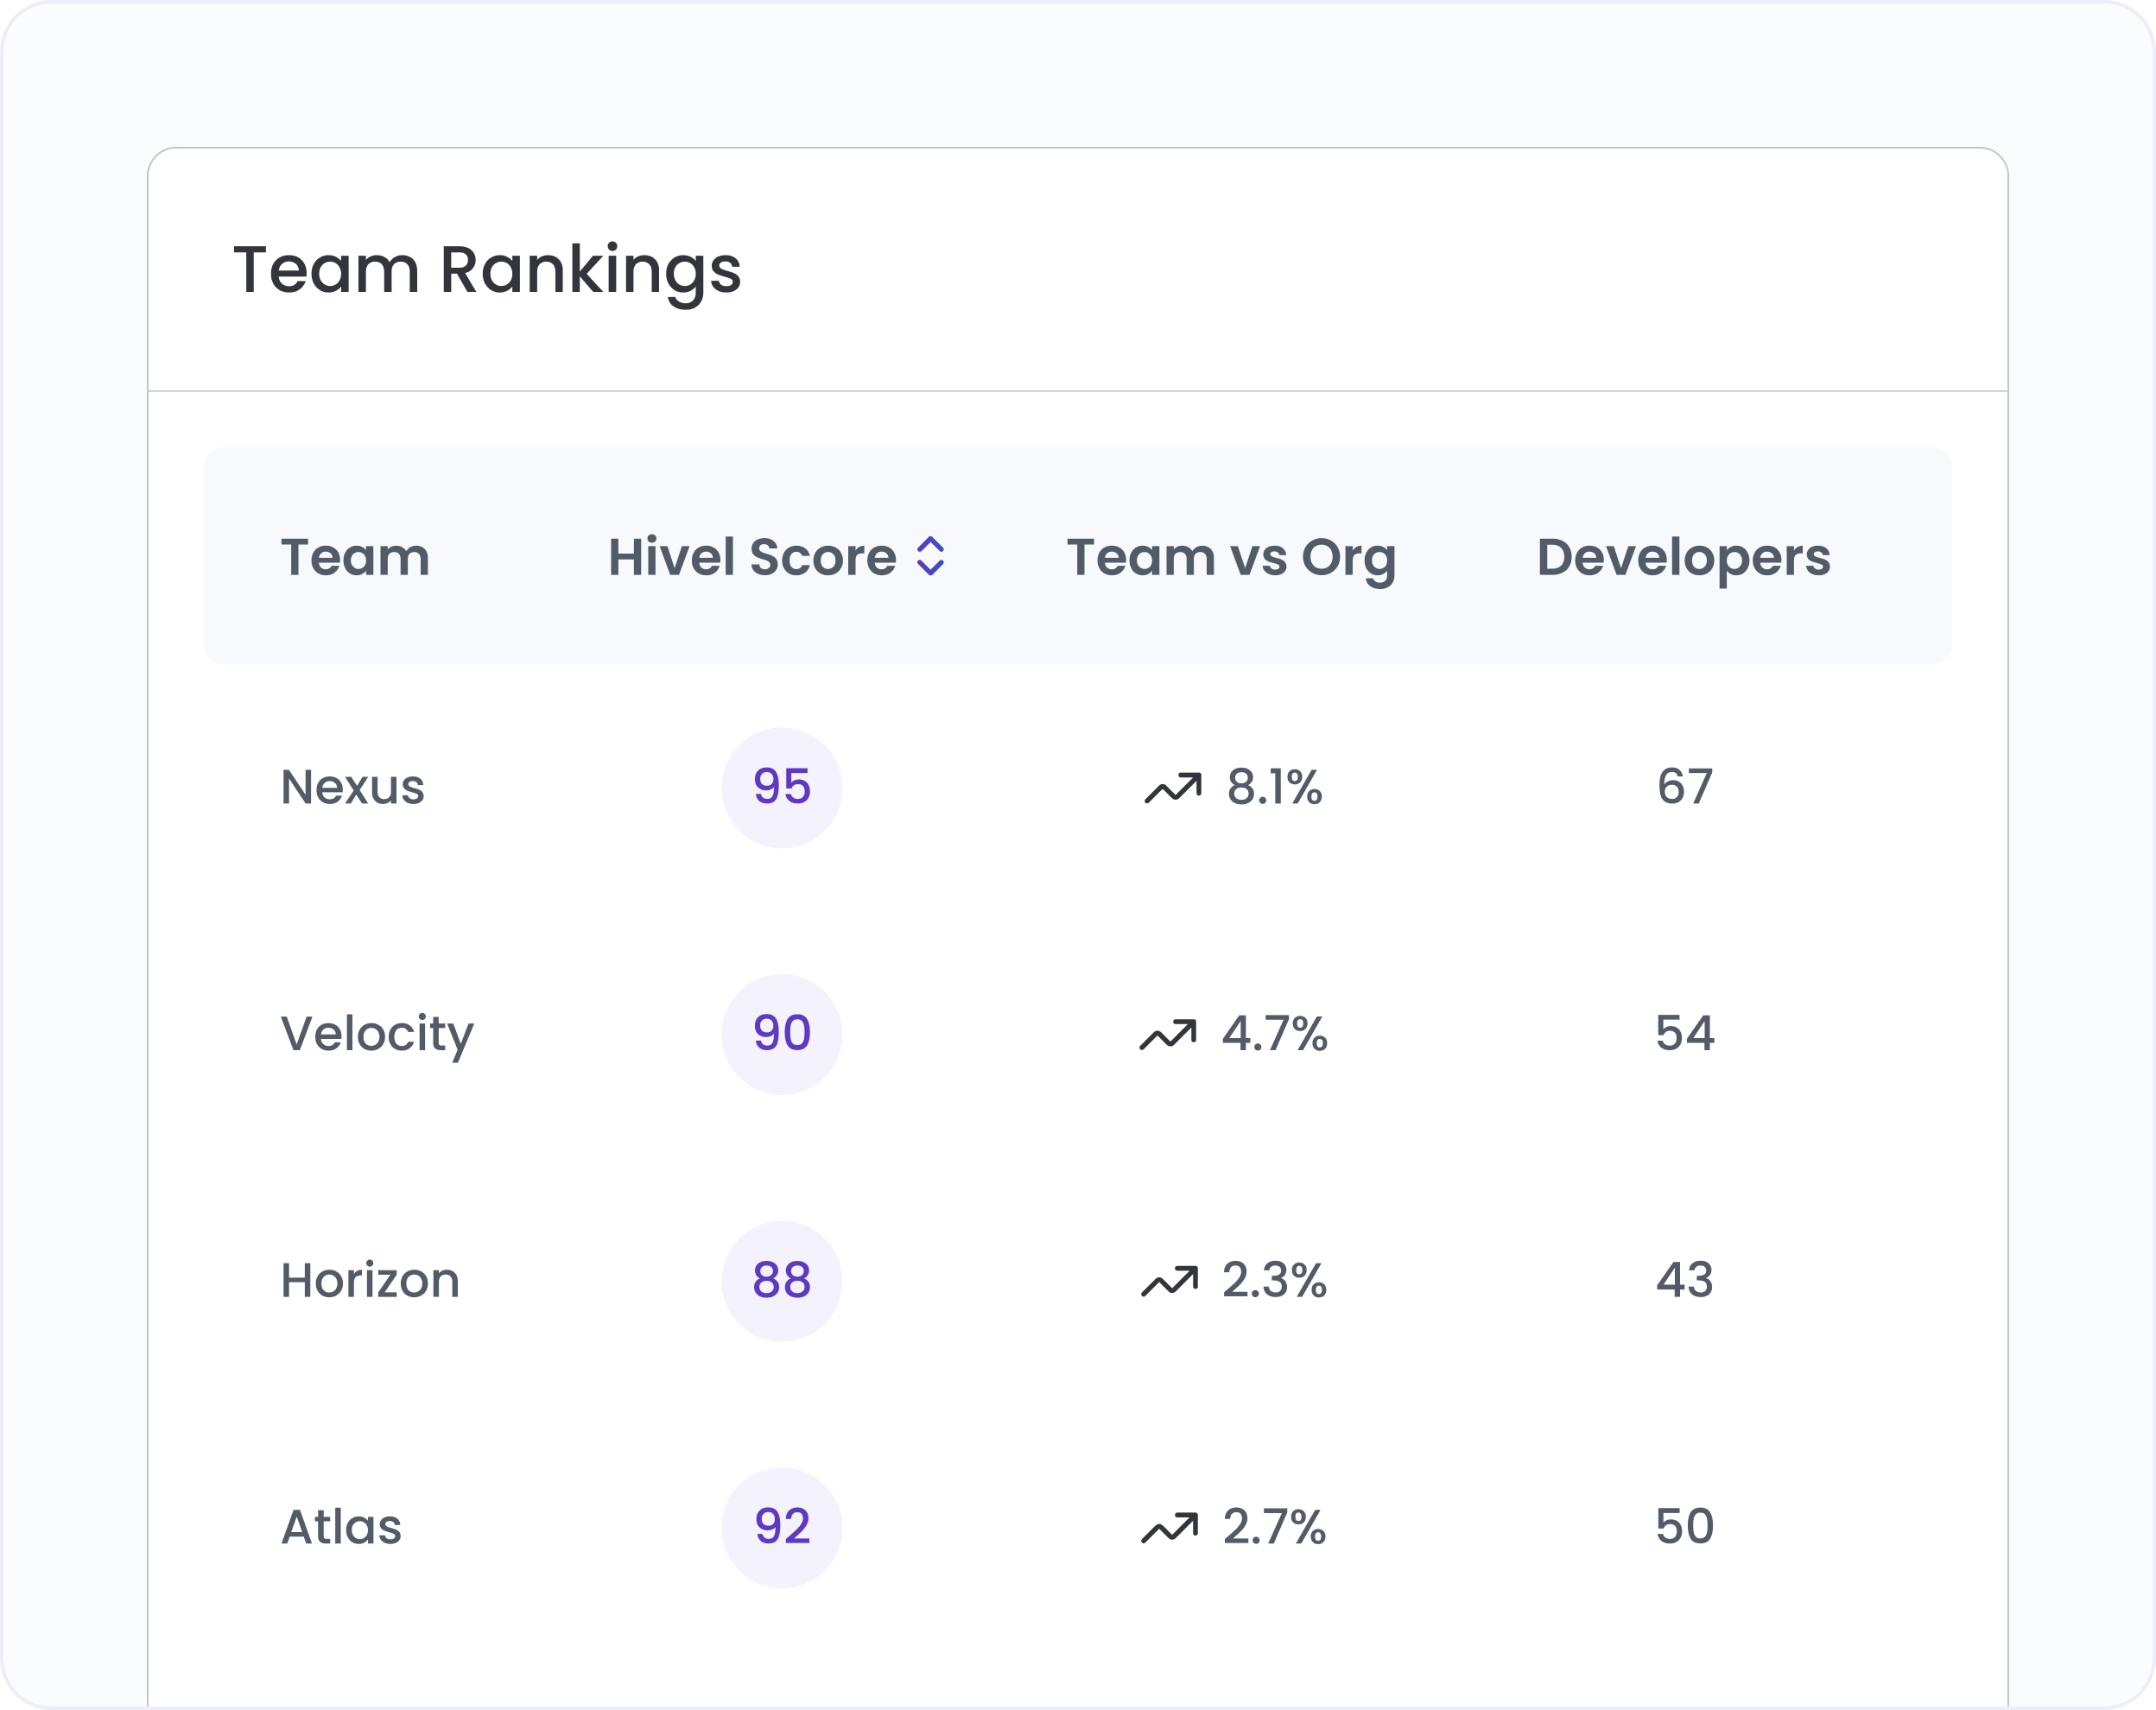
See a single composite score across Speed, Quality, and Throughput for the whole org. A team rankings table shows top and bottom performers in the same view. Intervene before the low-scoring teams become a missed release.
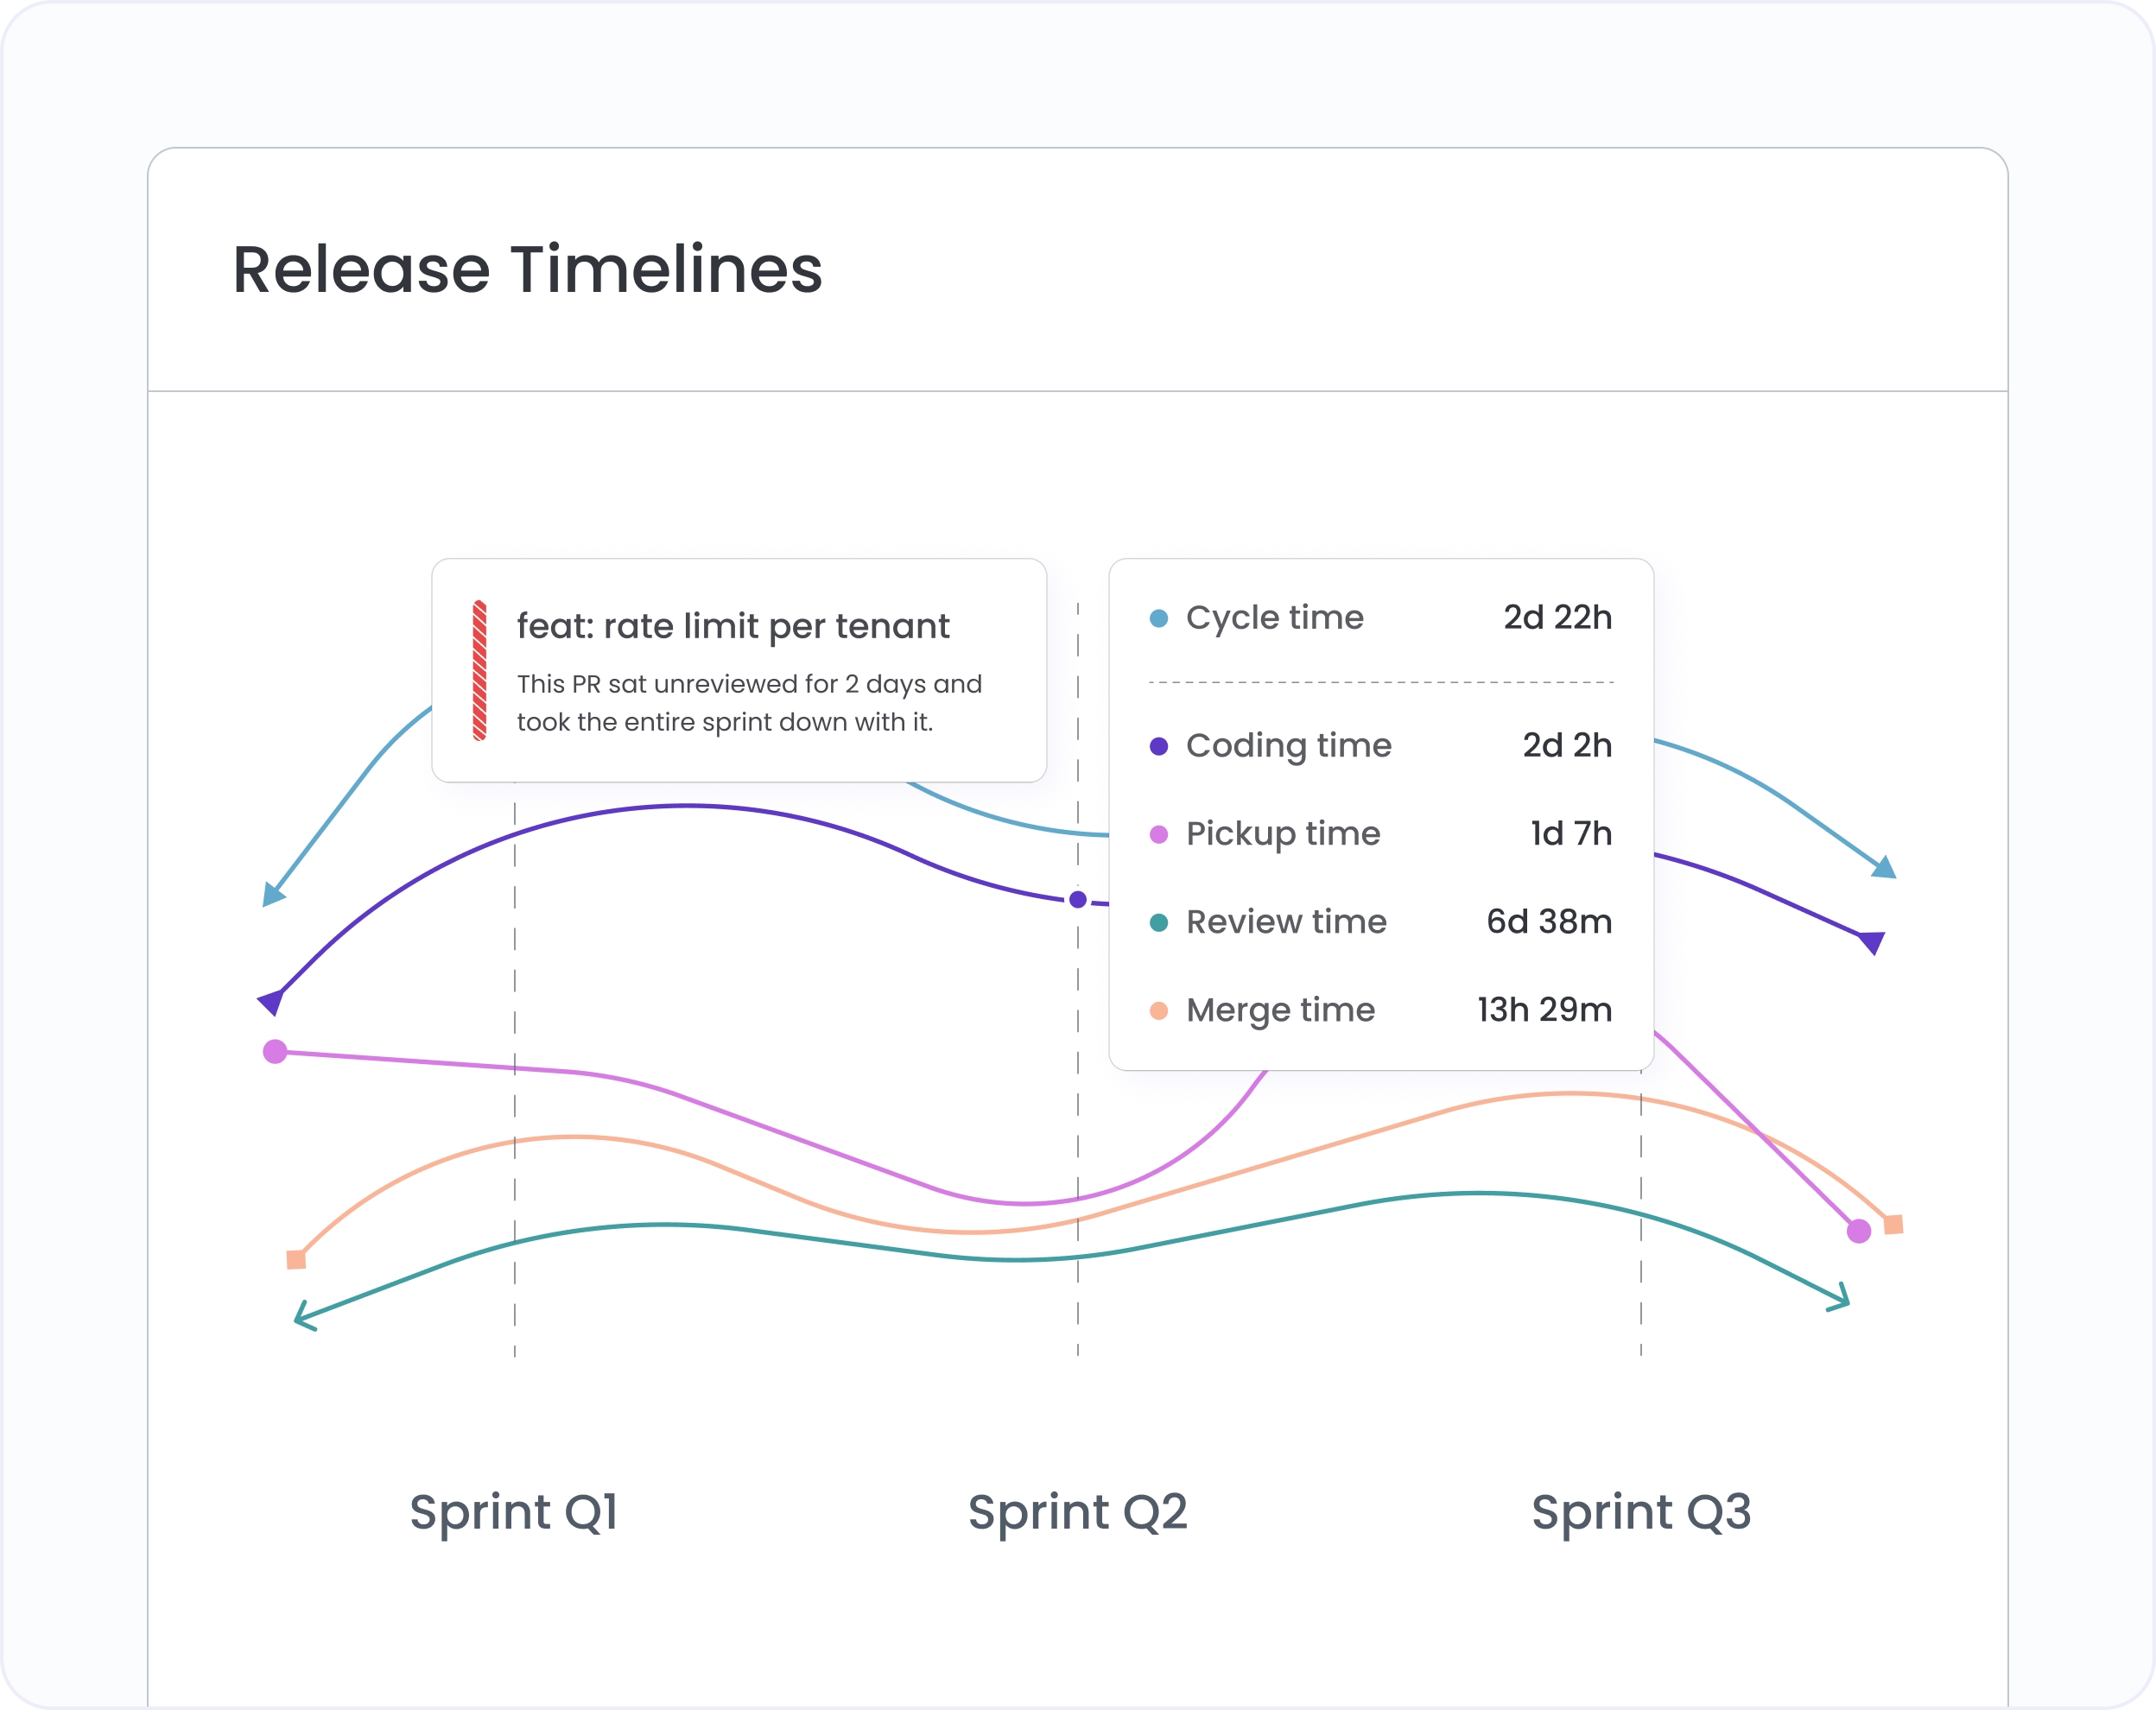
See how each week's release timeline splits across coding, pickup, review, and merge across every team. Click any period to see the PRs behind the slowdown, before anyone raises it in a retrospective.
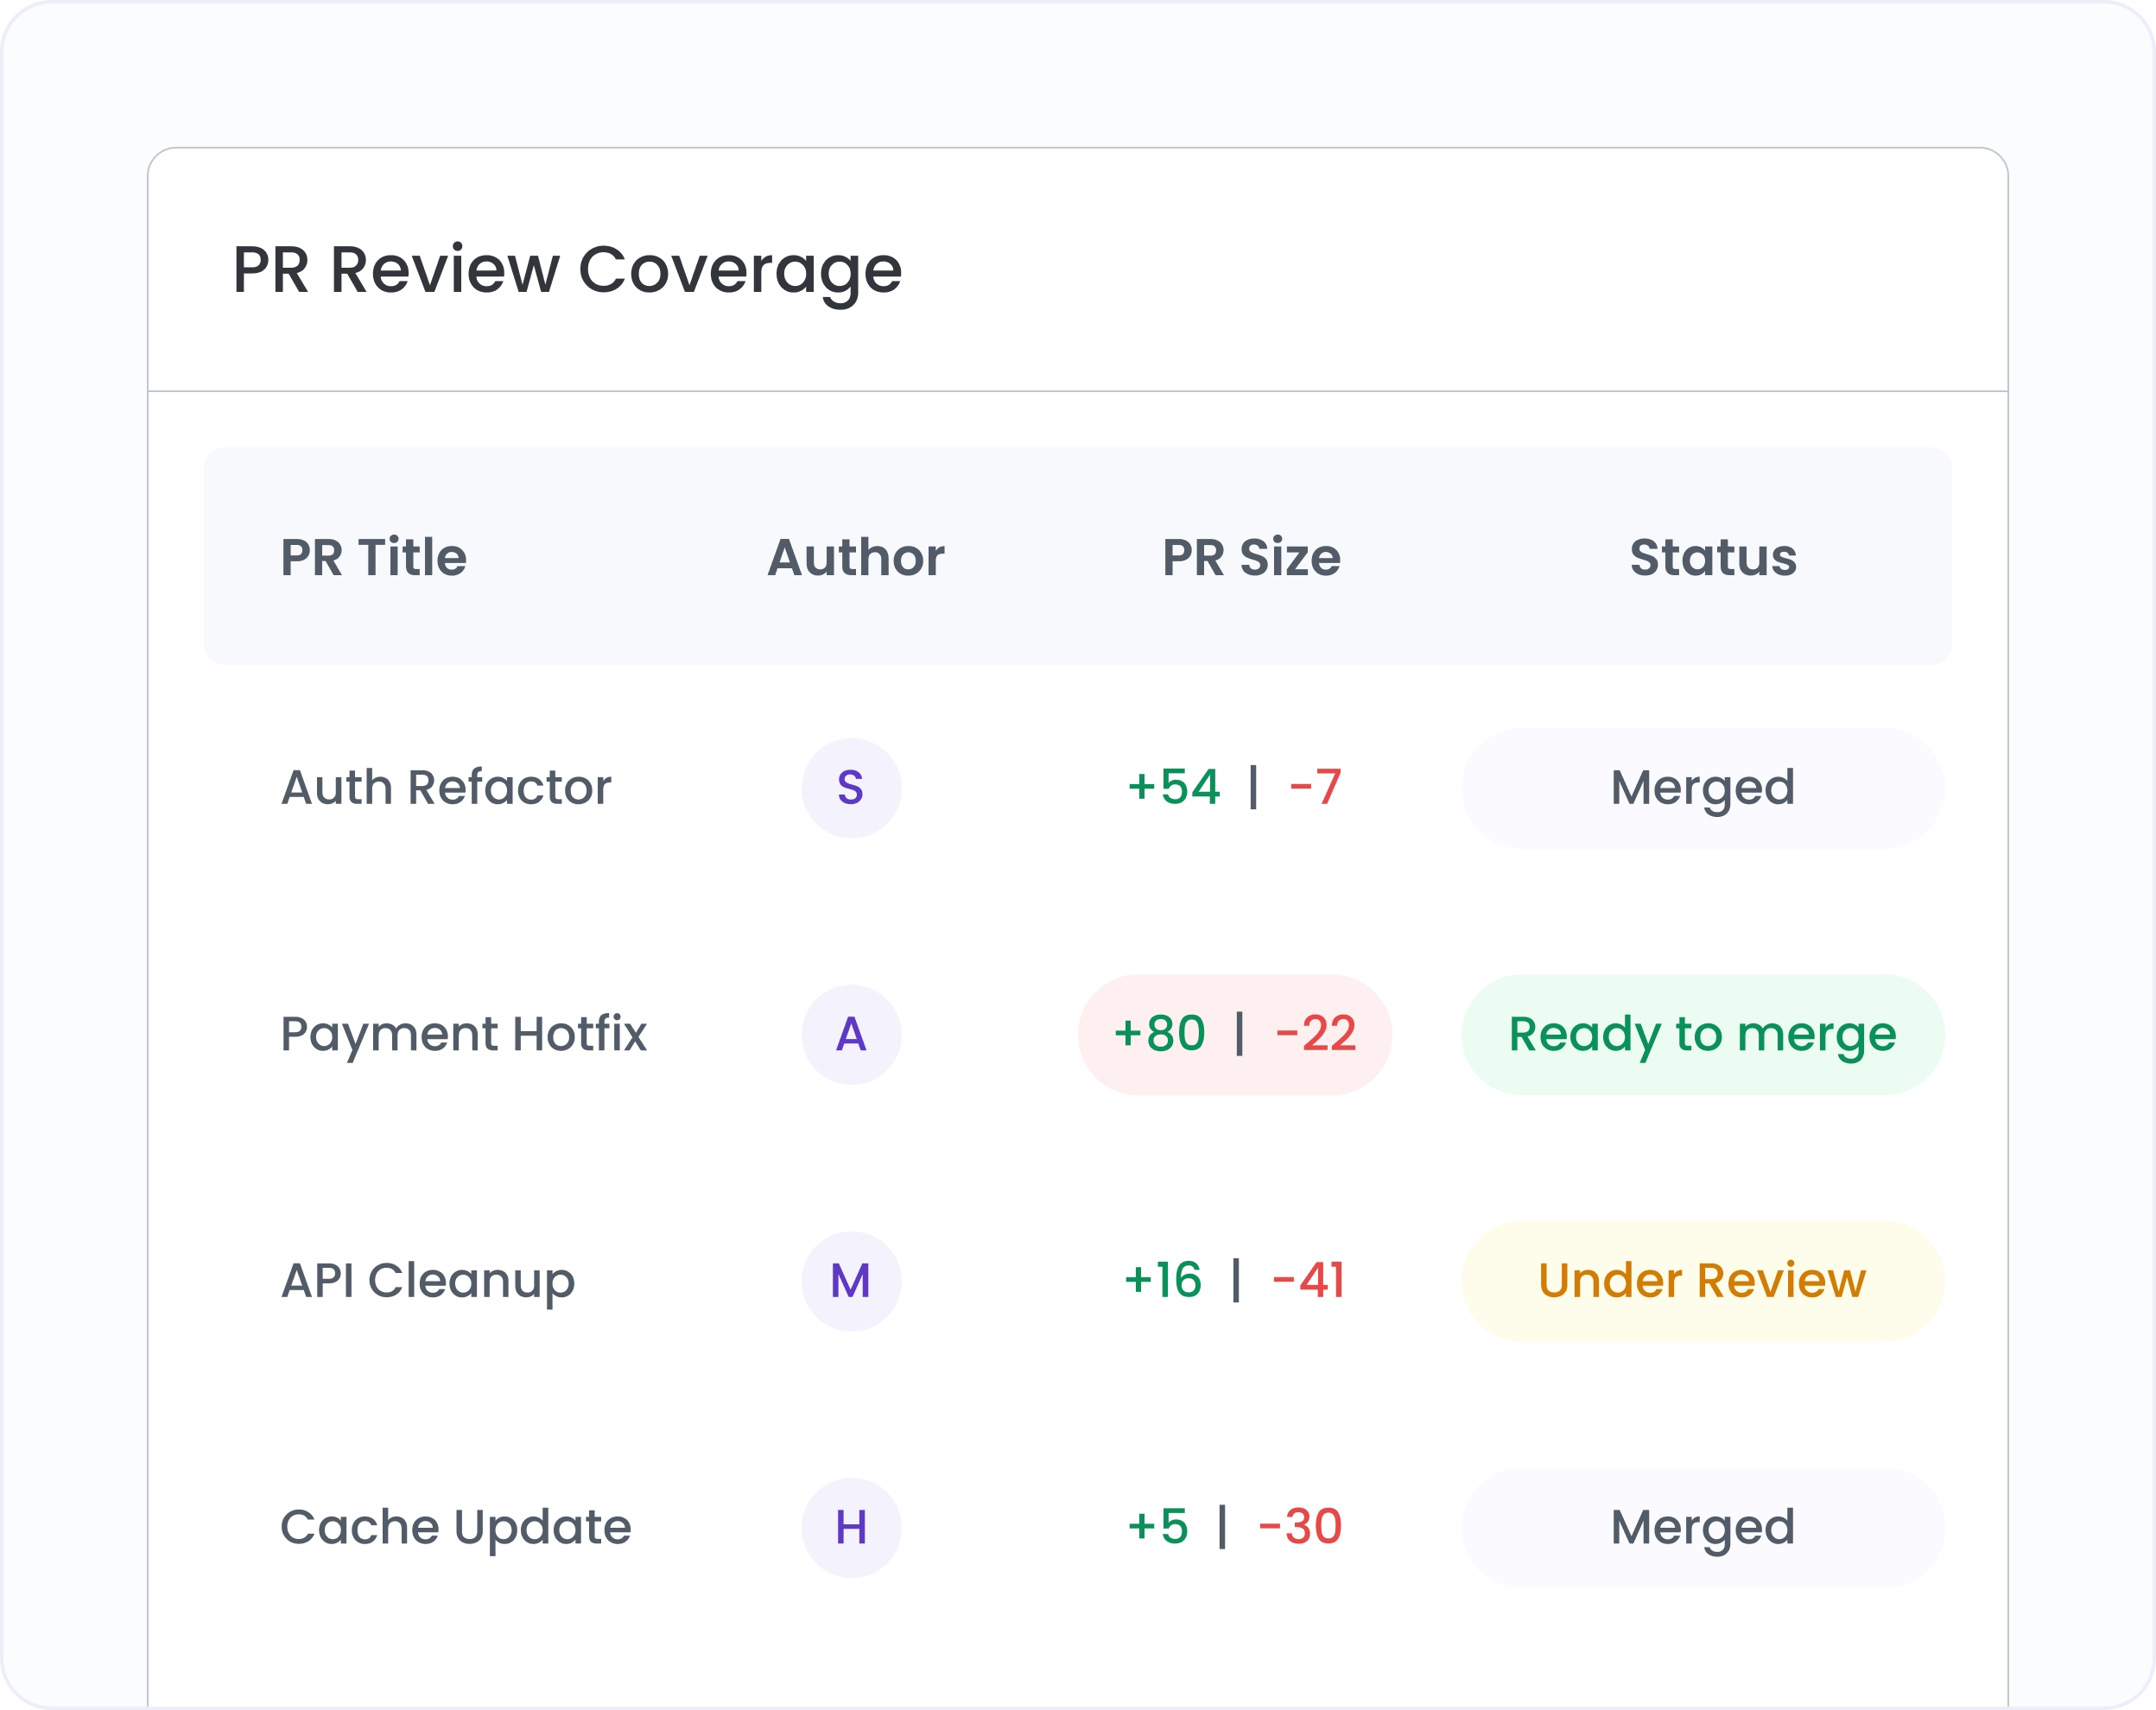
Surface PR size distribution, review coverage, and unreviewed merge rates across every team. Teams where large PRs are merging without adequate review become visible before they produce an incident.
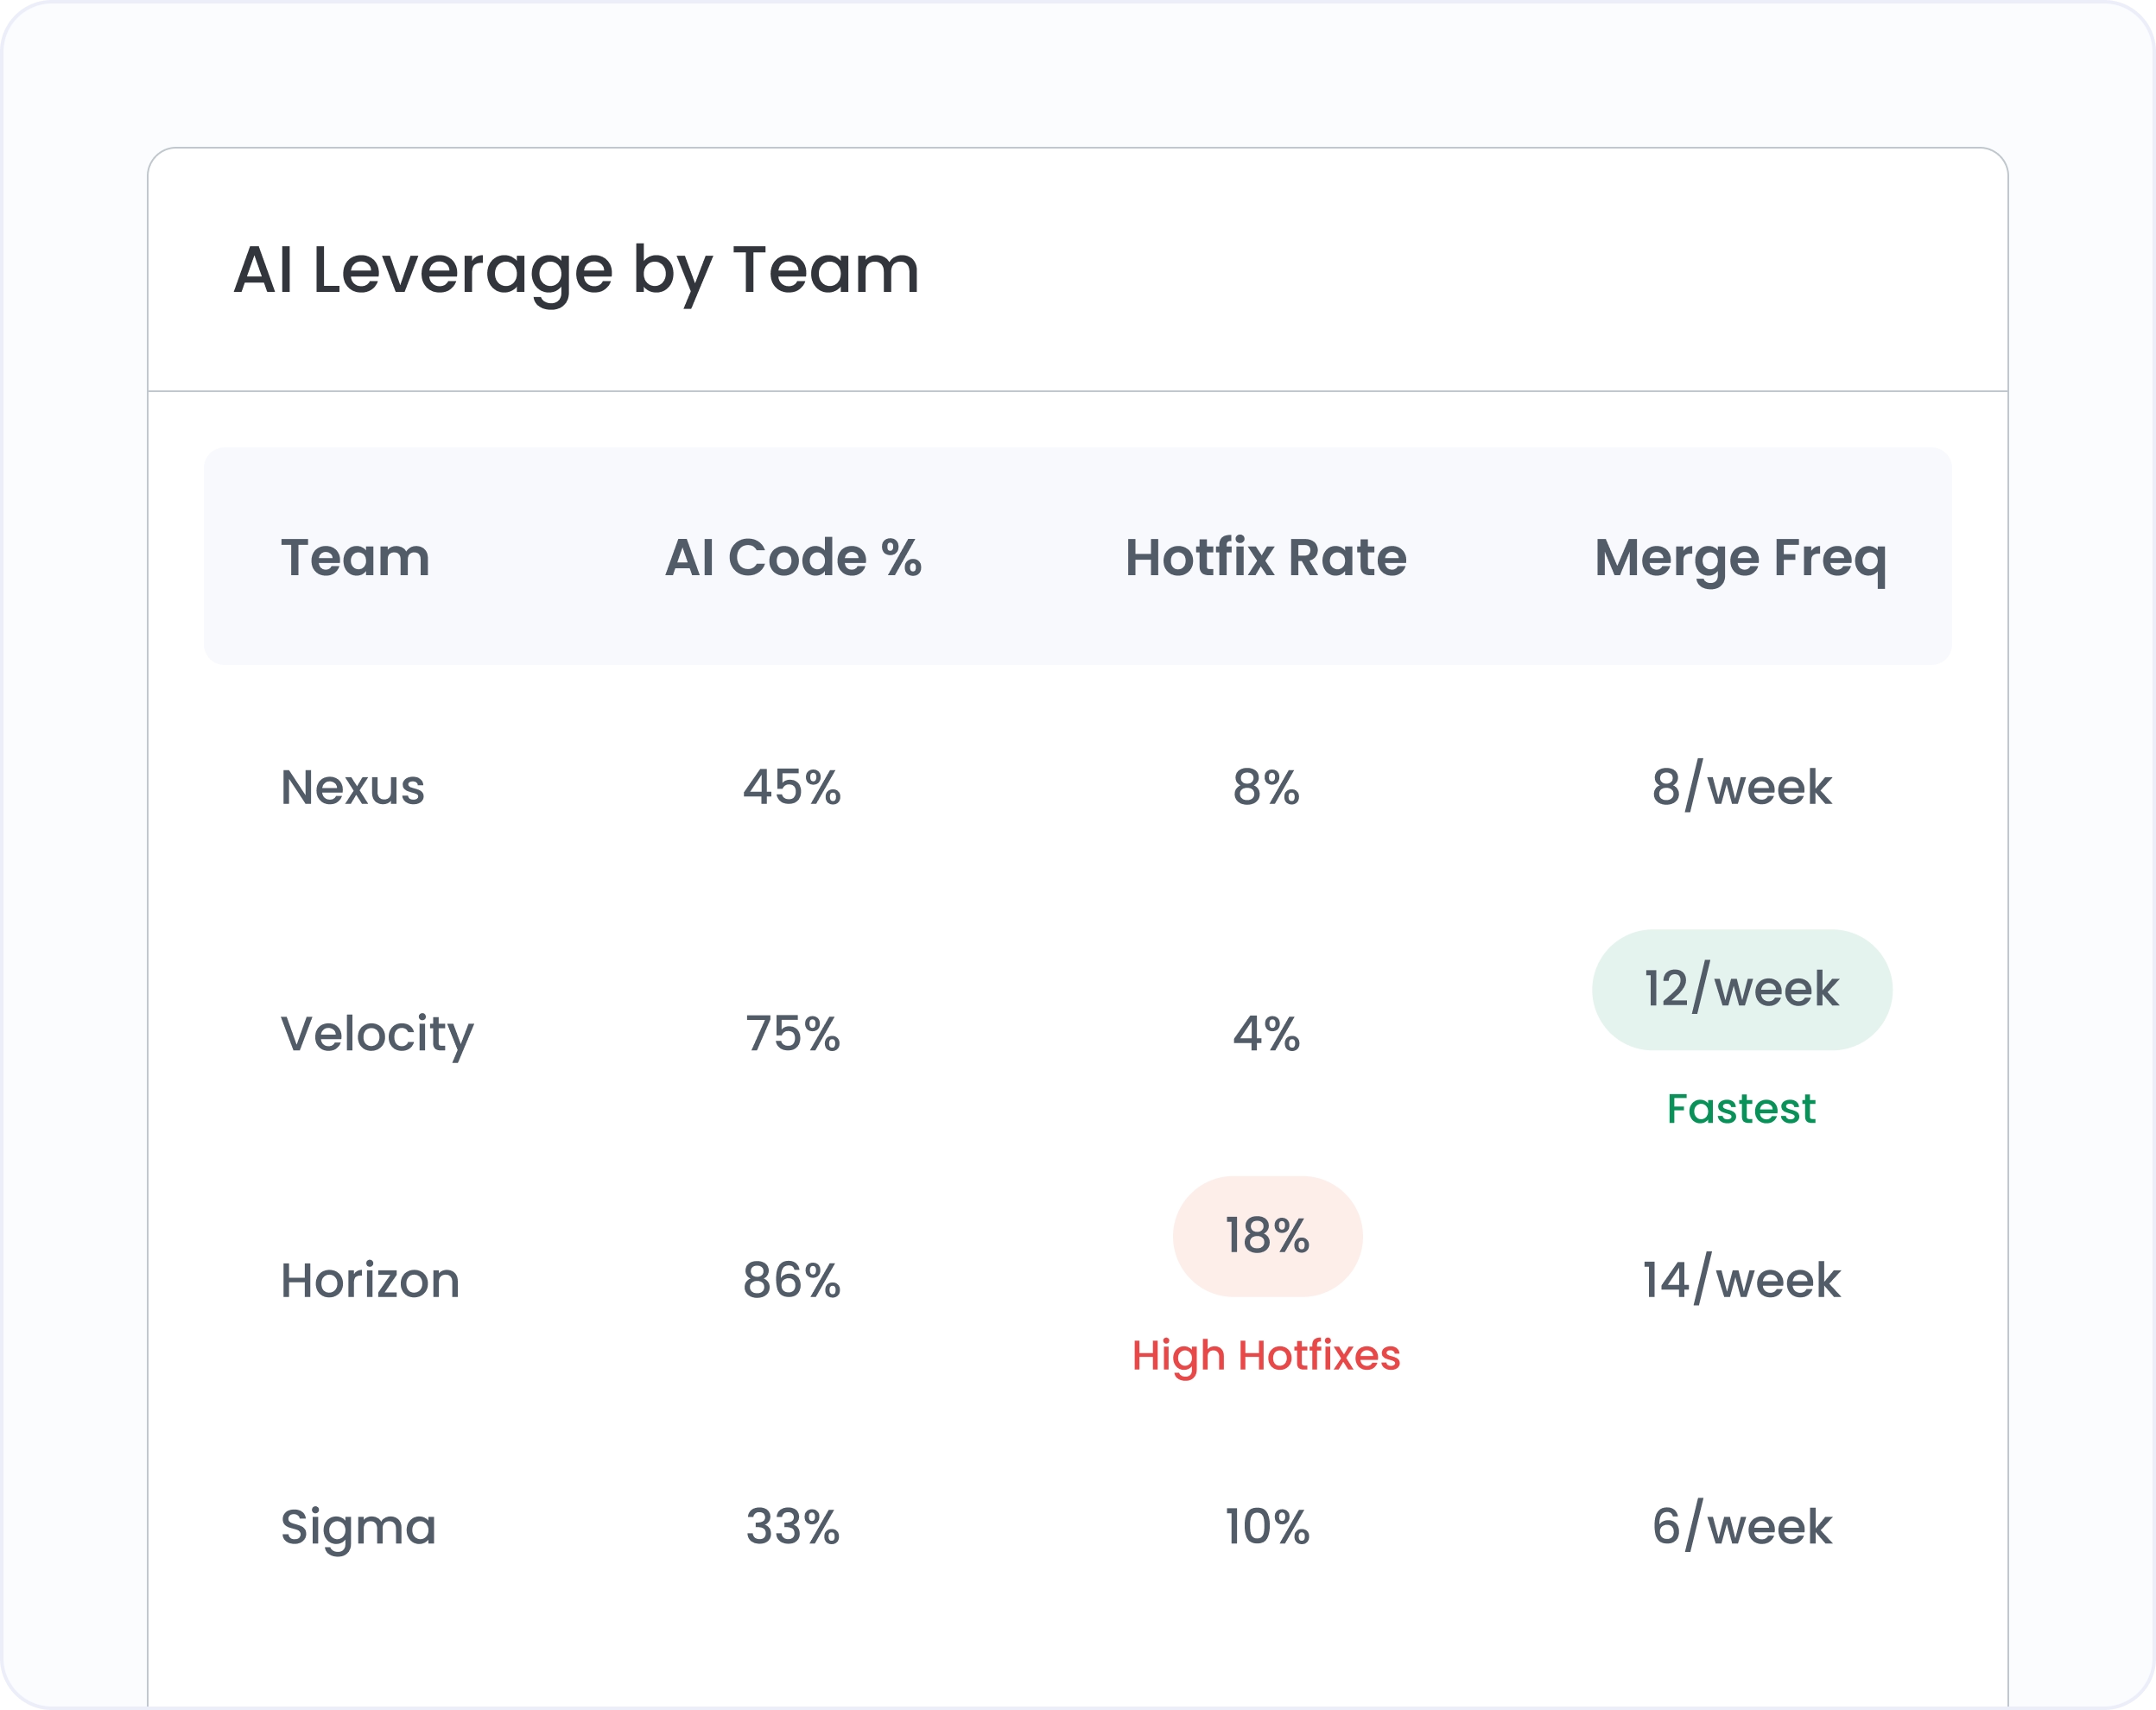
Compare teams by AI code percentage alongside release velocity, hotfix rate, and merge frequency. Teams where high AI usage correlates with better outcomes make the case for pushing adoption elsewhere.

Yes. The org health score, pipeline view, and PR quality views all support cross-team visibility in a single screen. Filter to specific sub-teams or view all at once. No separate dashboards per team required.
The score is a weighted composite of Speed, Quality, and Throughput across your org. You configure the relative weight of each category to match your current priorities, so a team optimizing for quality isn't penalized by a speed-heavy default. Team rankings reflect your weighting.
Engineering activity data (commits, PRs, pipeline timings) updates in near real time as events are processed from your source control integrations. Most views reflect activity within hours of it occurring.


.svg)
.png)