Get the full picture on your AI adoption and impact.
We'll show you exactly how AI is impacting your speed and code quality.
NO CODE ACCESS
FREE AI ROI REPORT
NO CREDIT CARD
4.7/5


We'll show you exactly how AI is impacting your speed and code quality.
Hivel gives CTOs one view of engineering spend, AI tool effectiveness, delivery health, and quarter-over-quarter improvement. Walk into every board conversation with evidence, not estimation.
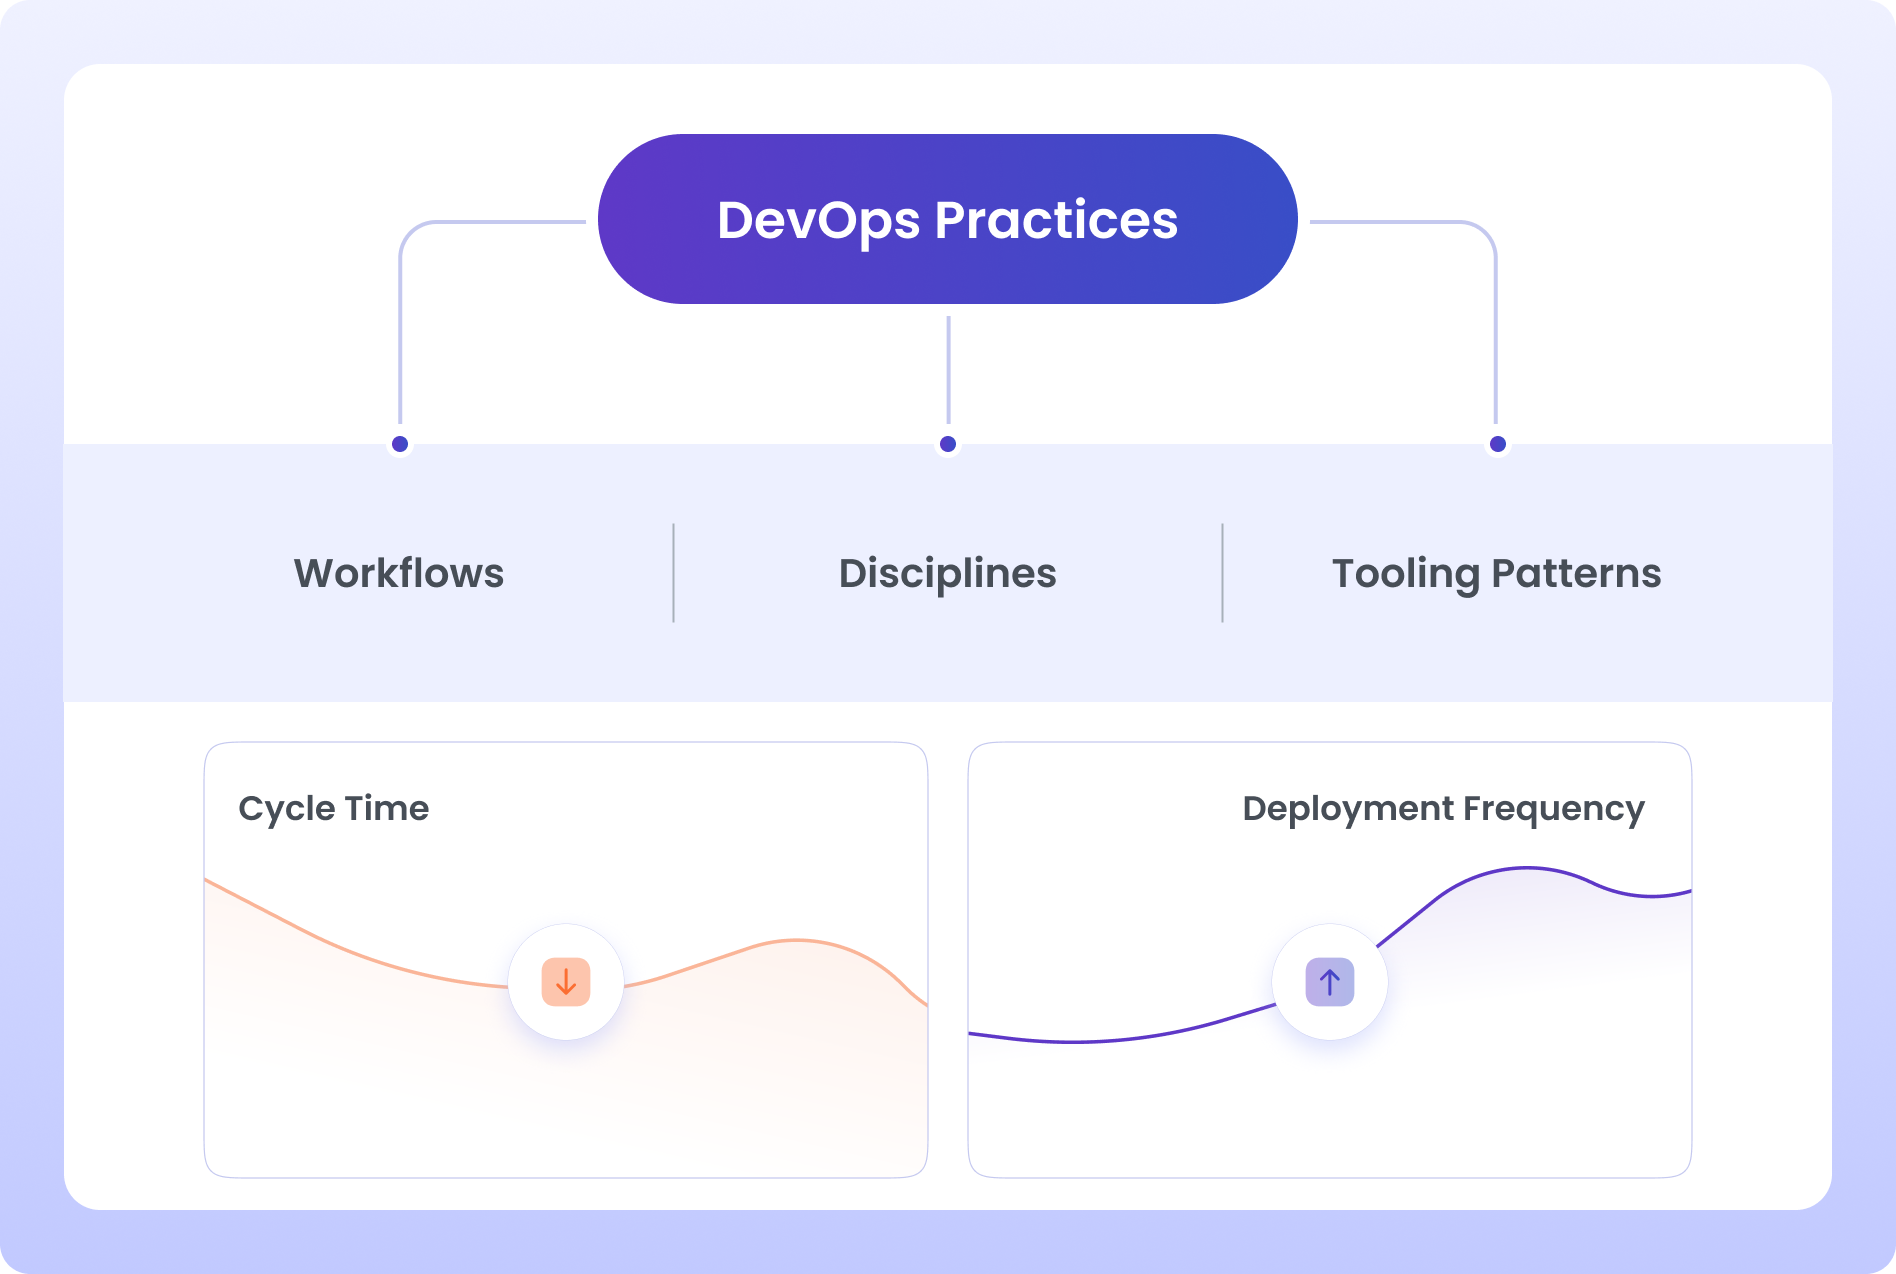
The board used to ask about cost and release timing. Now they ask about AI ROI, investment outcomes, and quarter-over-quarter improvement. Most CTOs answer with instinct and spreadsheets. The gap is widening every cycle.
Total engineering cost is known. What went to the rewrite, what went to platform stability, what went to unplanned work: none of it is visible without building the picture by hand.
Copilot and Cursor subscriptions are line items. Whether those tools are improving delivery, reducing rework, or accelerating outcomes doesn't exist in one place. Vendors won't provide it.
"AI is making our team more productive" is what CTOs say in board reviews. The number behind that claim, the one that survives a CFO's follow-up, rarely exists.
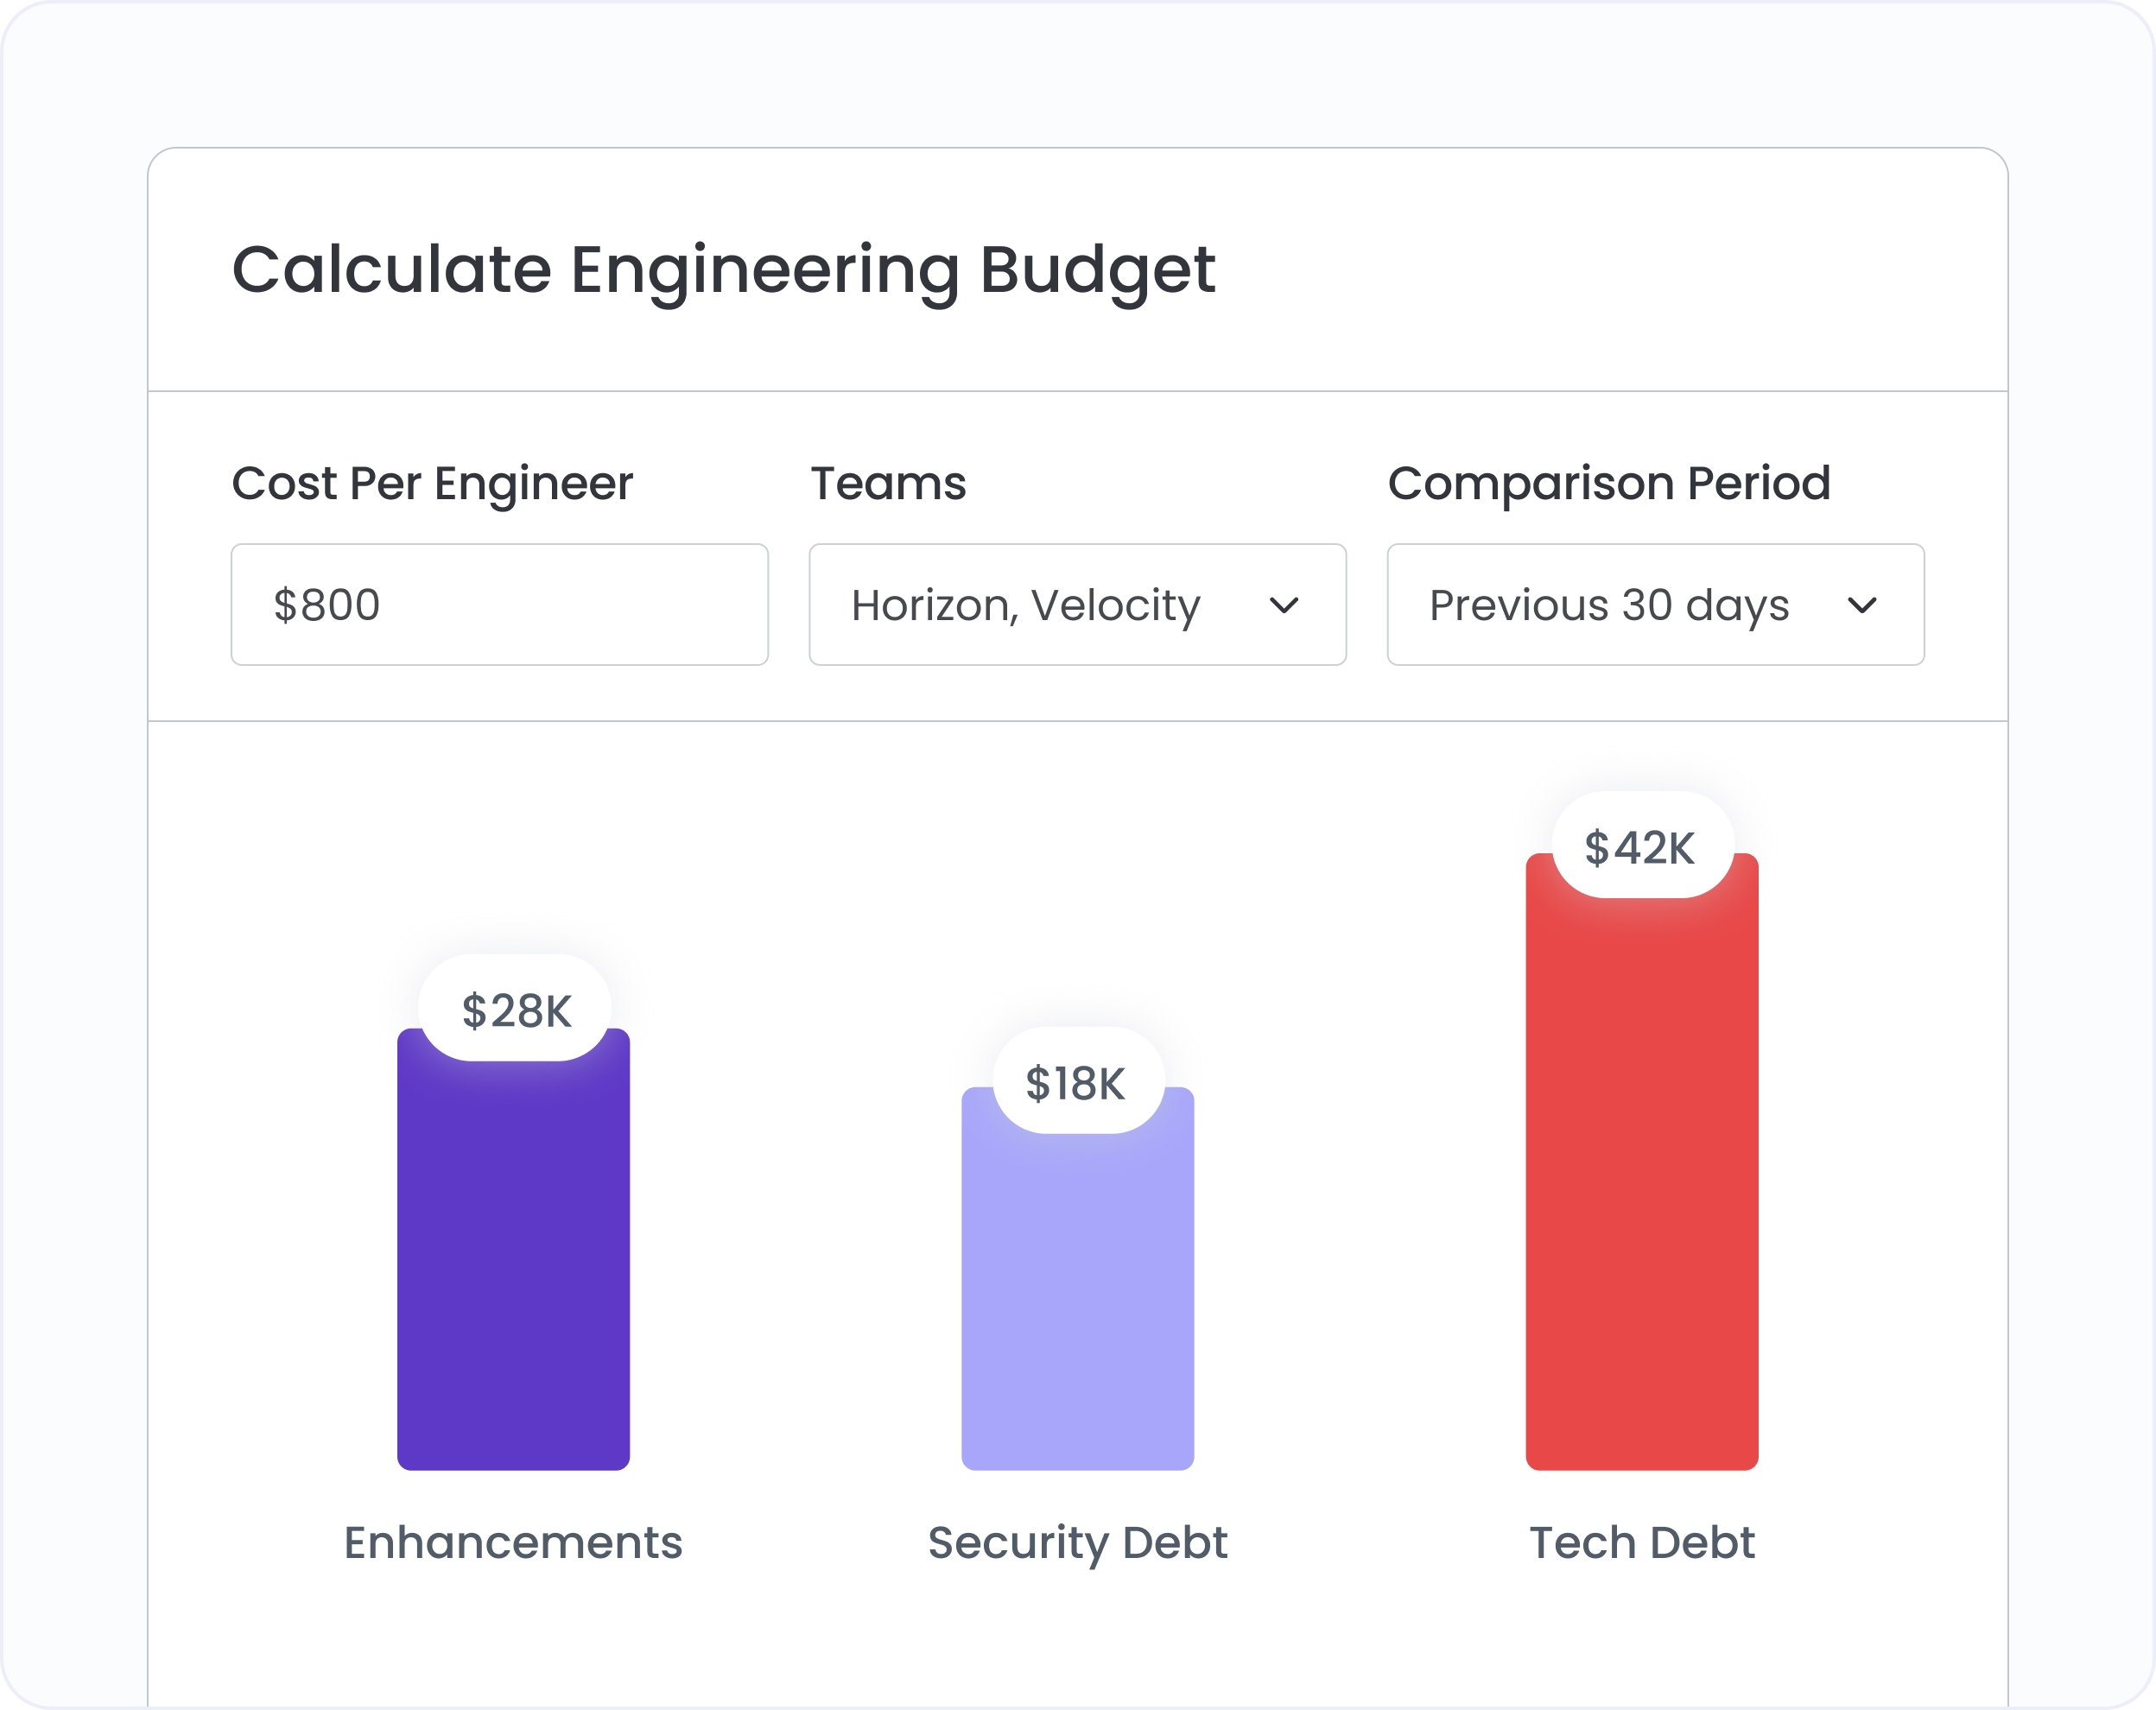
Know exactly where engineering budget went, calculated from actual effort data, not timesheets or manual allocation. Walk into the CFO conversation with initiative-level cost data, already built.
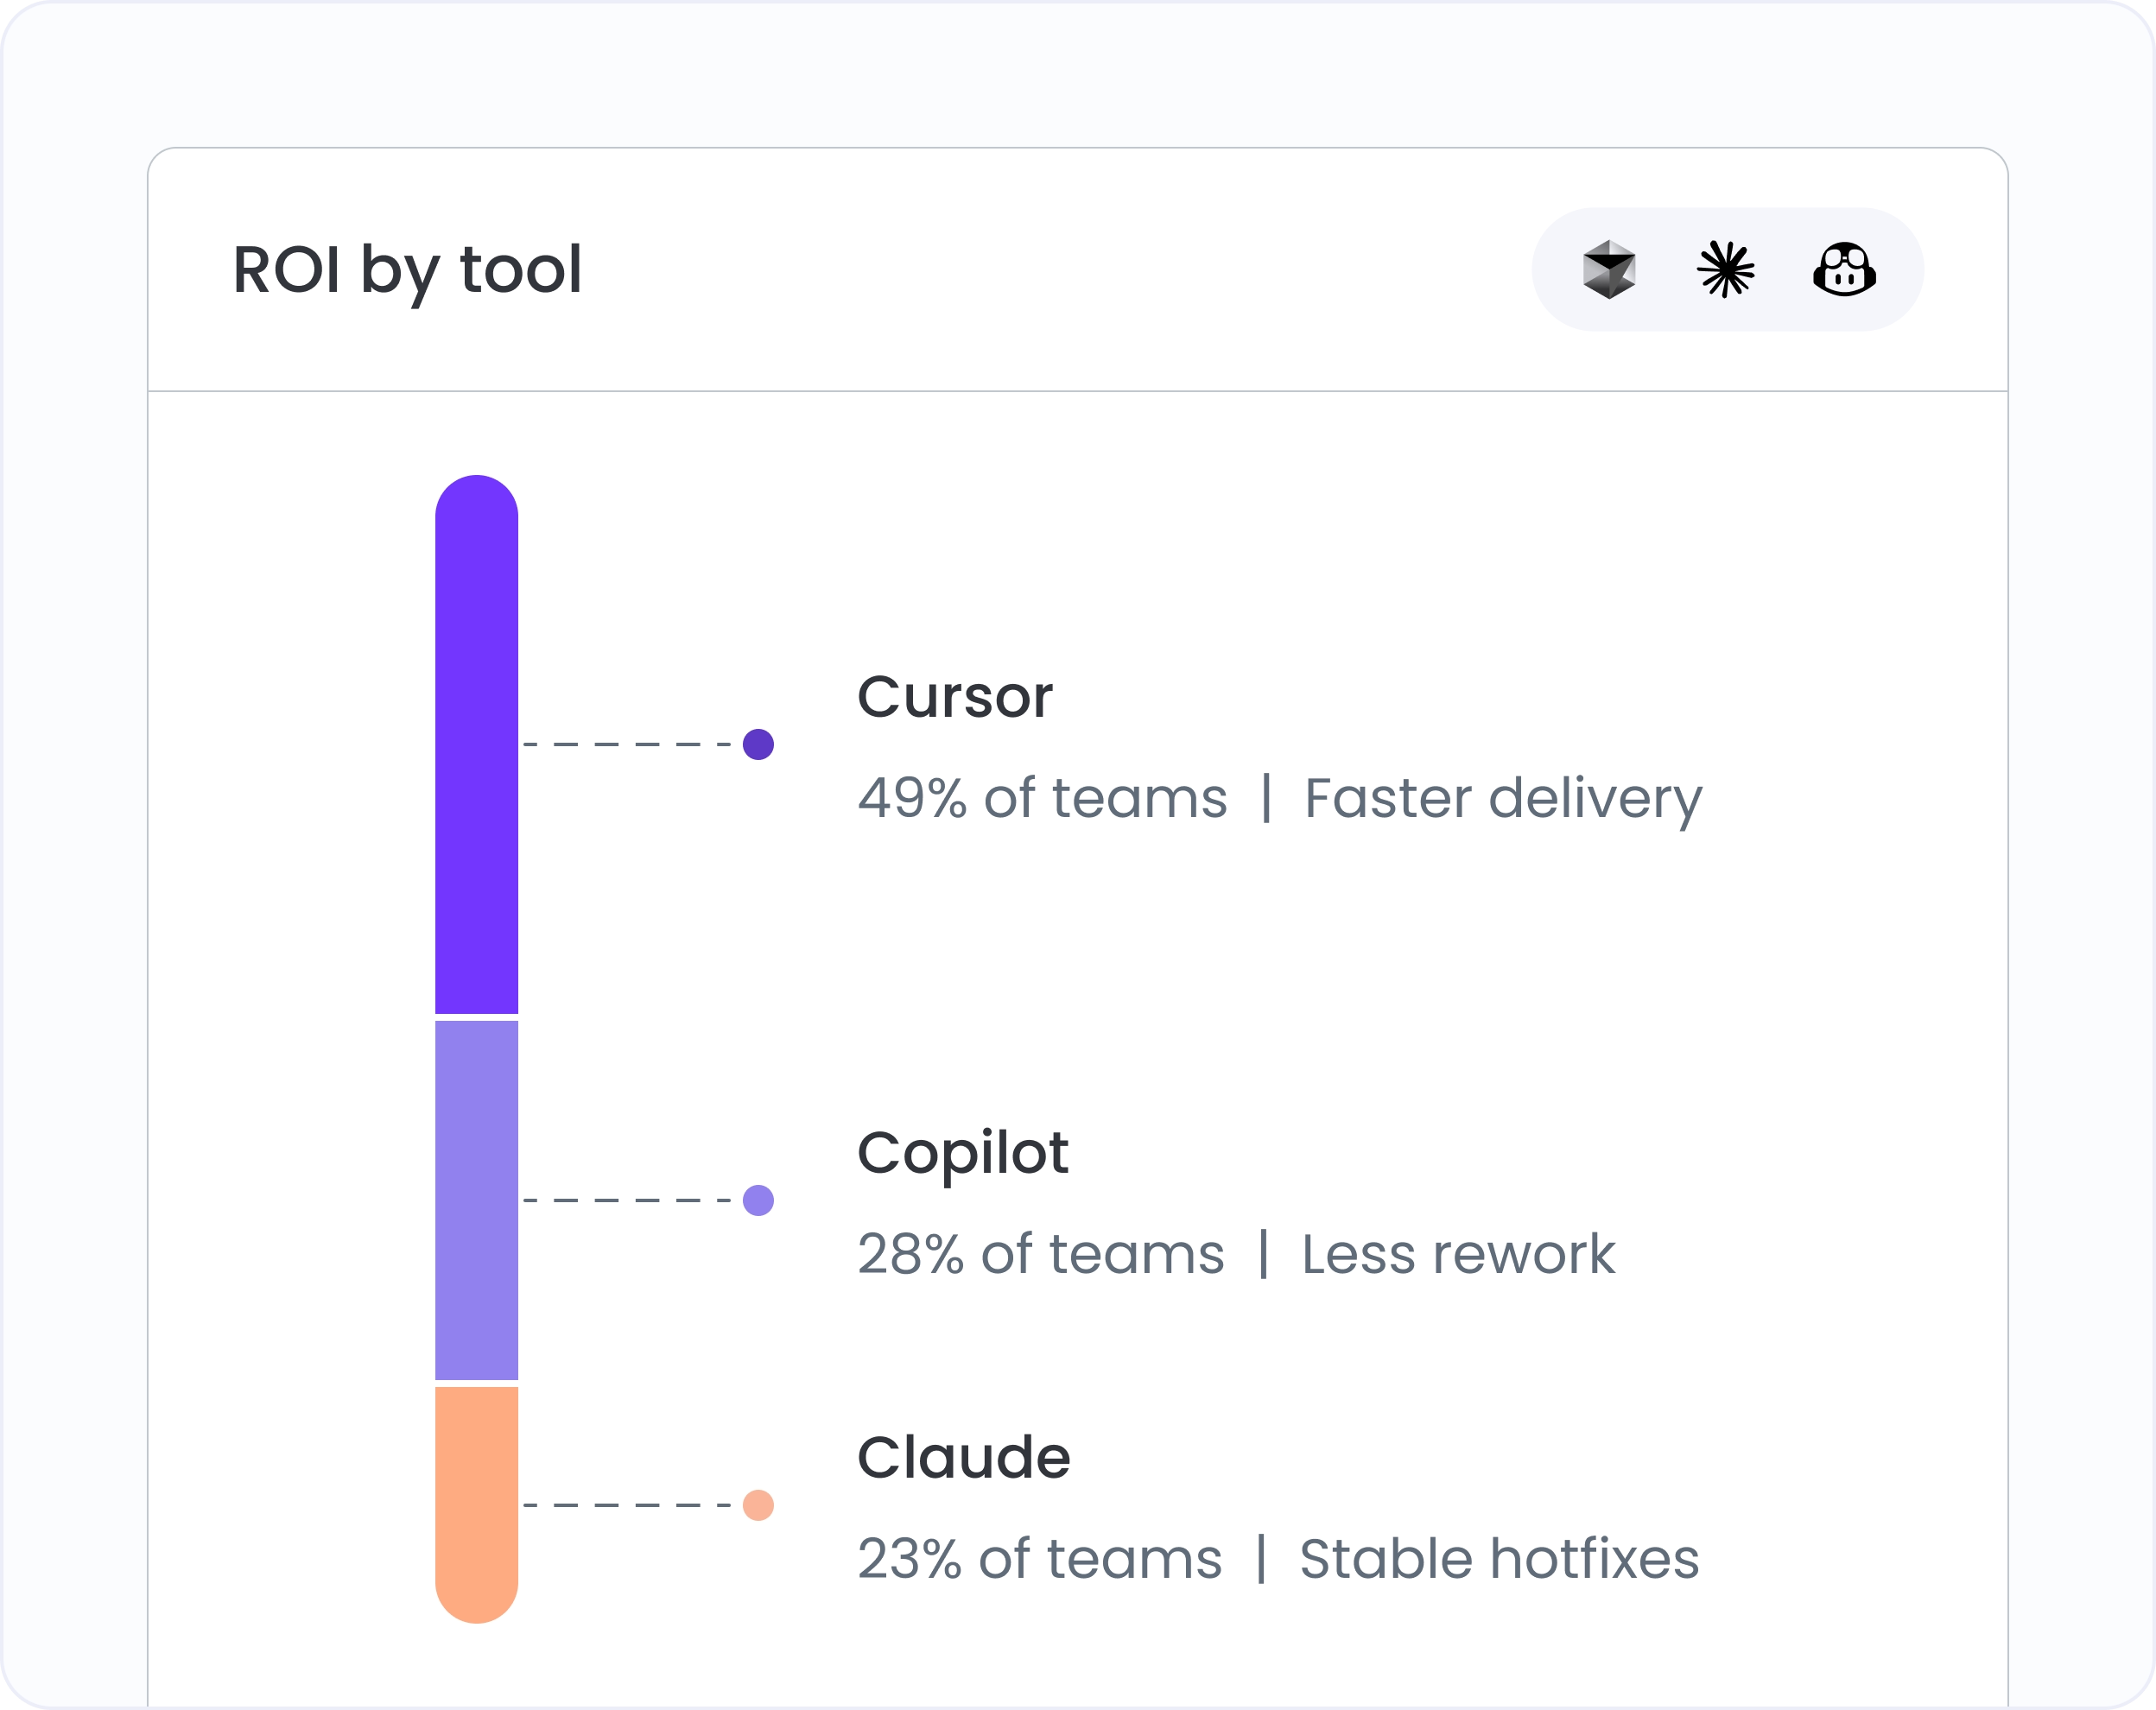
Measure whether AI tools are improving cycle time, reducing rework, and lifting delivery frequency. Compare across tools and teams, not just adoption counts.
Track whether releases ship on time, sprint by sprint. Spot the epics that keep slipping before the board asks why.
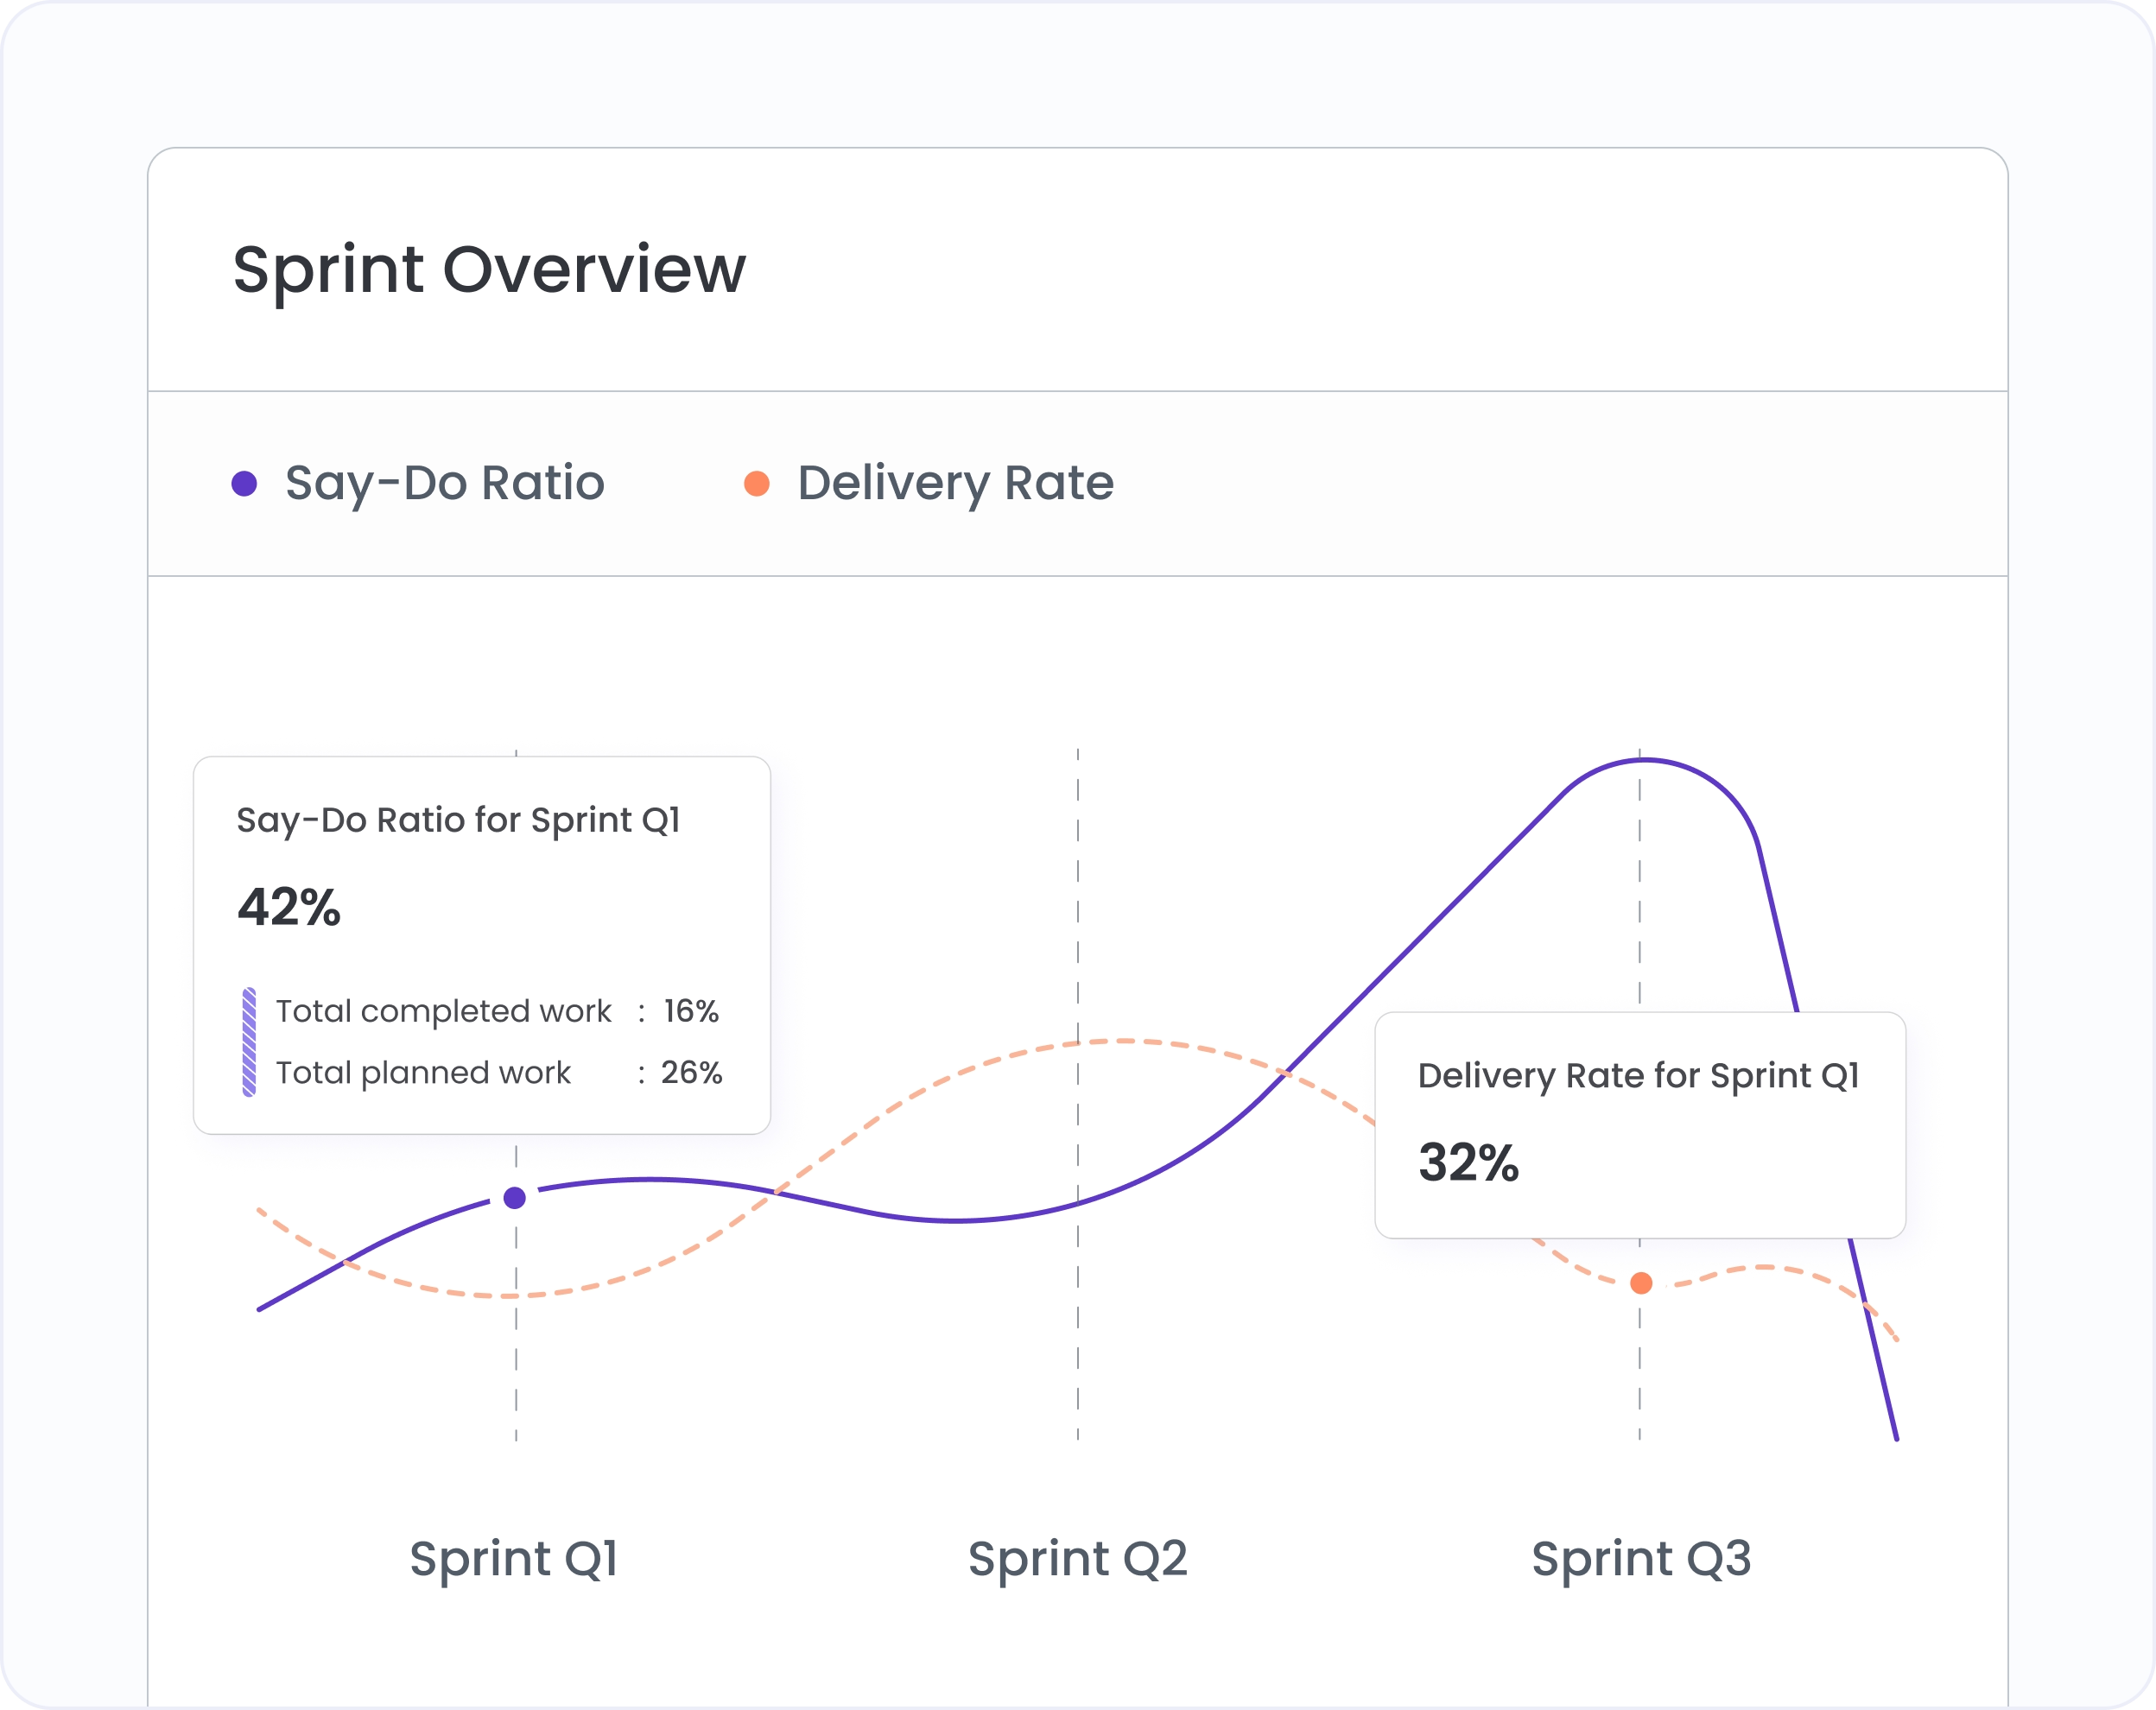
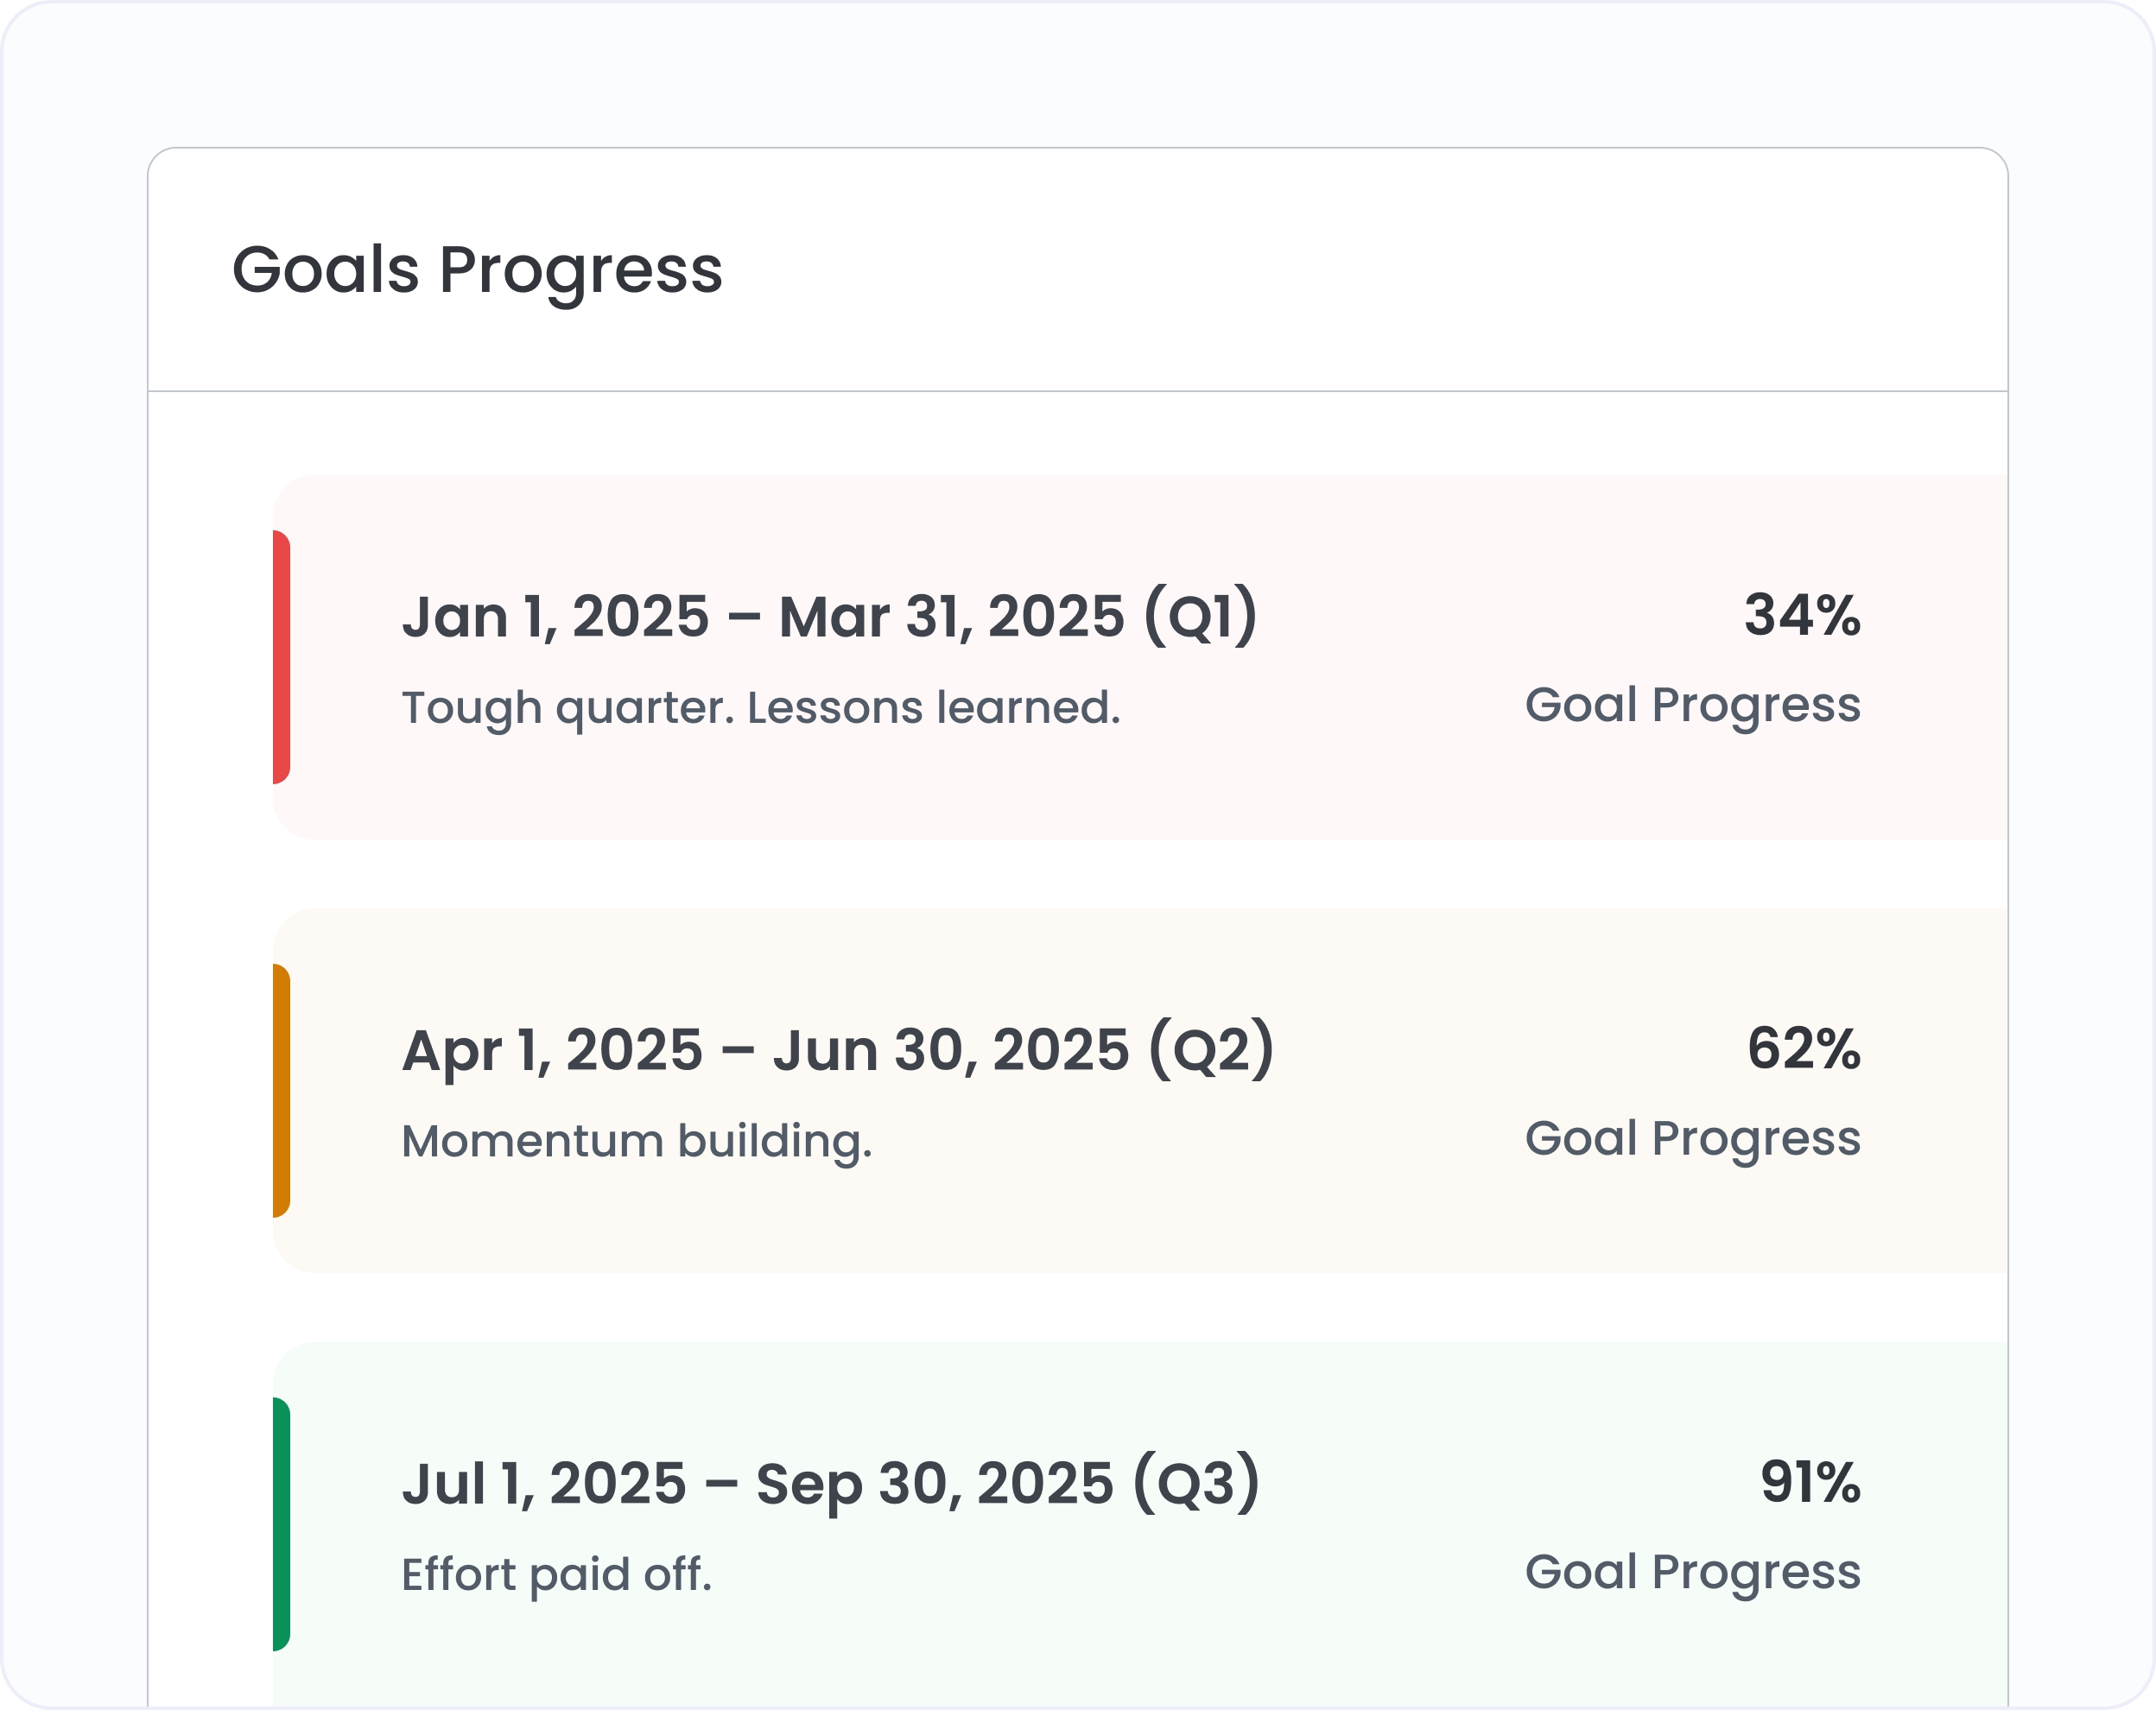
Show the board a quarter-by-quarter record of what was targeted, what was hit, and whether engineering performance is trending in the right direction.

Hivel calculates Team Capacity Equivalent: the share of each team's monthly capacity consumed by each initiative, based on story points delivered. That percentage is applied to each team's configured monthly cost to produce a dollar figure per initiative. Real story point data, not time estimates.
Yes. The AI impact view lets you switch between connected AI tools and see adoption depth, AI code percentage, and delivery metrics per team for each tool. See which tools are producing outcomes, not just usage.
Hivel augments it. Data is updated automatically from your source control and project management tools. The spreadsheet built before every board review gets replaced with a live view that's always current.


.svg)
.png)