The SURGE FRAMEWORK

You pay for every AI seat. Find out who's actually using them.

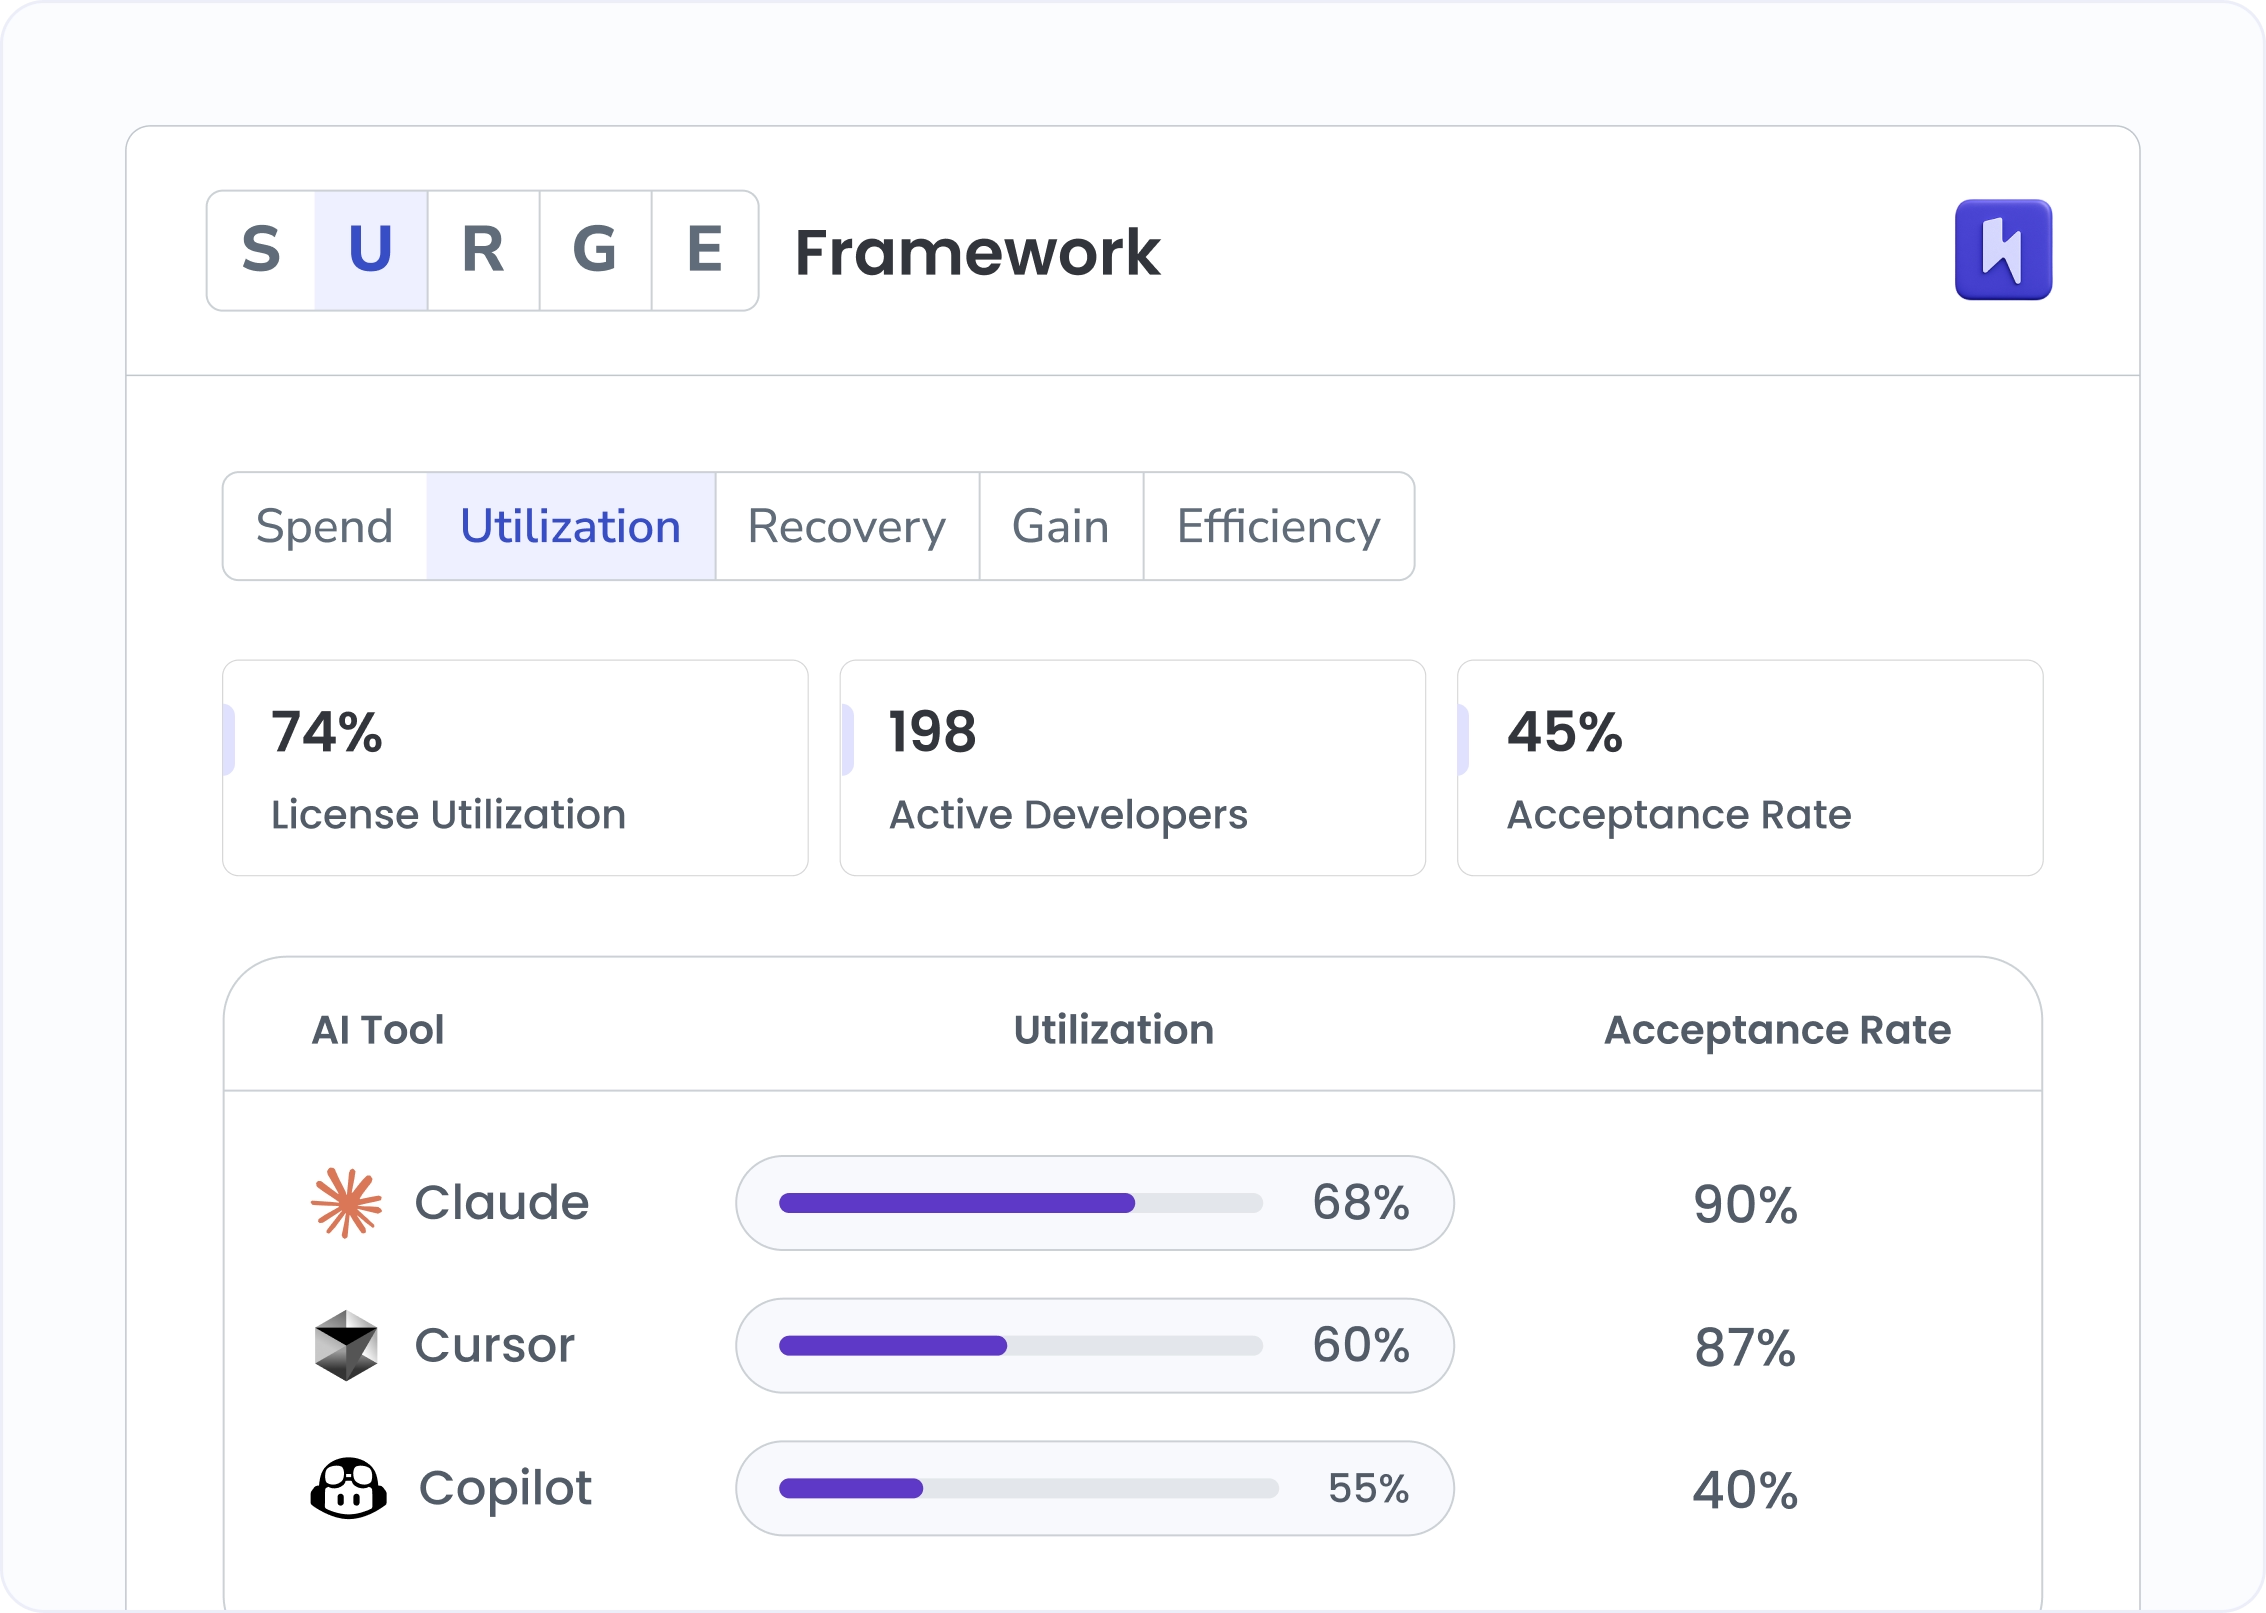
Utilization shows license optimal usage, active developers, adoption rate, and acceptance rate across all your AI coding tools. Plus model-level usage. See which seats earn their cost and which sit idle.

The problem

AI license counts grew. Real adoption stayed at a fraction of that.

The gap between "licensed" and "productive" is where most AI budget disappears. Procurement bought seats for the team. Some percent get used. Of those, half generate suggestions nobody accepts and a smaller fraction reaches a merged PR.

License counts don't equal active users

A seat assigned in admin is not the same as a developer who opens the tool daily. Vendor dashboards count both as one. The cost difference is real.

Acceptance rates hide model misuse

Premium models running routine tasks. Lightweight models on complex work. Acceptance rates fall, costs climb, and the wrong-model usage pattern stays invisible.

Idle seats compound across renewals

Every renewal cycle, finance asks how many seats are needed. Without adoption depth data, the answer defaults to the previous year's count. Idle license cost accumulates quietly.

Four views from license purchased to suggestion accepted.

License utilization

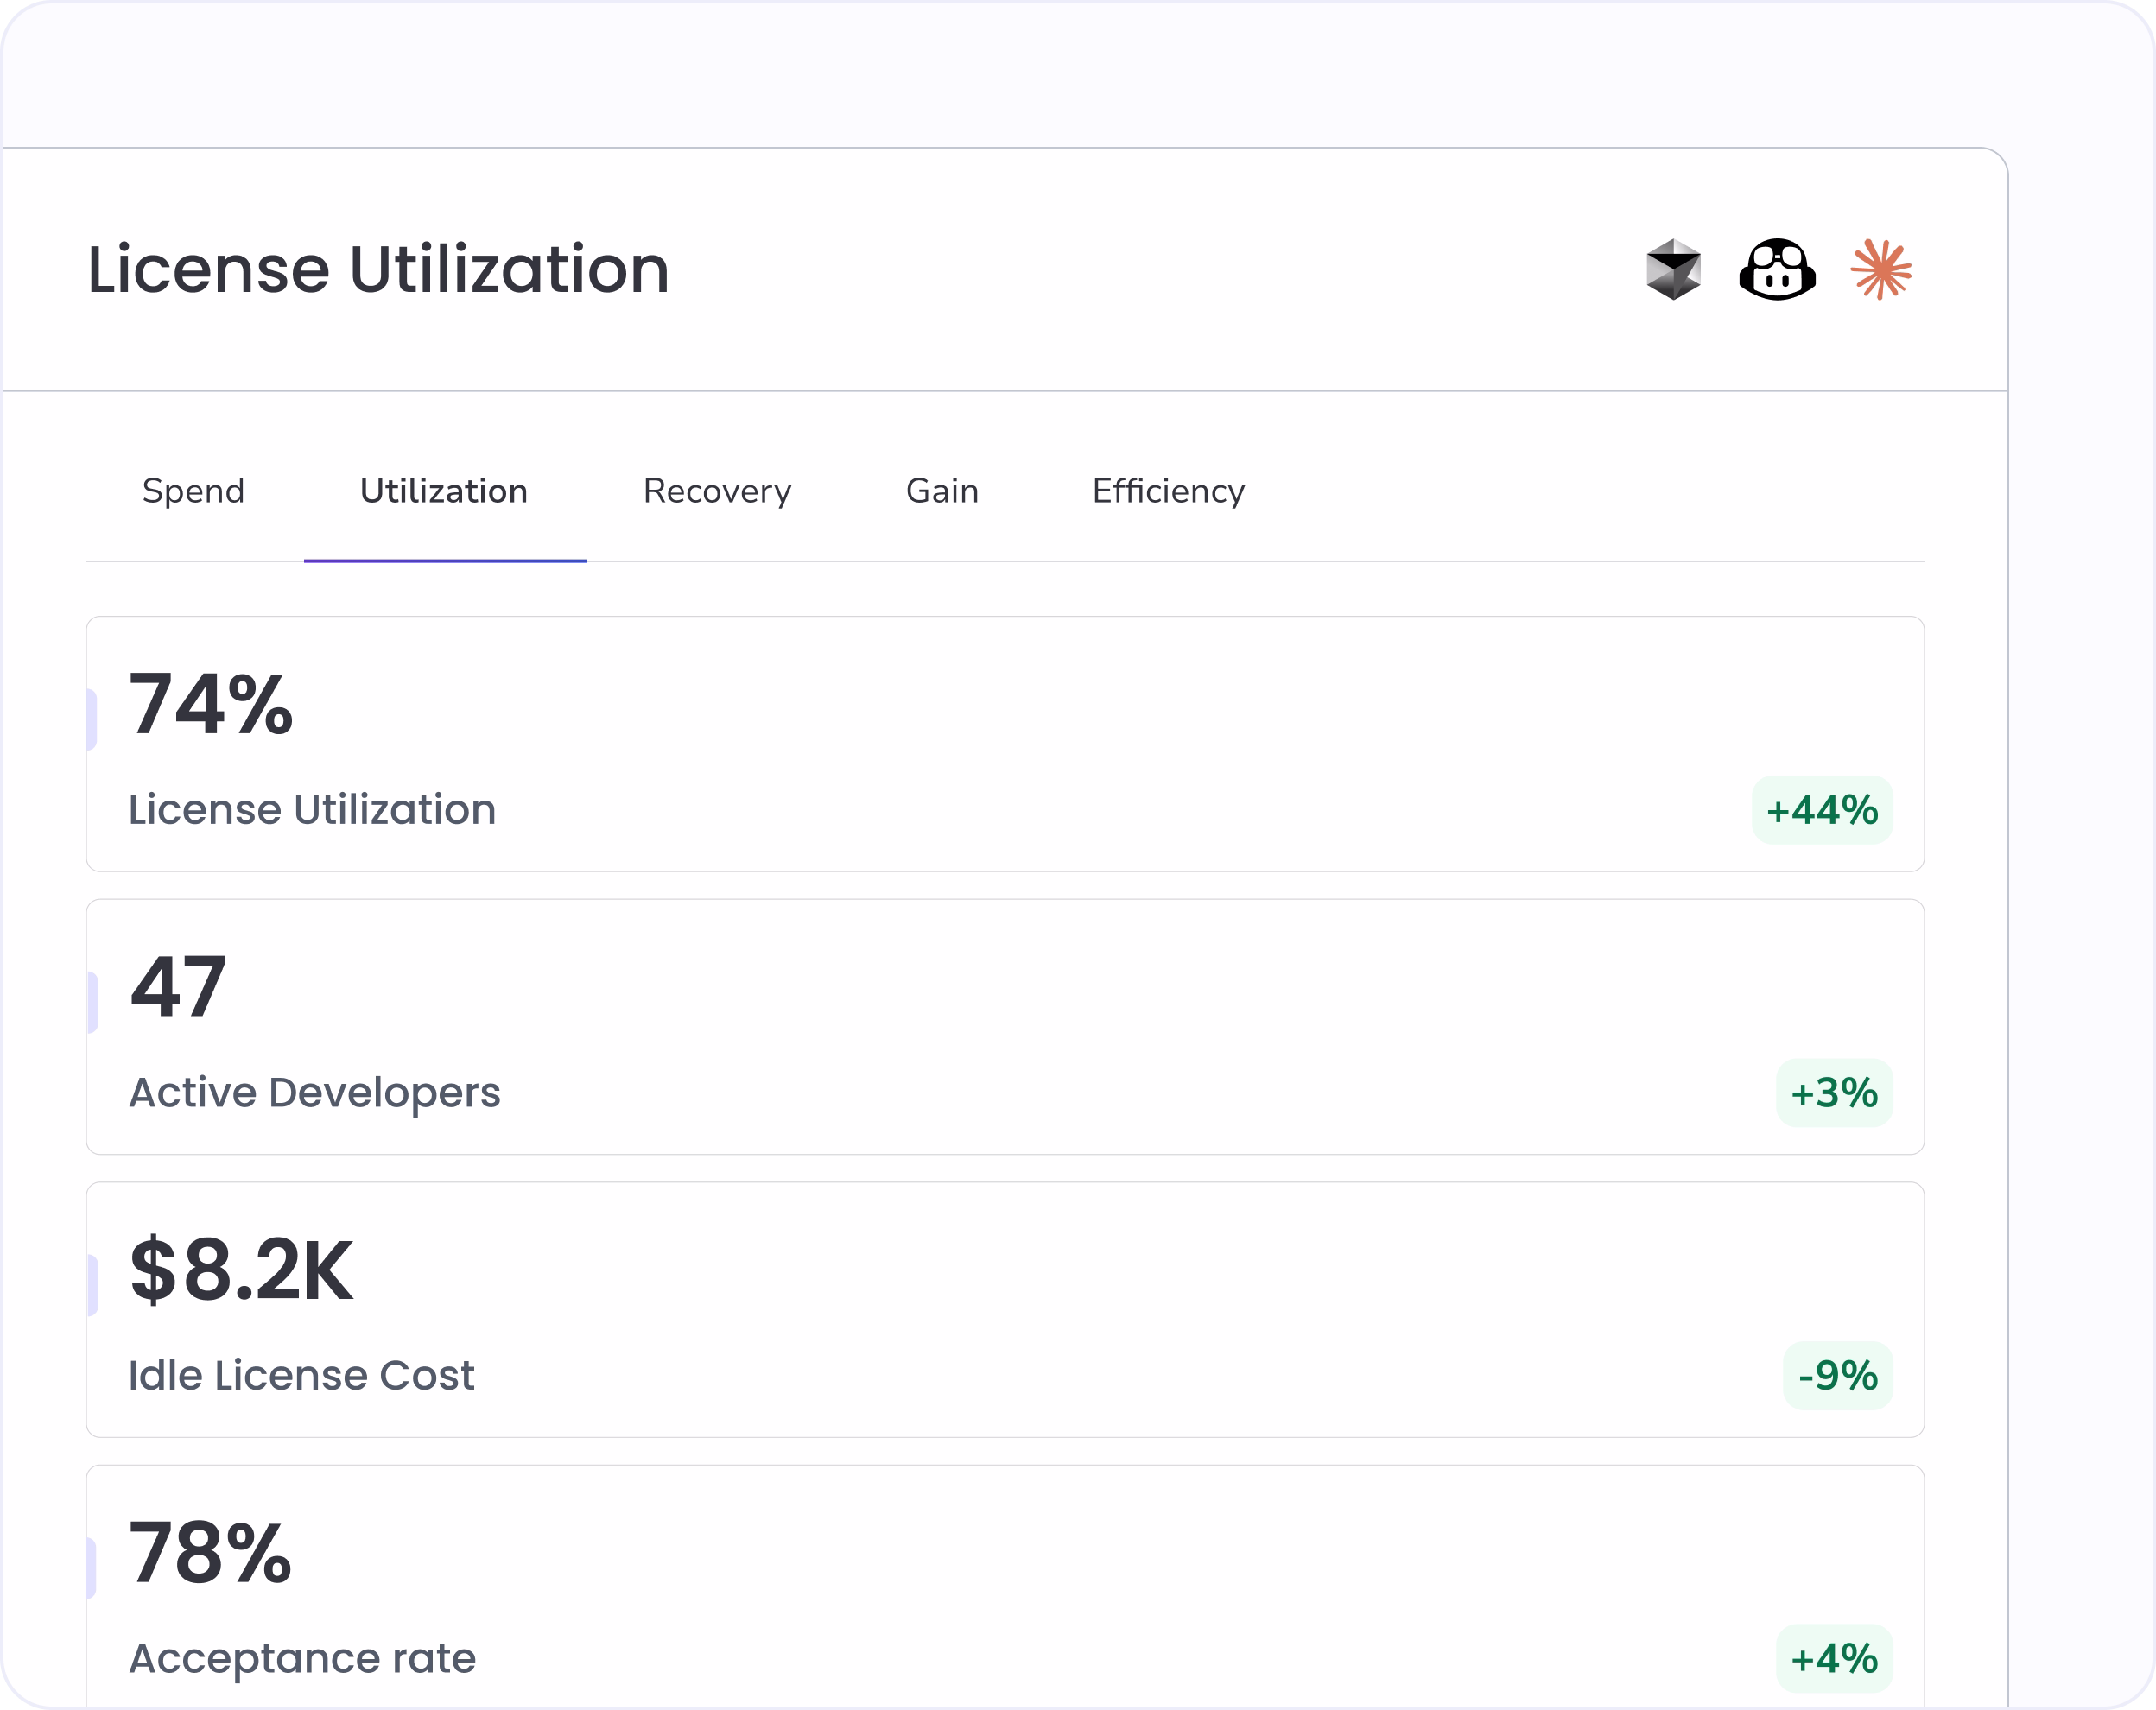
See which AI seats ae earning their cost

Overall license utilization, broken down by tools with active licences. Compare the usage cost and accepatance rate. Idle seat cost surfaced per tool, ready for the renewal conversation.

Adoption Metrics

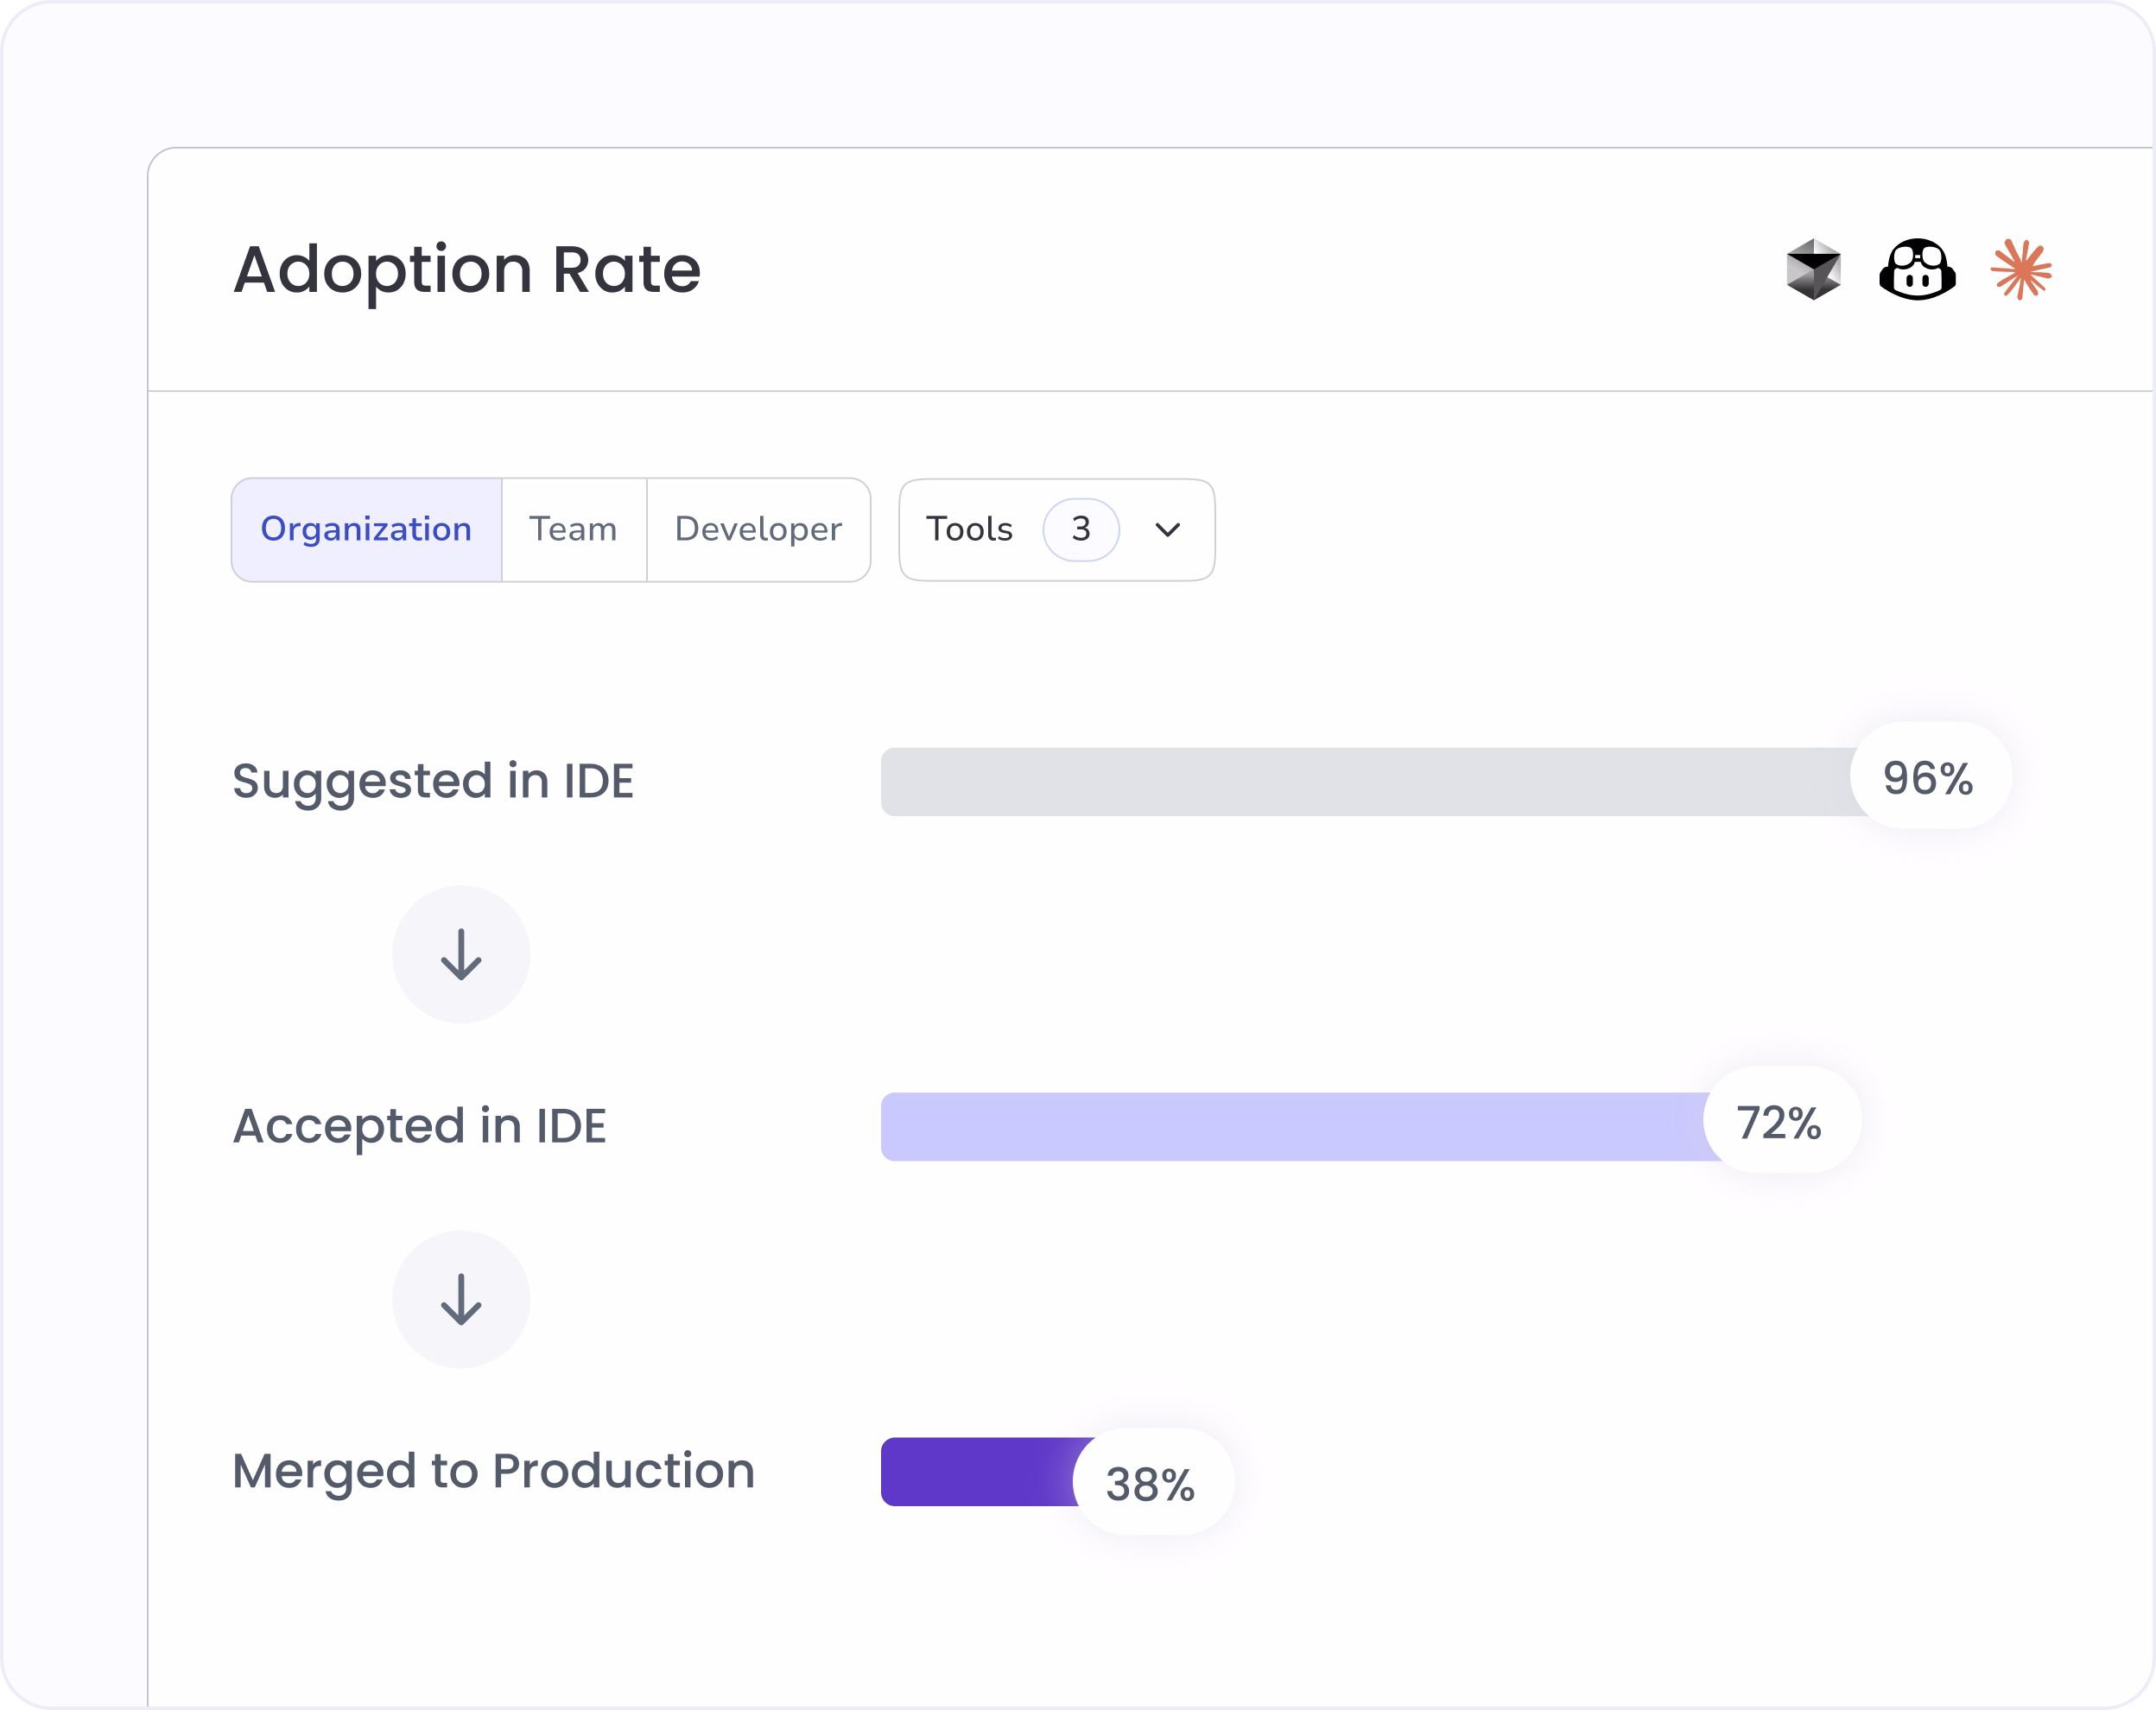
Track adoption depth from organization to individual developer

See your adoption rate org-wide, with the ability to scope every metric by organization, team, or individual developer. Identify which teams successfully pull AI recommendations through to merged code and which experience a drop-off between suggestion and acceptance.

Model Usage

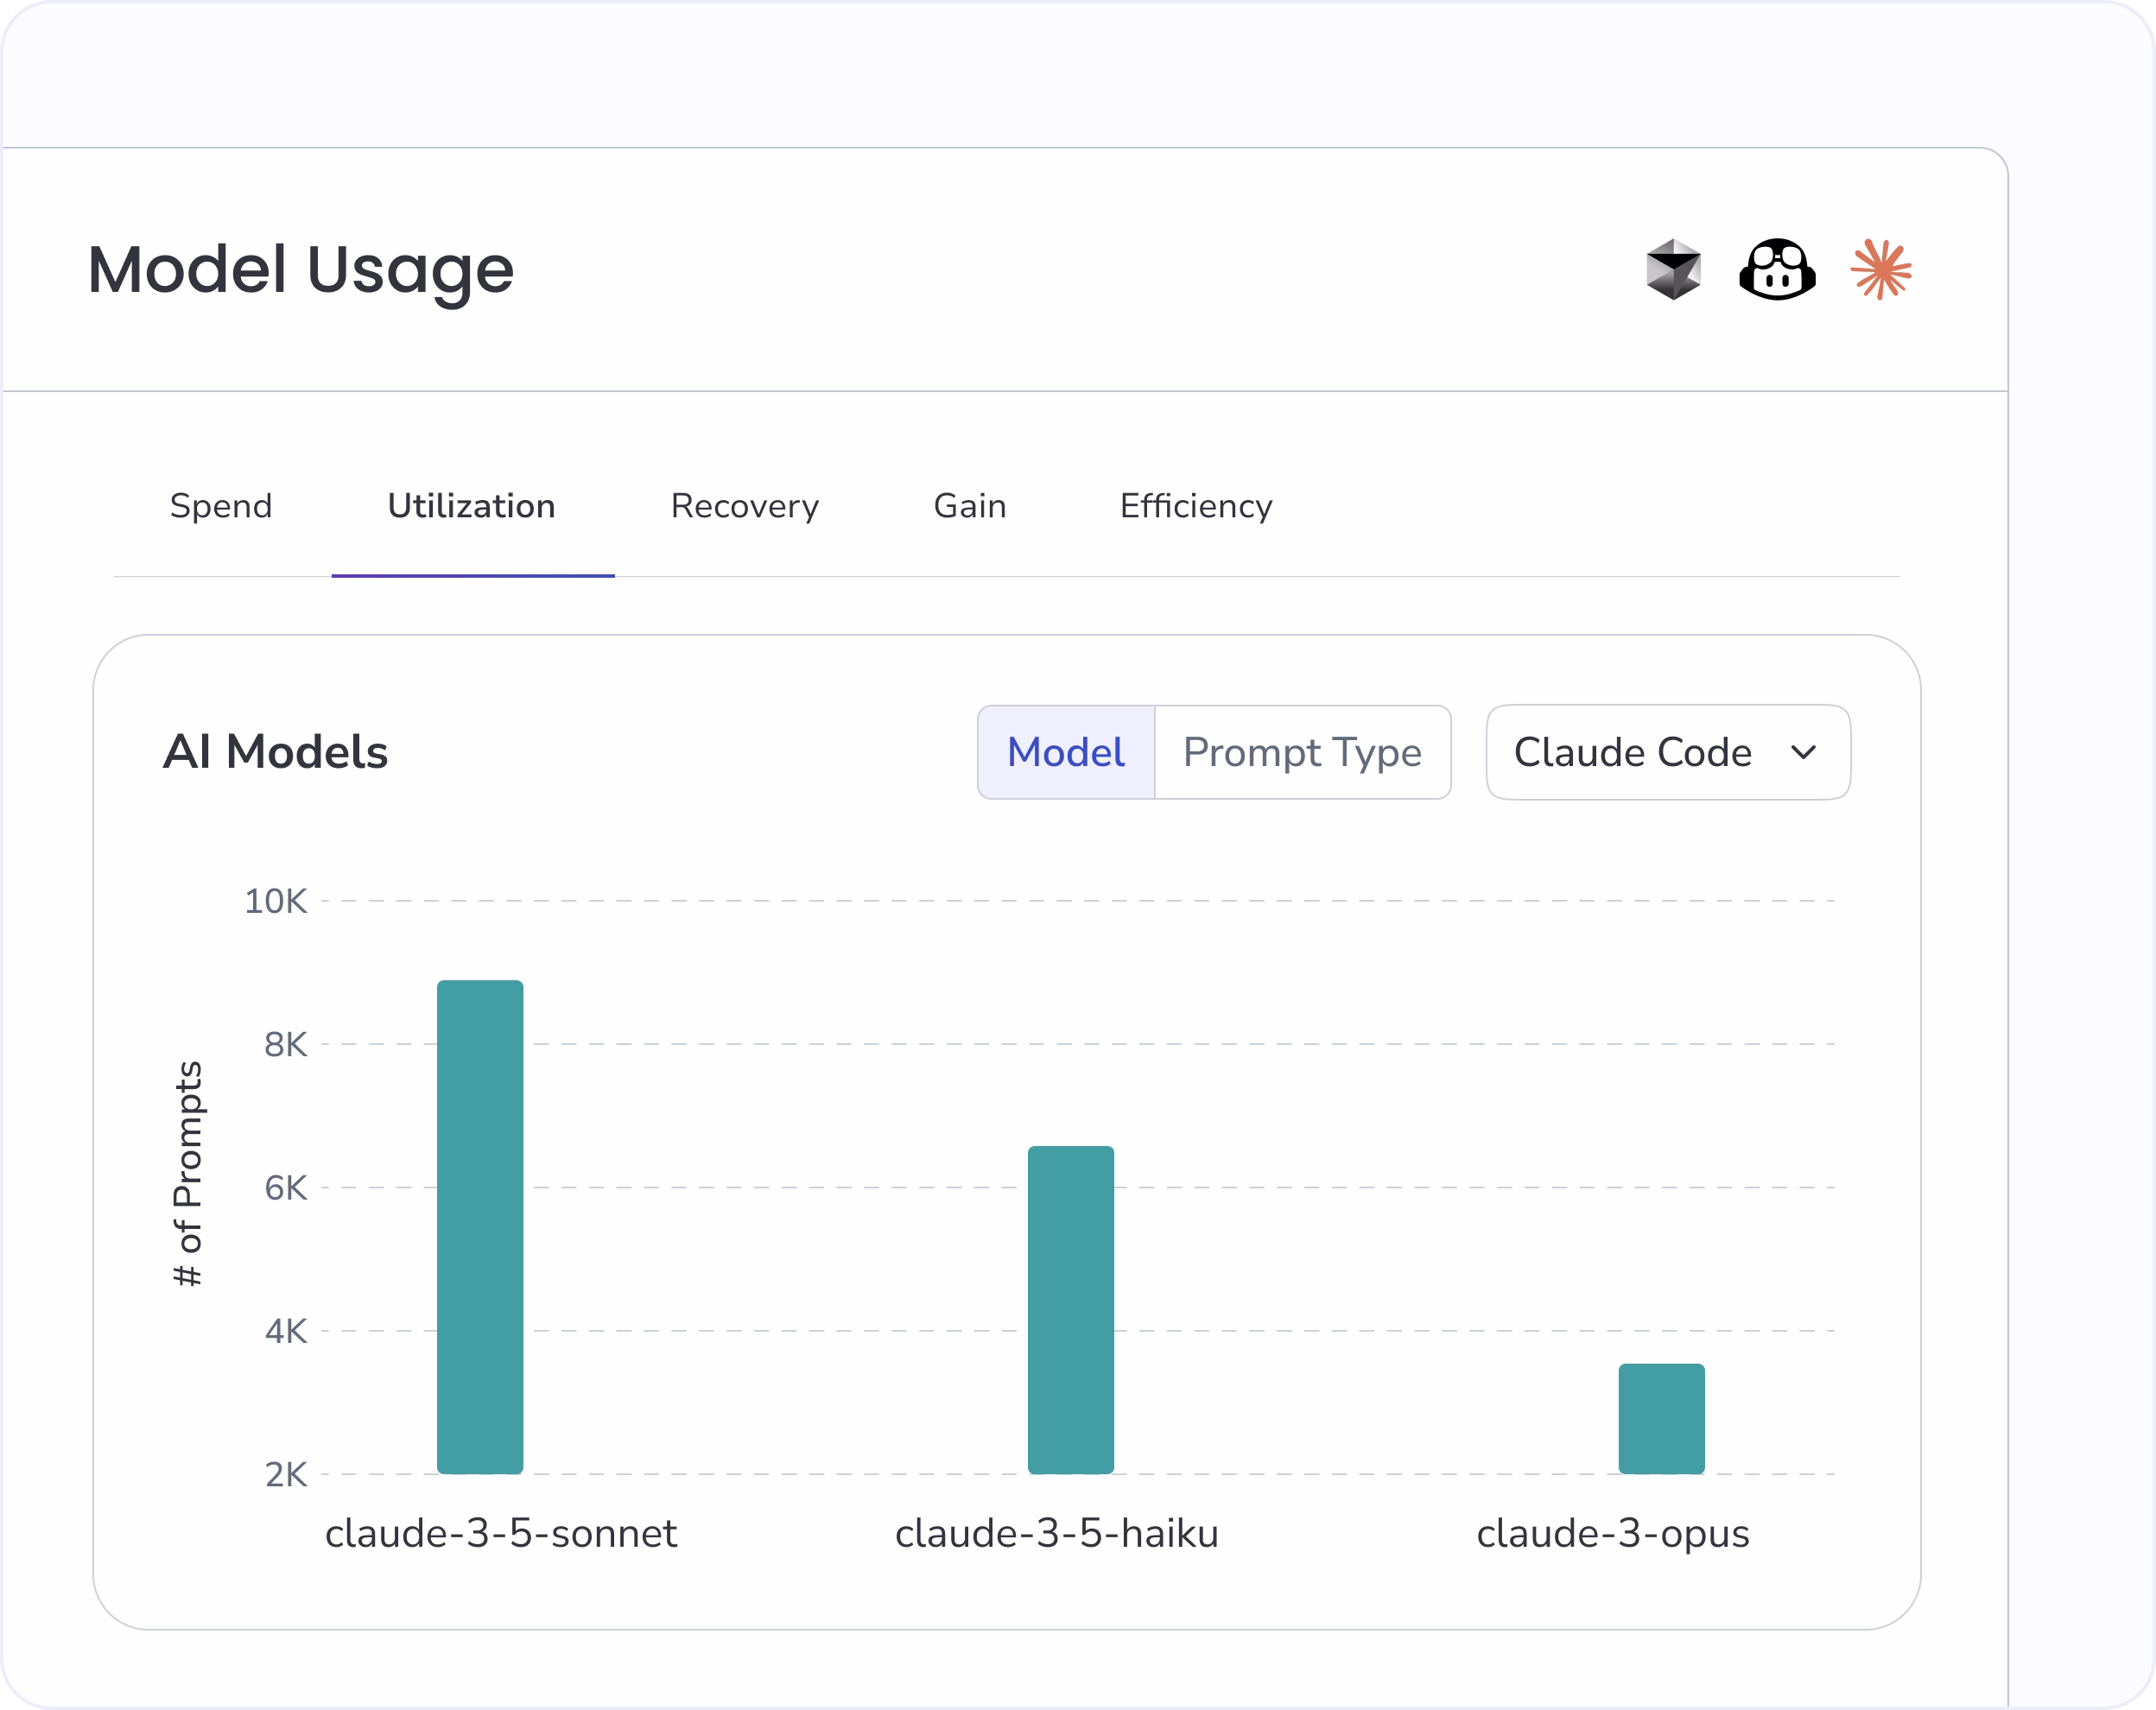
See which AI models do the work, and which sit untouched

The Model Usage chart breaks down prompt volume across every model your team has access to. Identify the premium models running routine tasks and the lightweight models doing complex work. The model mismatch costs Recovery will quantify.

Team-level adoption

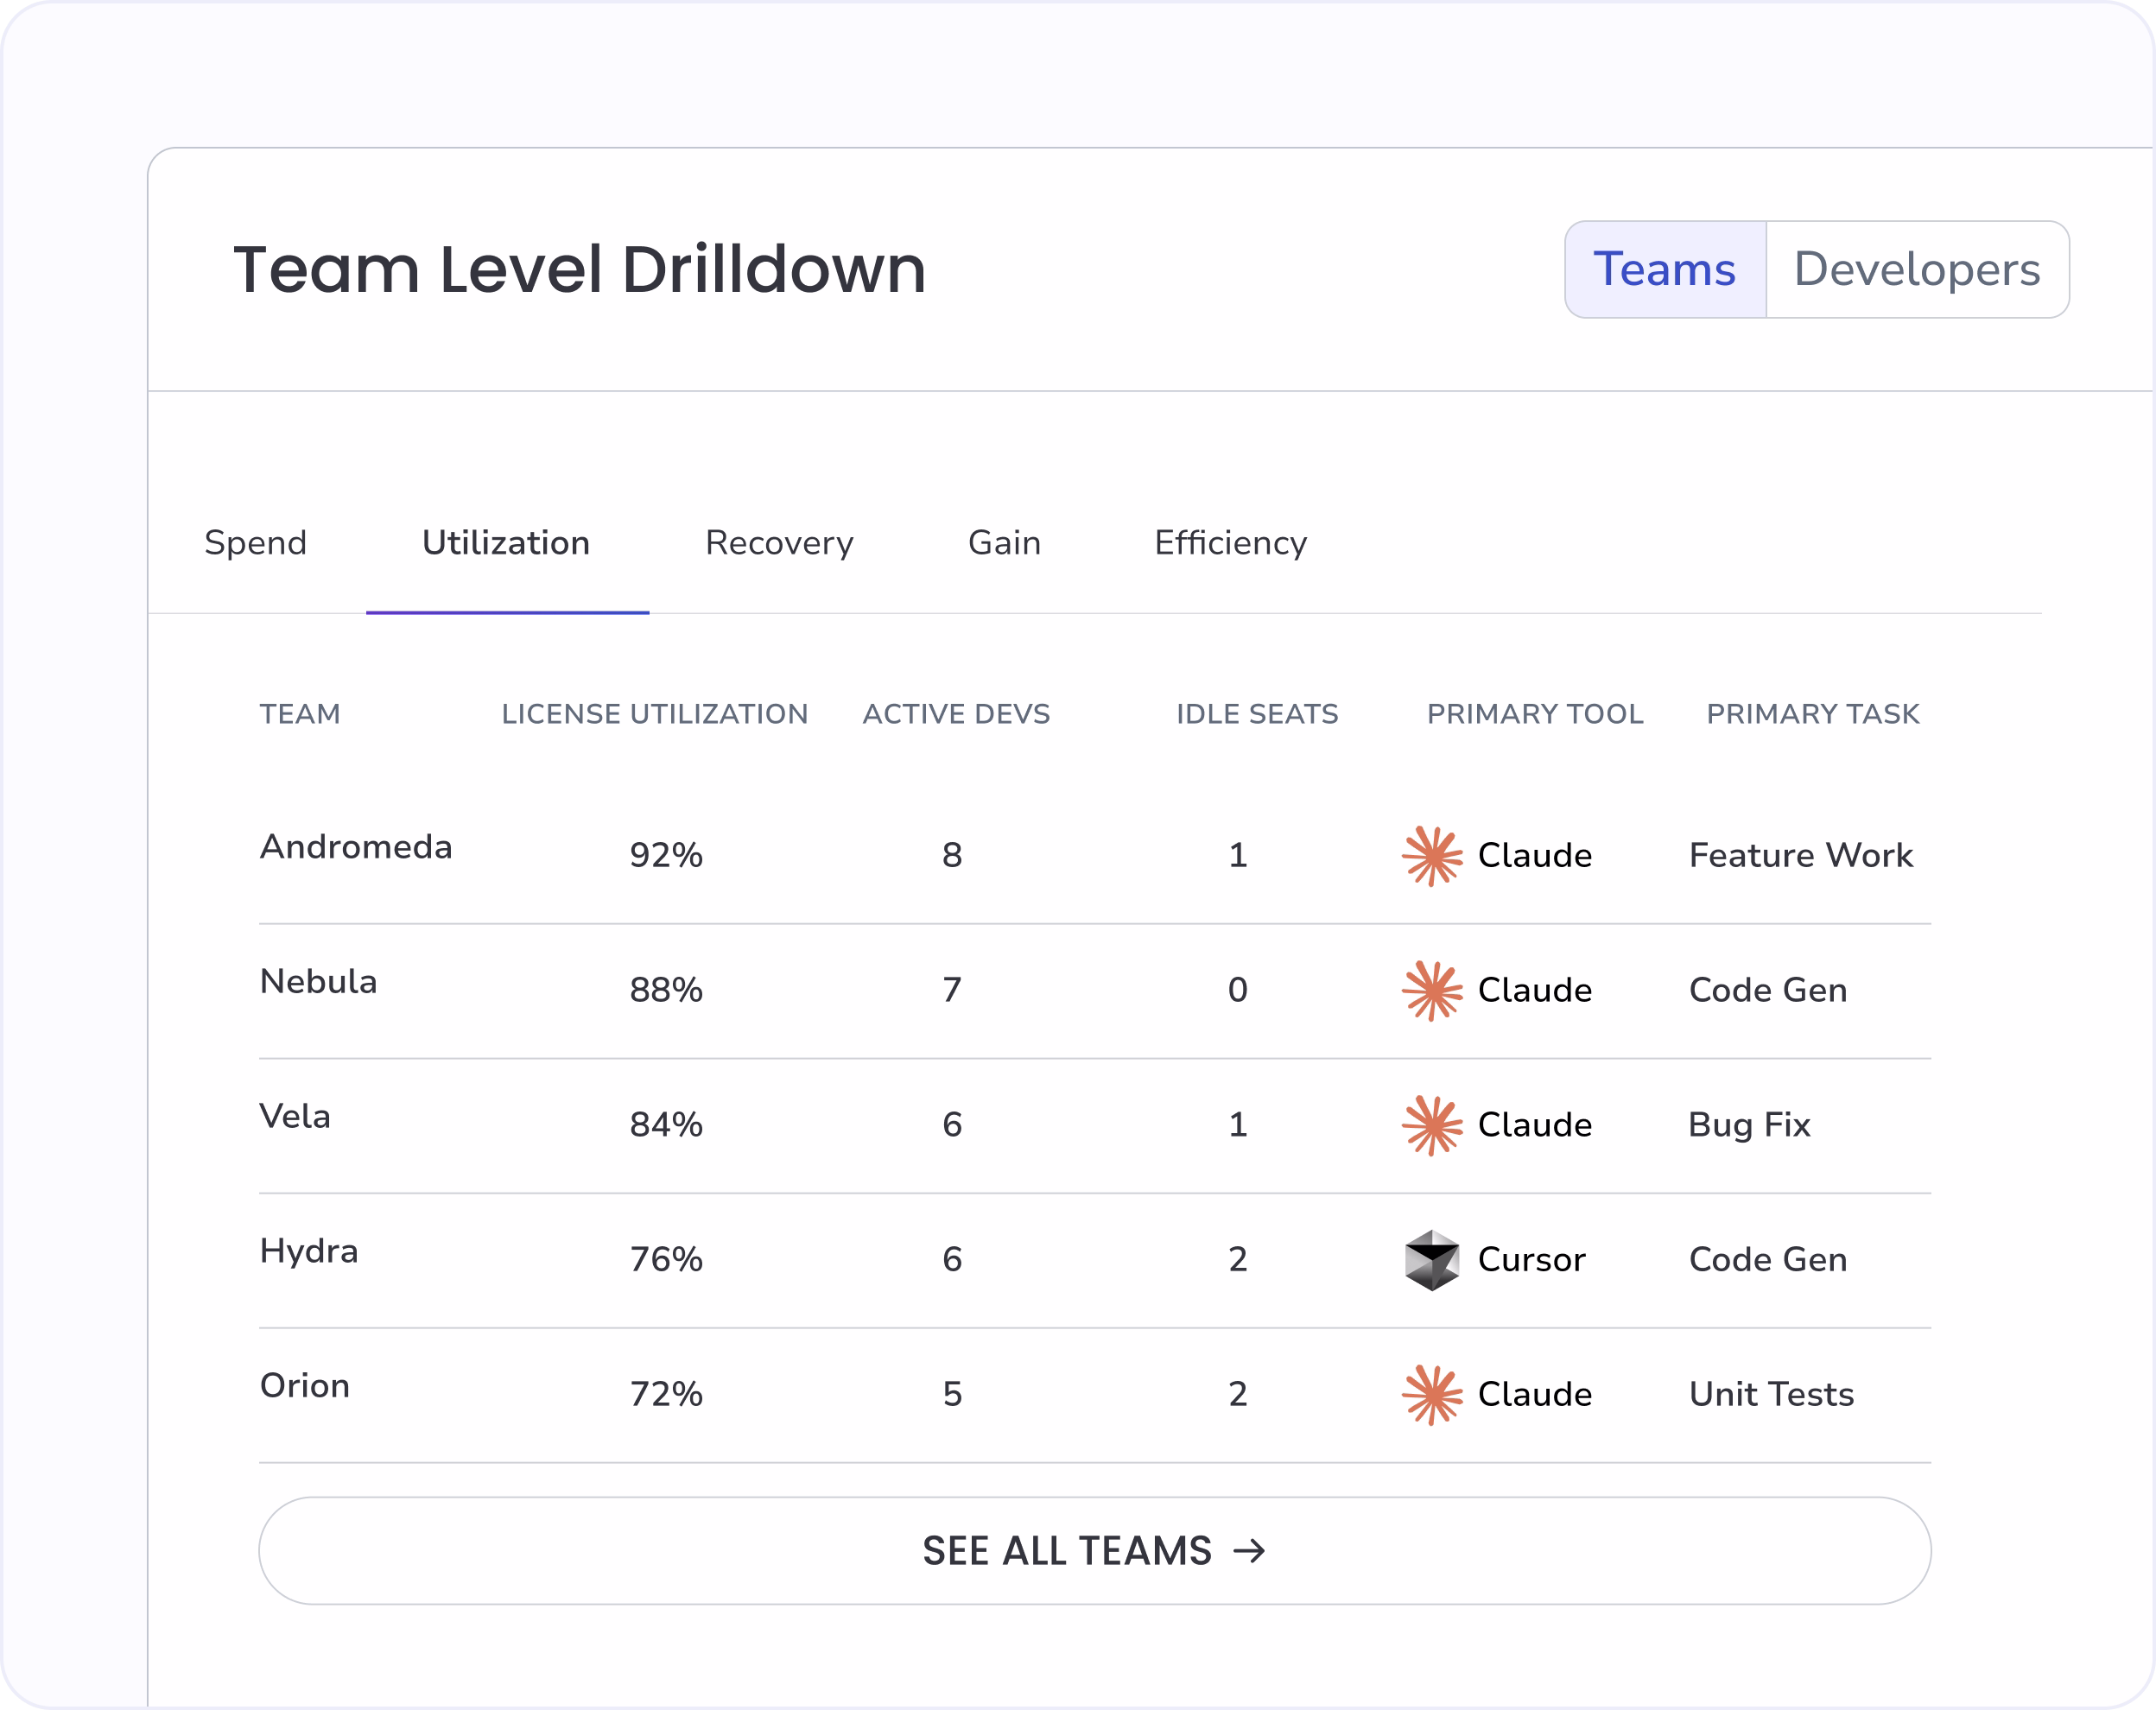
Find which teams lead AI adoption and which lag behind

Check org-wide teams in the rankings table with developer count, license utilization, idle seat cost, primary tool, and AI usage cohort (Power, Regular, Occasional, Inactive). The coaching map every platform team needs.

Five pillars. One measurement model. Real engineering data.

Multi-tool adoption tracking

Track Copilot, Cursor, and Claude Code adoption in one view. No more switching between vendor admin dashboards.

Power vs occasional cohorts

Segment developers into Power, Regular, Occasional, and Inactive cohorts. Target enablement where it produces the highest lift.

AI code telemetry

Detect AI-generated code in merged PRs from different AI coding platforms and code pasted from chat tools. Tool-agnostic measurement.

Idle seat cost surfacing

Each tool row shows idle seat cost in dollars. An input every renewal conversation needs, calculated automatically.

Frequently asked questions

What's the difference between License Utilization and Adoption Rate?

License Utilization is the percentage of paid seats actively used (e.g. 34 of 50 = 68%). Adoption Rate is the percentage of eligible developers using AI tools at all, regardless of license type. Both matter for different conversations: procurement focuses on utilization, engineering leaders on adoption.

How does Hivel detect AI usage without an IDE plugin?

Hivel's AI Code Telemetry analyzes merged PR diffs to detect AI-generated code patterns. The detection works across Copilot, Cursor, Claude Code, and code pasted from chat tools like ChatGPT. No IDE plugin required, which means coverage is tool-agnostic and complete.

What are Power, Regular, Occasional, and Inactive cohorts?

Hivel segments developers by AI usage frequency and depth. Power users use AI tools daily across multiple workflows. Regular users use them weekly. Occasional users use them less than once a week. Inactive seats are licensed but show near-zero activity. Cohort thresholds are configurable.

Can we see model-level usage for Claude and Cursor?

Yes. The Model Usage chart breaks down prompt volume by model (claude-3-5-sonnet, claude-3-5-haiku, claude-3-opus, etc.) using each vendor's admin API. Toggle between Model and Prompt Type views to see which work is happening on which model.

How does Hivel detect AI usage without an IDE plugin?

Hivel's AI Code Telemetry analyzes merged PR diffs to detect AI-generated code patterns. The detection works across Copilot, Cursor, Claude Code, and code pasted from chat tools like ChatGPT. No IDE plugin required, which means coverage is tool-agnostic and complete.

Trusted by 1000+ Engineering Teams

Vaibhav Bansal
V.P. Engineering
"Hivel has been phenomenal in helping us present our progress to leadership. Its insights into leading indicators have empowered our team leads to enhance review efficiency and ship features faster. Now, we are able to show the impact of our process changes, clearly identify areas of opportunity, and bring in a data-driven culture without spending time pulling manual reports."
Murali Swaminathan
Chief Technology Officer
"We were looking for a unique solution to understand engineering productivity and efficiency, with a single tool that could give leaders complete visibility. We evaluated other comparable tools, but none were comprehensive enough. When we came across Hivel, it checked all the boxes for measuring developer productivity across both AI and non-AI workflows."
Derek Mackie
Director of Engineering
"Using Hivel shone a light on the non-standard aspects of our work, emphasizing the need for crucial adjustments. The insights from Hivel helped us recognize areas for improvement, particularly in managing cycle times and streamlining development workflows. This guidance has been instrumental in our efforts to enhance operational efficiency and productivity."
Leonardo Pinheiro Ferrari
Chief Technology Officer
"Thanks to Hivel, we've seen a staggering 157% improvement in our deployment frequency. By identifying and addressing inefficiencies, and adopting best practices, we've significantly accelerated our progress. Hivel has been instrumental in our journey to operational excellence."
Chris Callander
Senior Engineering Manager
"Hivel has been instrumental in identifying areas for enhancement and guiding our strategic improvements. It has significantly contributed to our journey toward greater operational efficiency. The Activity and Dev360 features in Hivel have been particularly valuable for providing feedback to engineers during 1-1's, enhancing our communication and development practices."
Shiro Theuri
Chief Technology Officer
"Before Hivel, understanding our engineering team's dynamics was a game of guesswork. Now, with Hivel's clear dashboards and insights, our leaders have the clarity and time-saving tools they need to excel. It's been transformative in streamlining our operations."
Koti Reddy
Chief Technology Officer
"Incorporating Hivel into our daily operations has been a game-changer. It's not just a tool; it's a part of our strategic decision-making process, trusted by our leaders at every level. The impact on our engineering efficiency is undeniable and deeply valued."
Manoj Awasthi
Chief Technology Officer
"It has been great to partner with Hivel to get access to insights that help leaders at all levels gain visibility into bottlenecks and challenges that the teams face, build actionable plan to resolve them and track the progress over time. And thanks for the fantastic support!"
Ameen M
Engineering Manager
"Hivel has made a huge difference to how I manage my teams. Before every one-on-one or appraisal, I rely on it to dive into developer metrics and drive truly meaningful conversations. It helps me spot rework patterns, reward high performers, and benchmark our teams even against our US counterparts. The dashboards are intuitive, insightful, and honestly far more actionable than anything we get from Jira."
Paras Sood
Associate Director
"Hivel's insights have been pivotal in refining our engineering processes, elevating both efficiency and the developer experience. We're now making smarter decisions, faster, thanks to Hivel."
Vaibhav Bansal
V.P. Engineering
"Hivel has been phenomenal in helping us present our progress to leadership. Its insights into leading indicators have empowered our team leads to enhance review efficiency and ship features faster. Now, we are able to show the impact of our process changes, clearly identify areas of opportunity, and bring in a data-driven culture without spending time pulling manual reports."
Murali Swaminathan
Chief Technology Officer
“We were looking for a unique solution to understand engineering productivity and efficiency, with a single tool that could give leaders complete visibility. We evaluated other comparable tools, but none were comprehensive enough. When we came across Hivel, it checked all the boxes for measuring developer productivity across both AI and non-AI workflows.”
Vaibhav Bansal
V.P. Engineering
"Hivel has been phenomenal in helping us present our progress to leadership. Its insights into leading indicators have empowered our team leads to enhance review efficiency and ship features faster. Now, we are able to show the impact of our process changes, clearly identify areas of opportunity, and bring in a data-driven culture without spending time pulling manual reports."
Derek Mackie
Director of Engineering
"Using Hivel shone a light on the non-standard aspects of our work, emphasizing the need for crucial adjustments. The insights from Hivel helped us recognize areas for improvement, particularly in managing cycle times and streamlining development workflows. This guidance has been instrumental in our efforts to enhance operational efficiency and productivity."
Leonardo Pinheiro Ferrari
Chief Technology Officer
"Thanks to Hivel, we've seen a staggering 157% improvement in our deployment frequency. By identifying and addressing inefficiencies, and adopting best practices, we've significantly accelerated our progress. Hivel has been instrumental in our journey to operational excellence."

"The only tool our entire leadership team actually trusts"