Get the full picture on your AI adoption and impact.
We'll show you exactly how AI is impacting your speed and code quality.


The SURGE FRAMEWORK
Is your AI spend shipping code, or just reporting usage?
SURGE connects every AI dollar to the code it actually shipped - across Spend, Utilization, Recovery, Gains, and Efficiency. It runs on real engineering telemetry from 100,000+ engineers, not survey estimates, so you can justify, scale, or right-size AI with numbers that hold up in a board meeting.

The framework
Five pillars. One measurement model. Real engineering data.
SURGE follows the full value chain from AI investment to delivered outcome. Each pillar answers a question your current dashboards can't.
Spend
Utilization
Recovery
Gain
Efficiency
Benchmark findings
What 100,000+ engineers reveal about AI ROI.
Four numbers from the SURGE benchmark dataset, every figure pulled from real customer telemetry, not survey estimates.
The problem
AI spend is on the board. No engineering org can prove what it returned.
Vendor dashboards report seat counts. Survey-based ROI frameworks estimate from assumptions. Neither connects AI dollars to shipped code, recovered waste, or measurable engineering output. By the time the renewal conversation lands, the data still doesn't exist.
Adoption is Not output
Estimates don't survive Finance
Waste hides in five different places
The questions Jira reports can't answer. Investment Profile can.
See every AI dollar and who's actually using it
A high spender can be a power user or an expensive churner. SURGE surfaces the patterns survey data never catches and joins spend to merged output, so the number you act on reflects value delivered, not activity logged.
See how Spend is measured →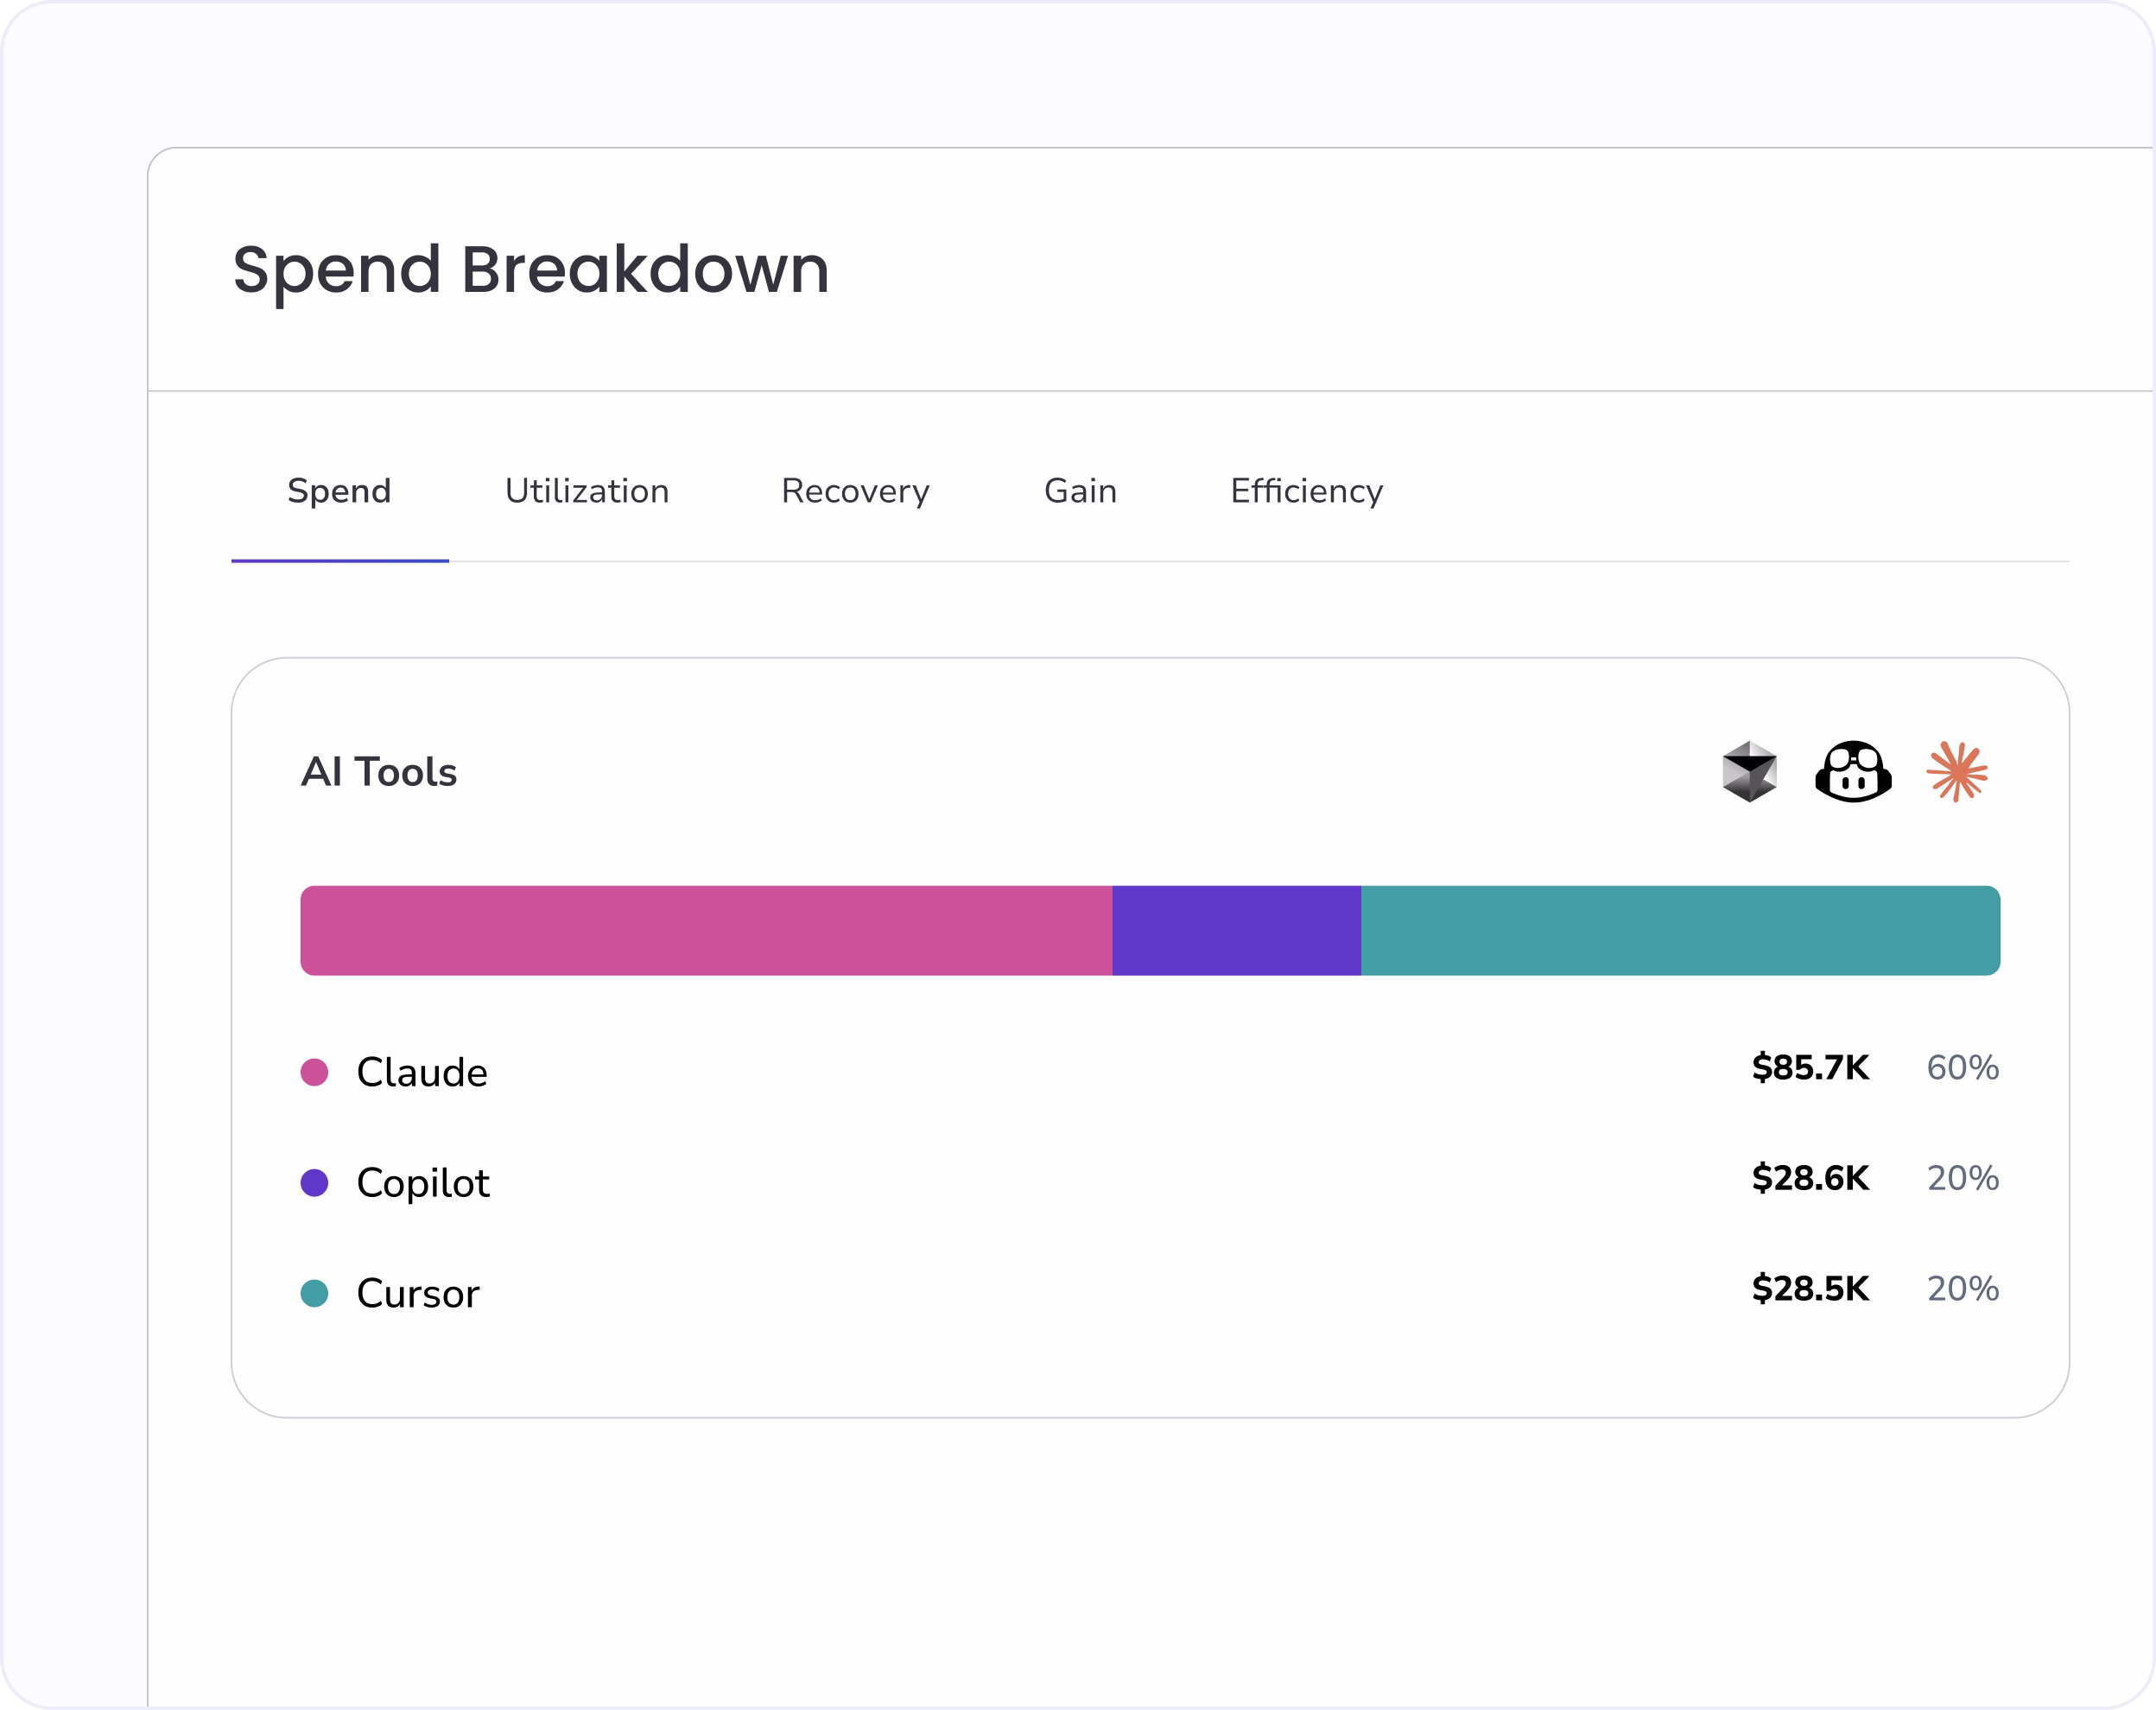
A seat assigned is not a tool used.
Track the complete lifecycle of AI-generated code from the IDE straight through to production. By analyzing long-term engagement patterns, SURGE automatically clusters developers into distinct adoption archetypes: Fast & Sustained, Fast Then Cliff, or Slow Then Stick to reveal true organizational behavioral shifts.
See how Utilization is measured →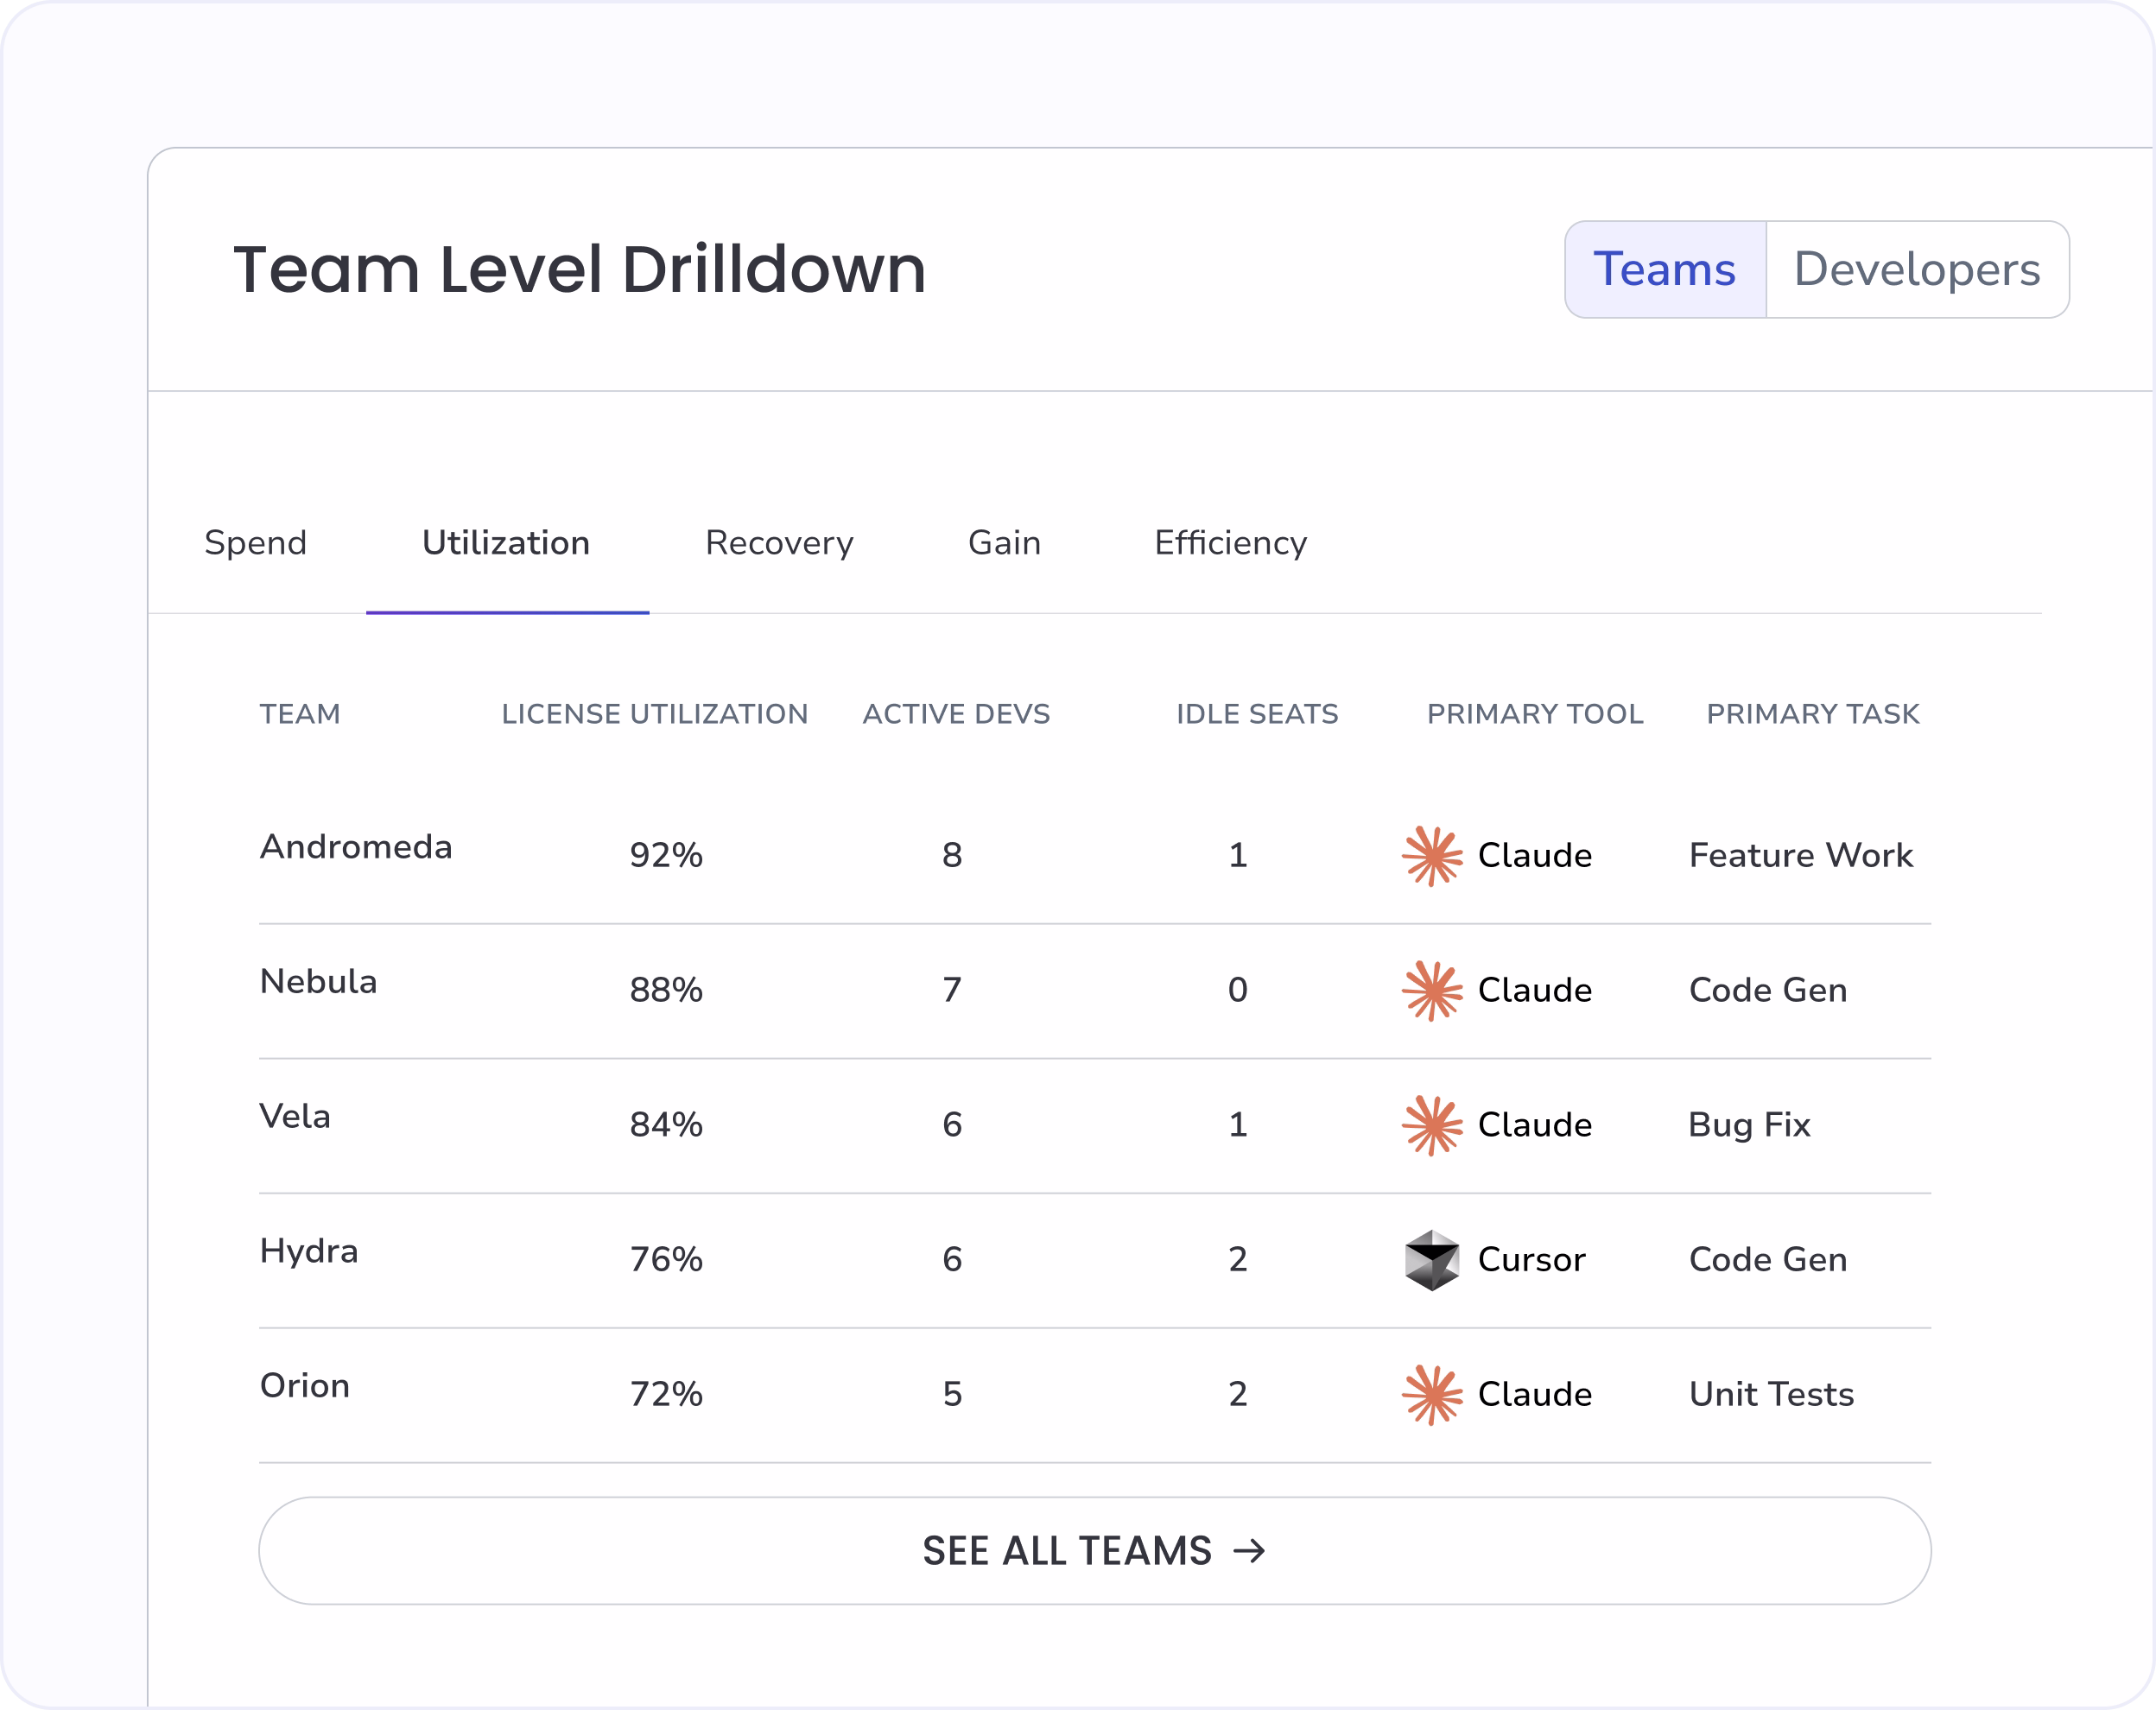
See the recoverable AI investment before your next renewal
Recovery surfaces the recoverable AI spend across idle licenses, model mismatch, overlapping tools, and zombie agents. Every dollar tied to a cause, every cause traceable to a team, ready for procurement.
See how Recovery is measured →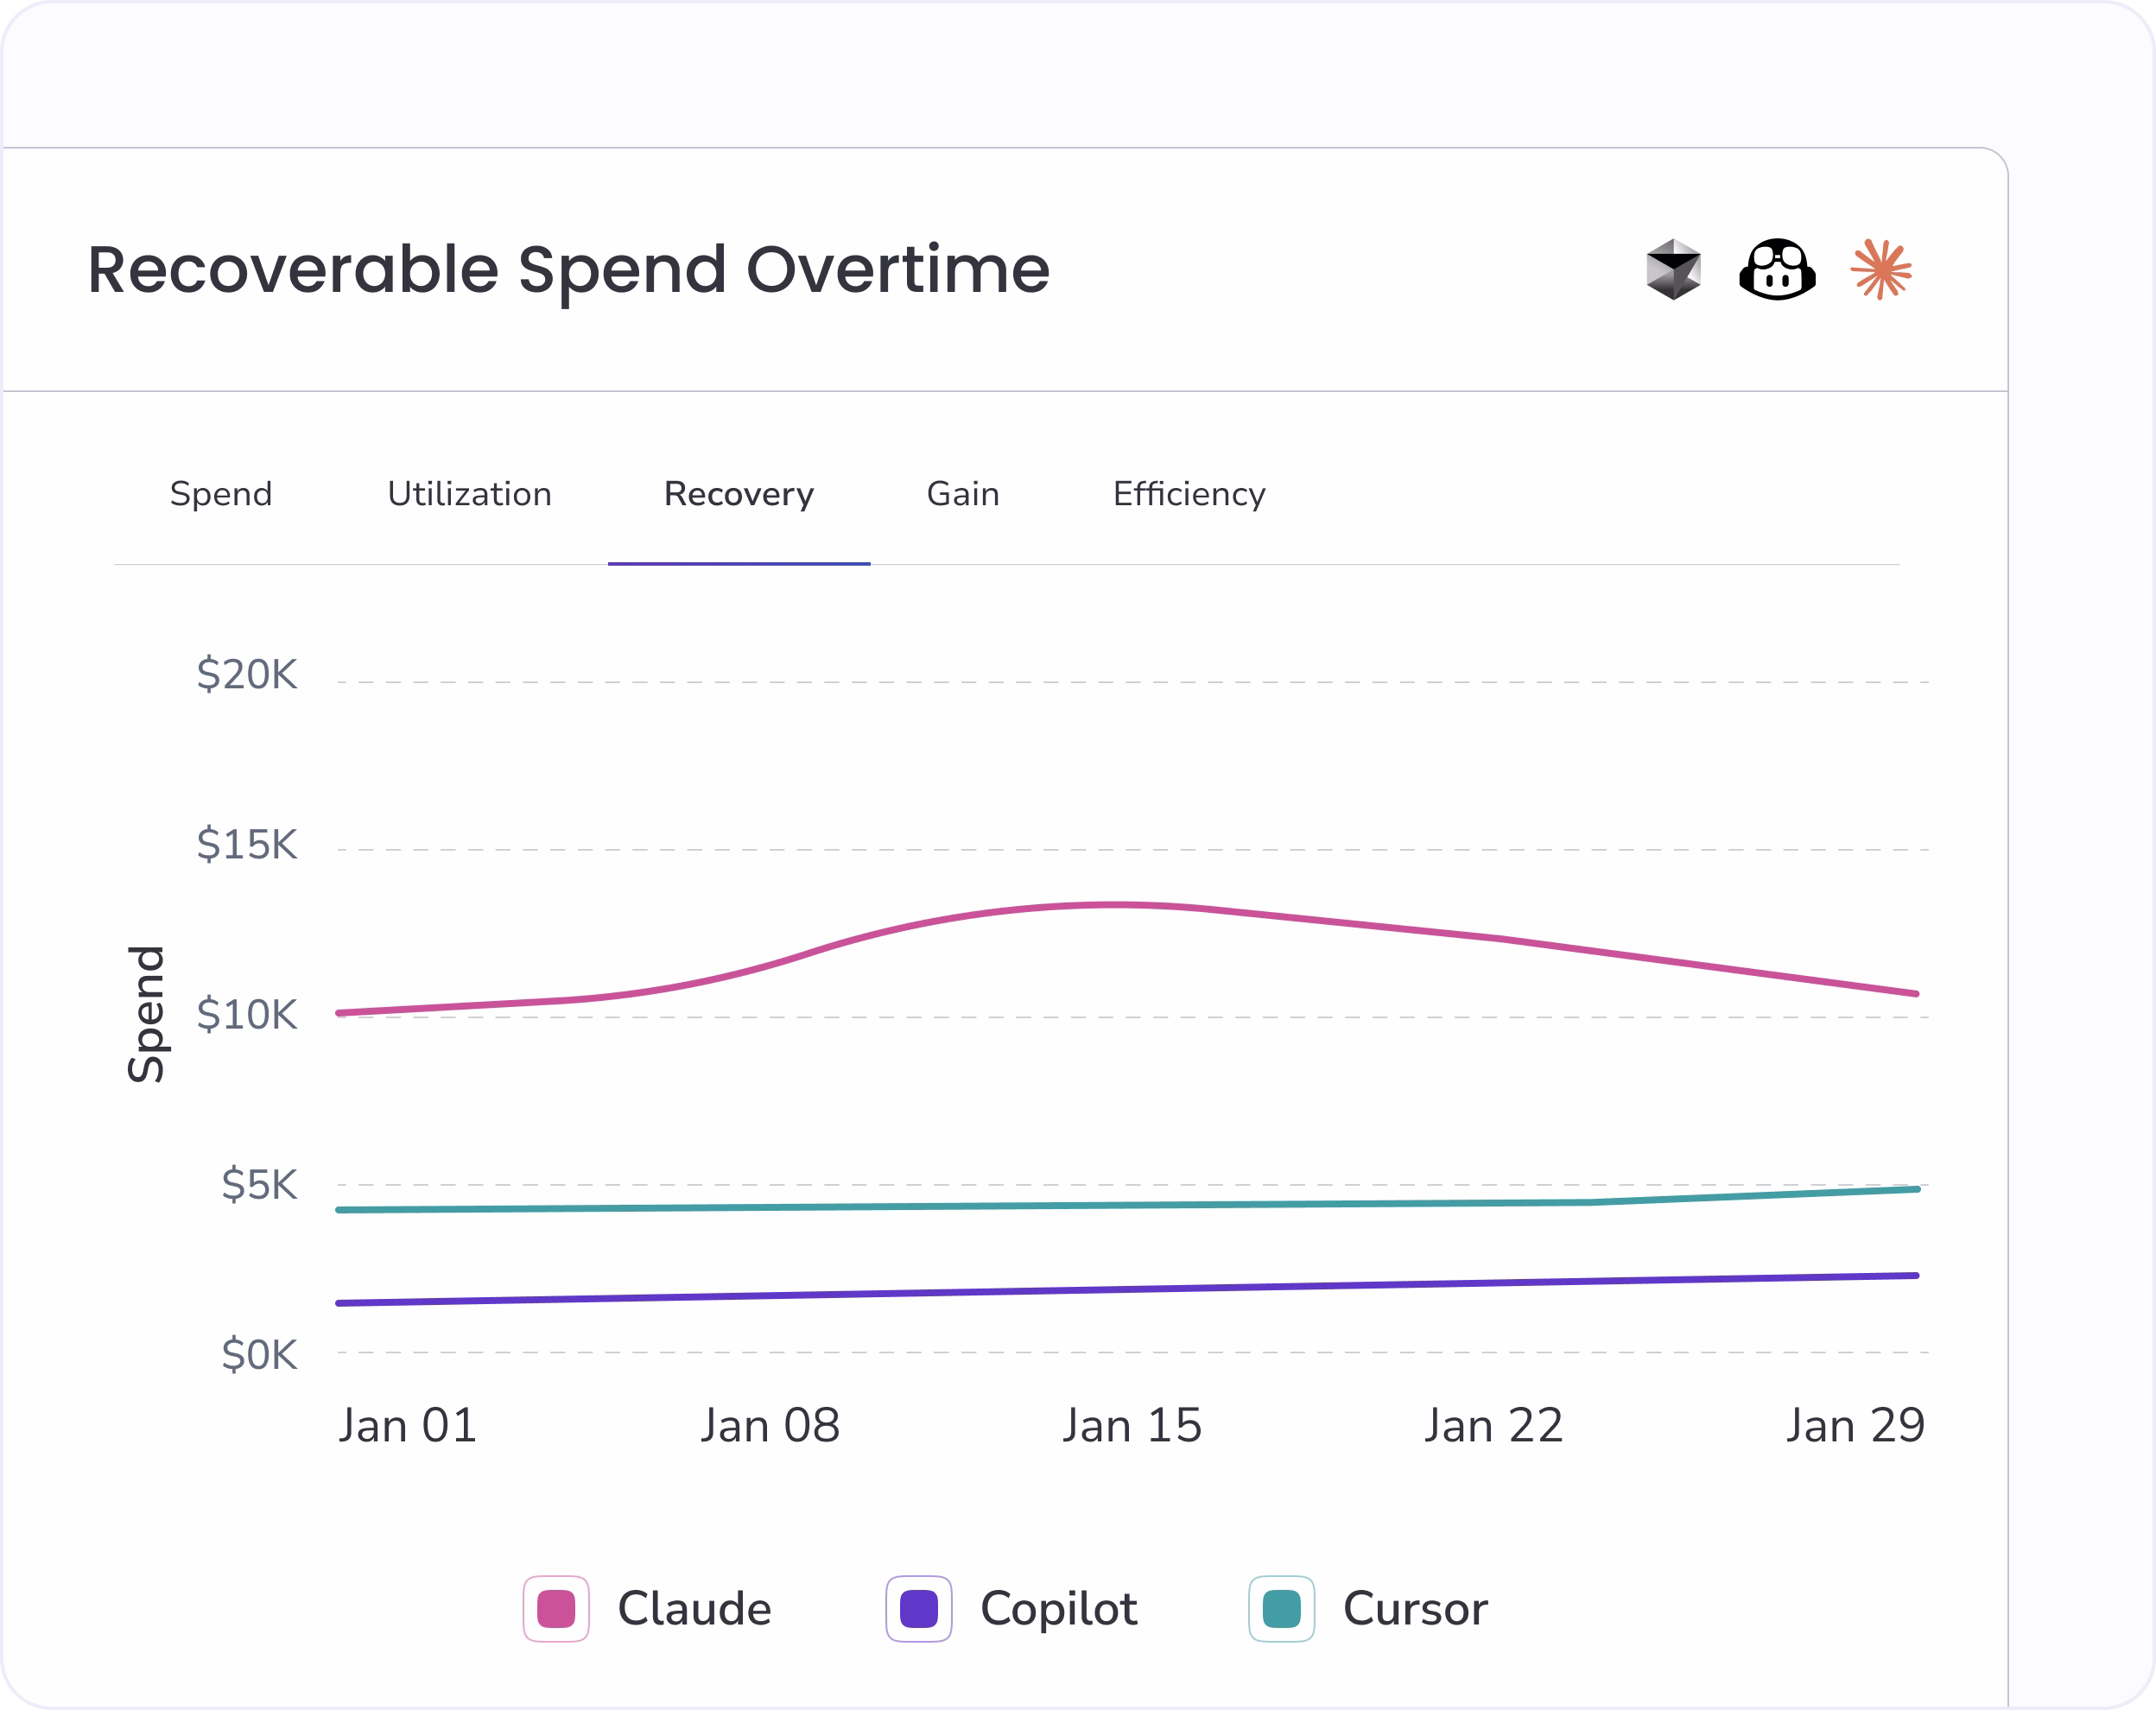
Count the PRs that AI actually helped ship
Gain shows AI-assisted PRs merged, AI code percentage, and acceptance rate from real production data. Skip the IDE counters and survey estimates. Measures what reached production and what each delivered change actually cost.
See how Gains is measured →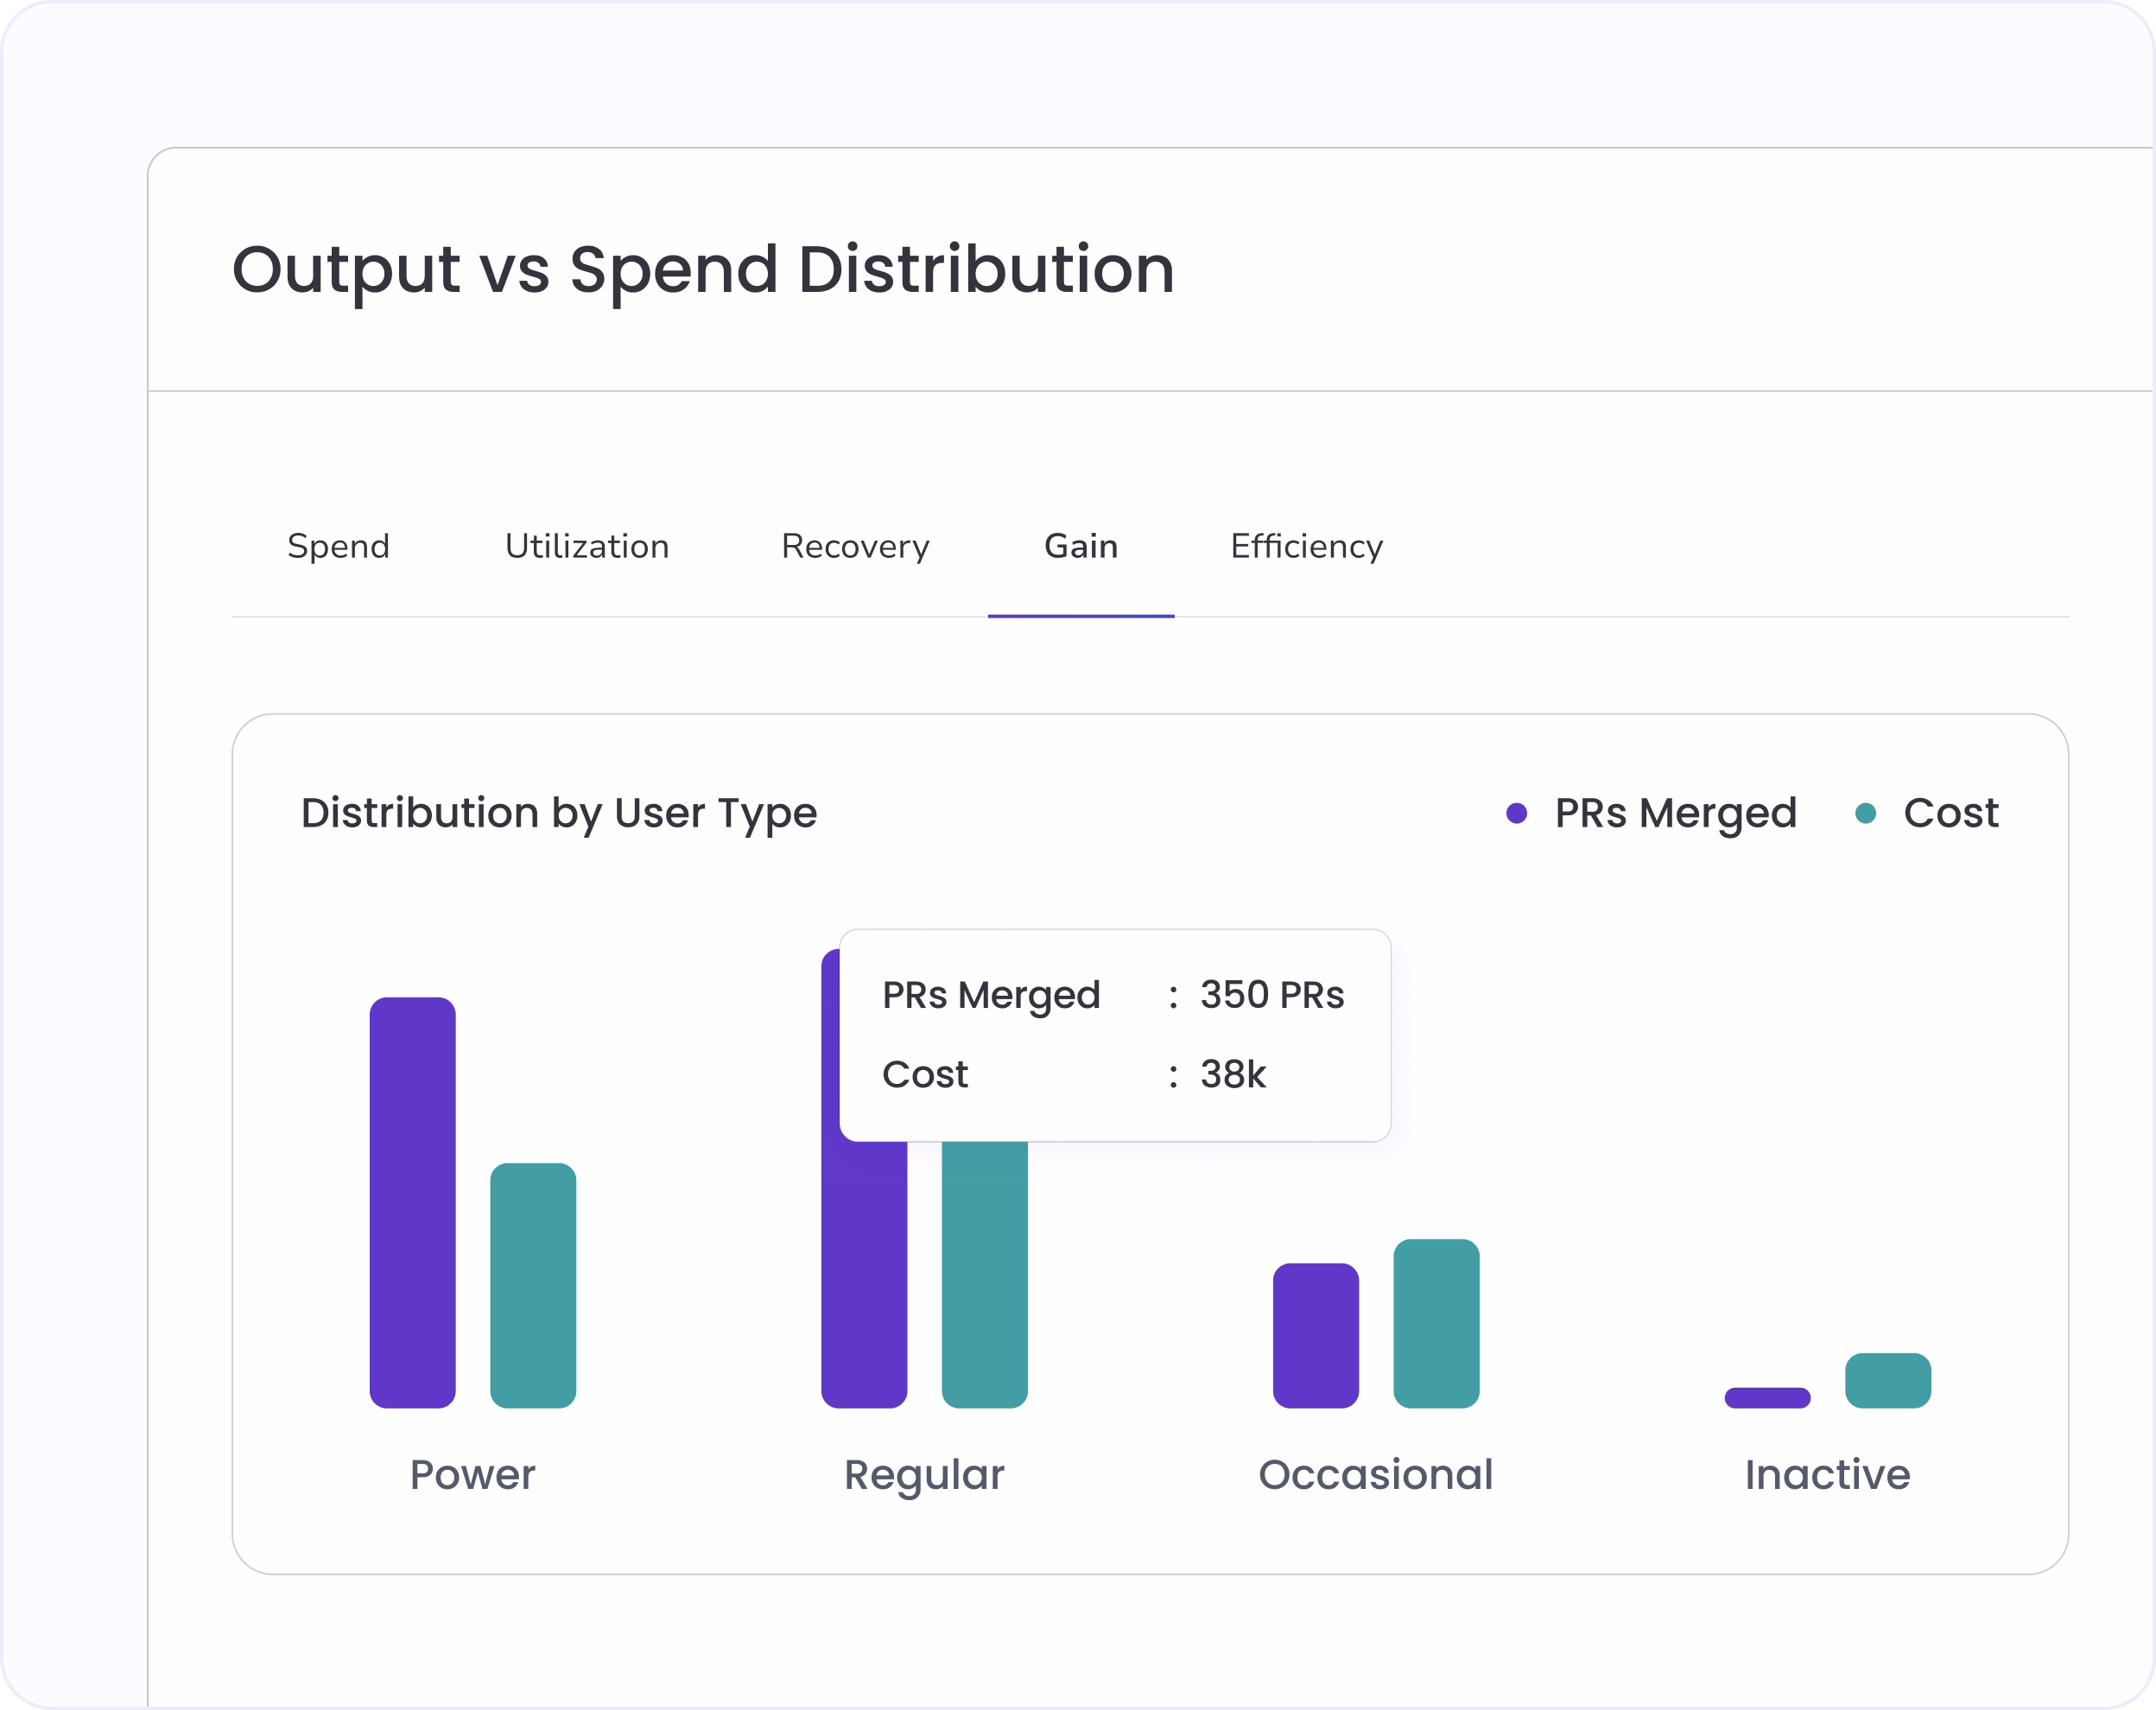
Surface the highest and lowest performing teams on AI ROI
Efficiency is where SURGE delivers the bottom line. Efficiency Multiplier, Cost per PR, AI-Assisted PRs Merged, and Rework Rate, calibrated continuously. The board-grade AI ROI number every engineering investment conversation needs.
See how Efficiency is measured →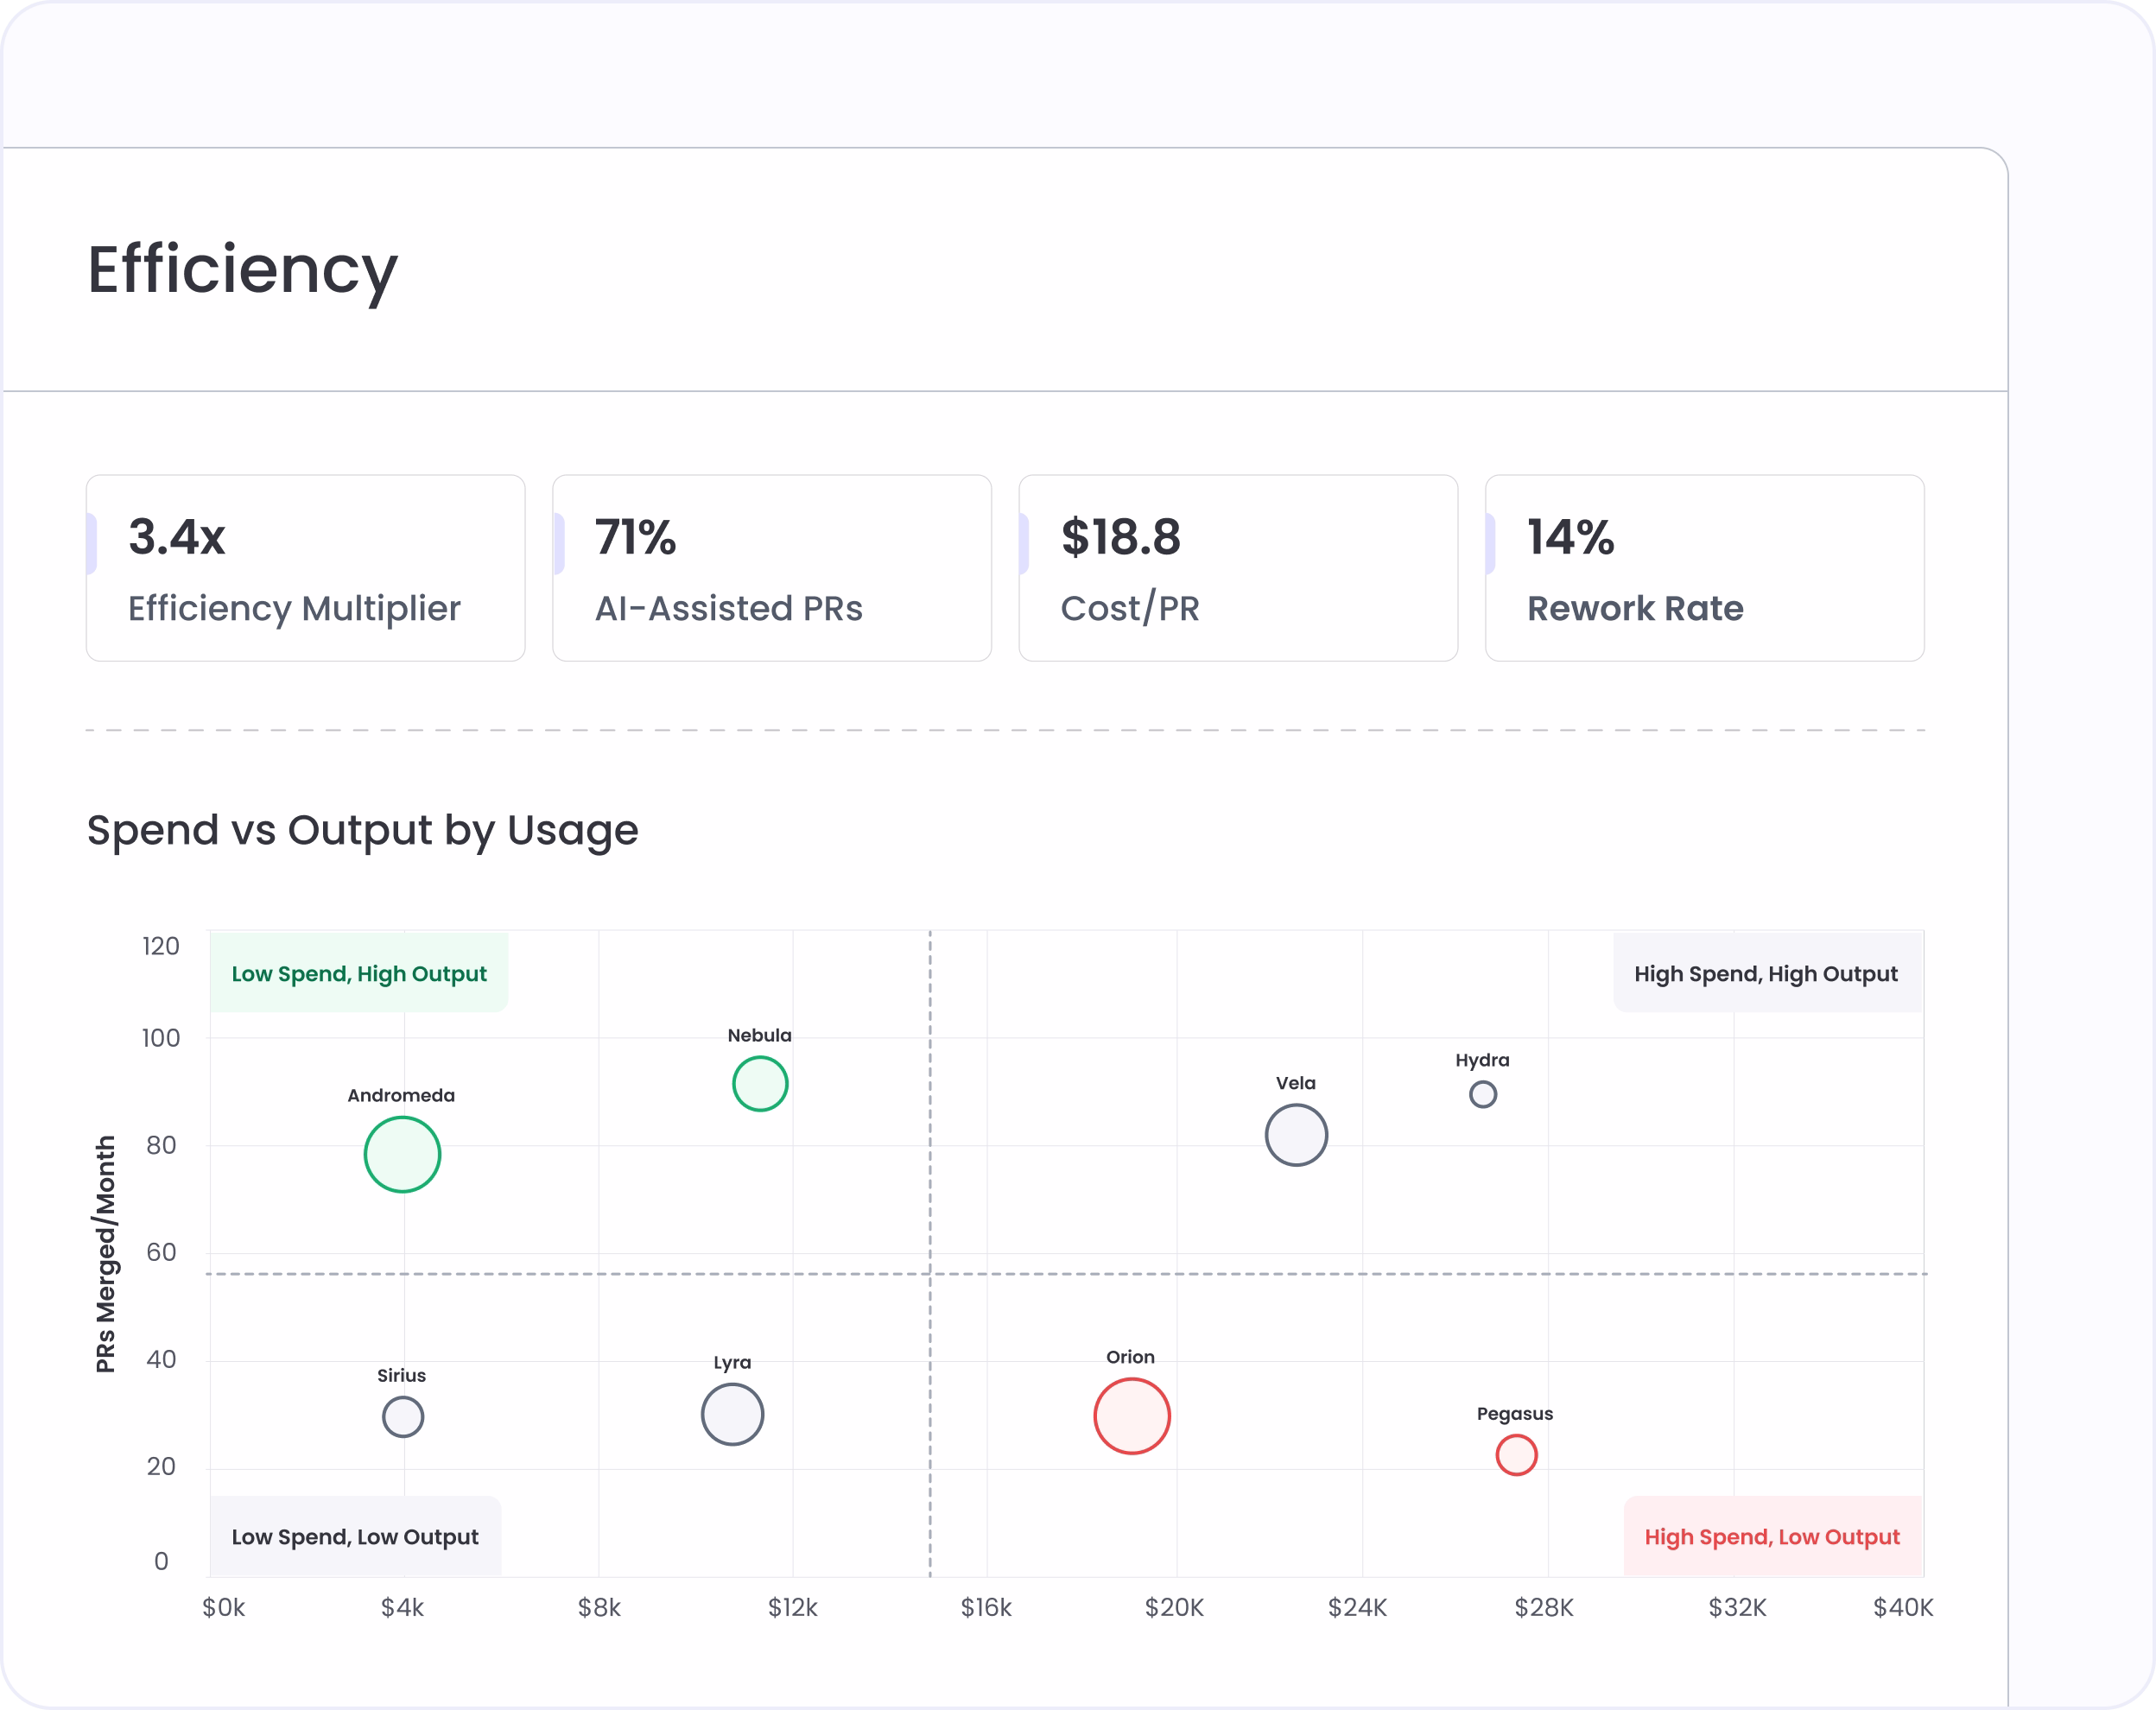
What teams shipped after measuring AI with SURGE.
Measurable business impact and vetted customer outcomes from industry leaders.
Frequently asked questions
What does SURGE stand for?
Spend, Utilization, Recovery, Gains, Efficiency — five pillars that measure the full value chain from AI investment to delivered engineering output. The E does double duty as the audience anchor: the framework is built for engineering teams.
How is SURGE different from DORA's ROI framework?
DORA's framework is a calculator powered by survey-based assumptions. SURGE replaces those assumptions with real telemetry from 100,000+ engineers — the output is a measured benchmark, not an estimate. We adopt DORA's amplifier thesis and J-curve directly, then measure what DORA could only estimate.
What does Hivel mean by "recoverable" AI spend?
Recovery aggregates five waste patterns most orgs can't see: idle licenses with near-zero activity, multiple paid tools on one seat where only one gets used, premium models used for low-value tasks, contracts committed above actual burn, and abandoned or zombie agents still calling APIs.
How does SURGE measure AI-attributed code without IDE telemetry?
Hivel's AI Code Telemetry classifies merged code as AI-generated or human-written directly from PR diffs — tool-agnostic, with no IDE plugin dependency. It catches contributions from Copilot, Cursor, Claude, and ChatGPT, including code pasted in from chat tools.
Is SURGE only for CTOs and engineering leaders?
No. Each pillar serves a specific audience. Spend and Recovery are Finance and Procurement conversations. Utilization and Gains are platform and engineering-leader conversations. Efficiency is the board conversation. The framework holds across all of them.
Trusted by 1000+ Engineering Teams


.svg)
.png)


"The only tool our entire leadership team actually trusts"