We'll show you exactly how AI is impacting your speed and code quality.


Velocity, AI impact, and team health across every team and repo. No more stitching a board-prep dashboard from ten siloed tools the night before.
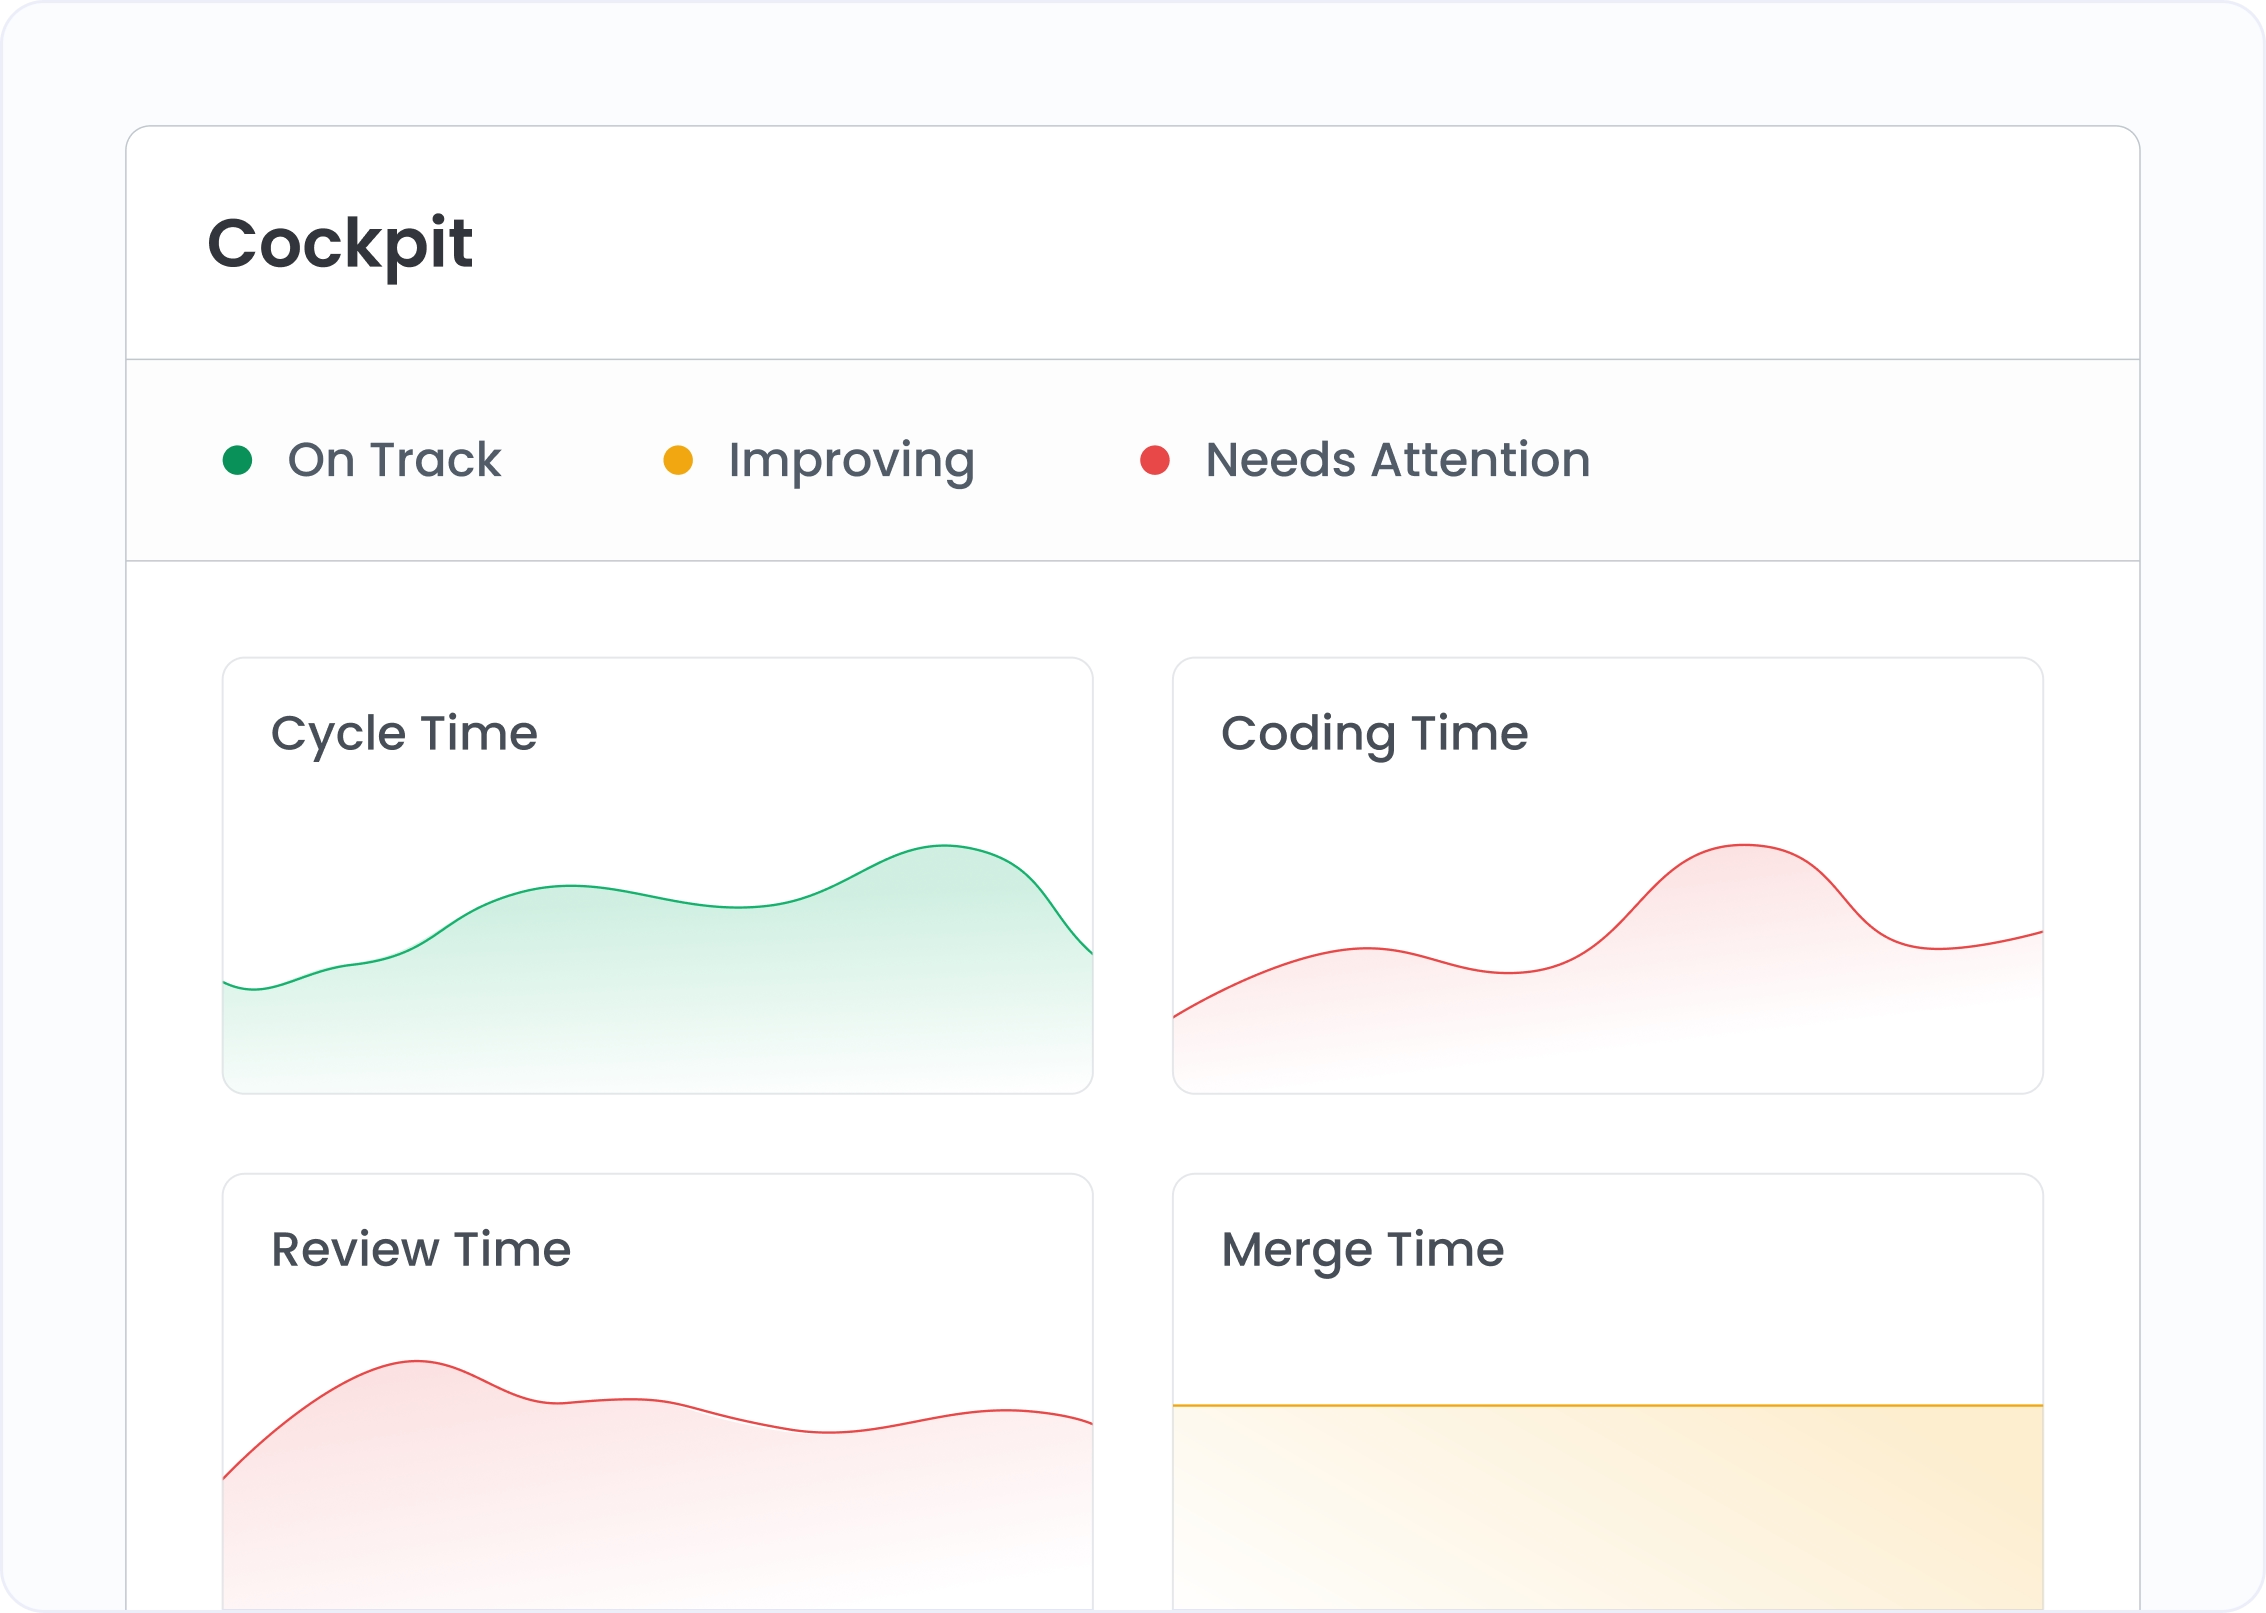
AI impact, DORA metrics, cycle time, and team throughput on the same screen. Correlate what changed, when it changed, and which teams it changed for.
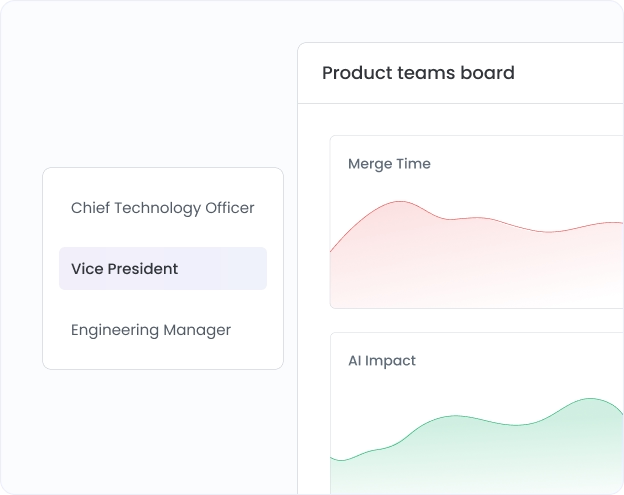
CTOs see org-level metrics. VPs see their four product teams. EMs see their repos. Each board is scoped to the right teams, repos, and time window, so every role works from data relevant to their decisions.
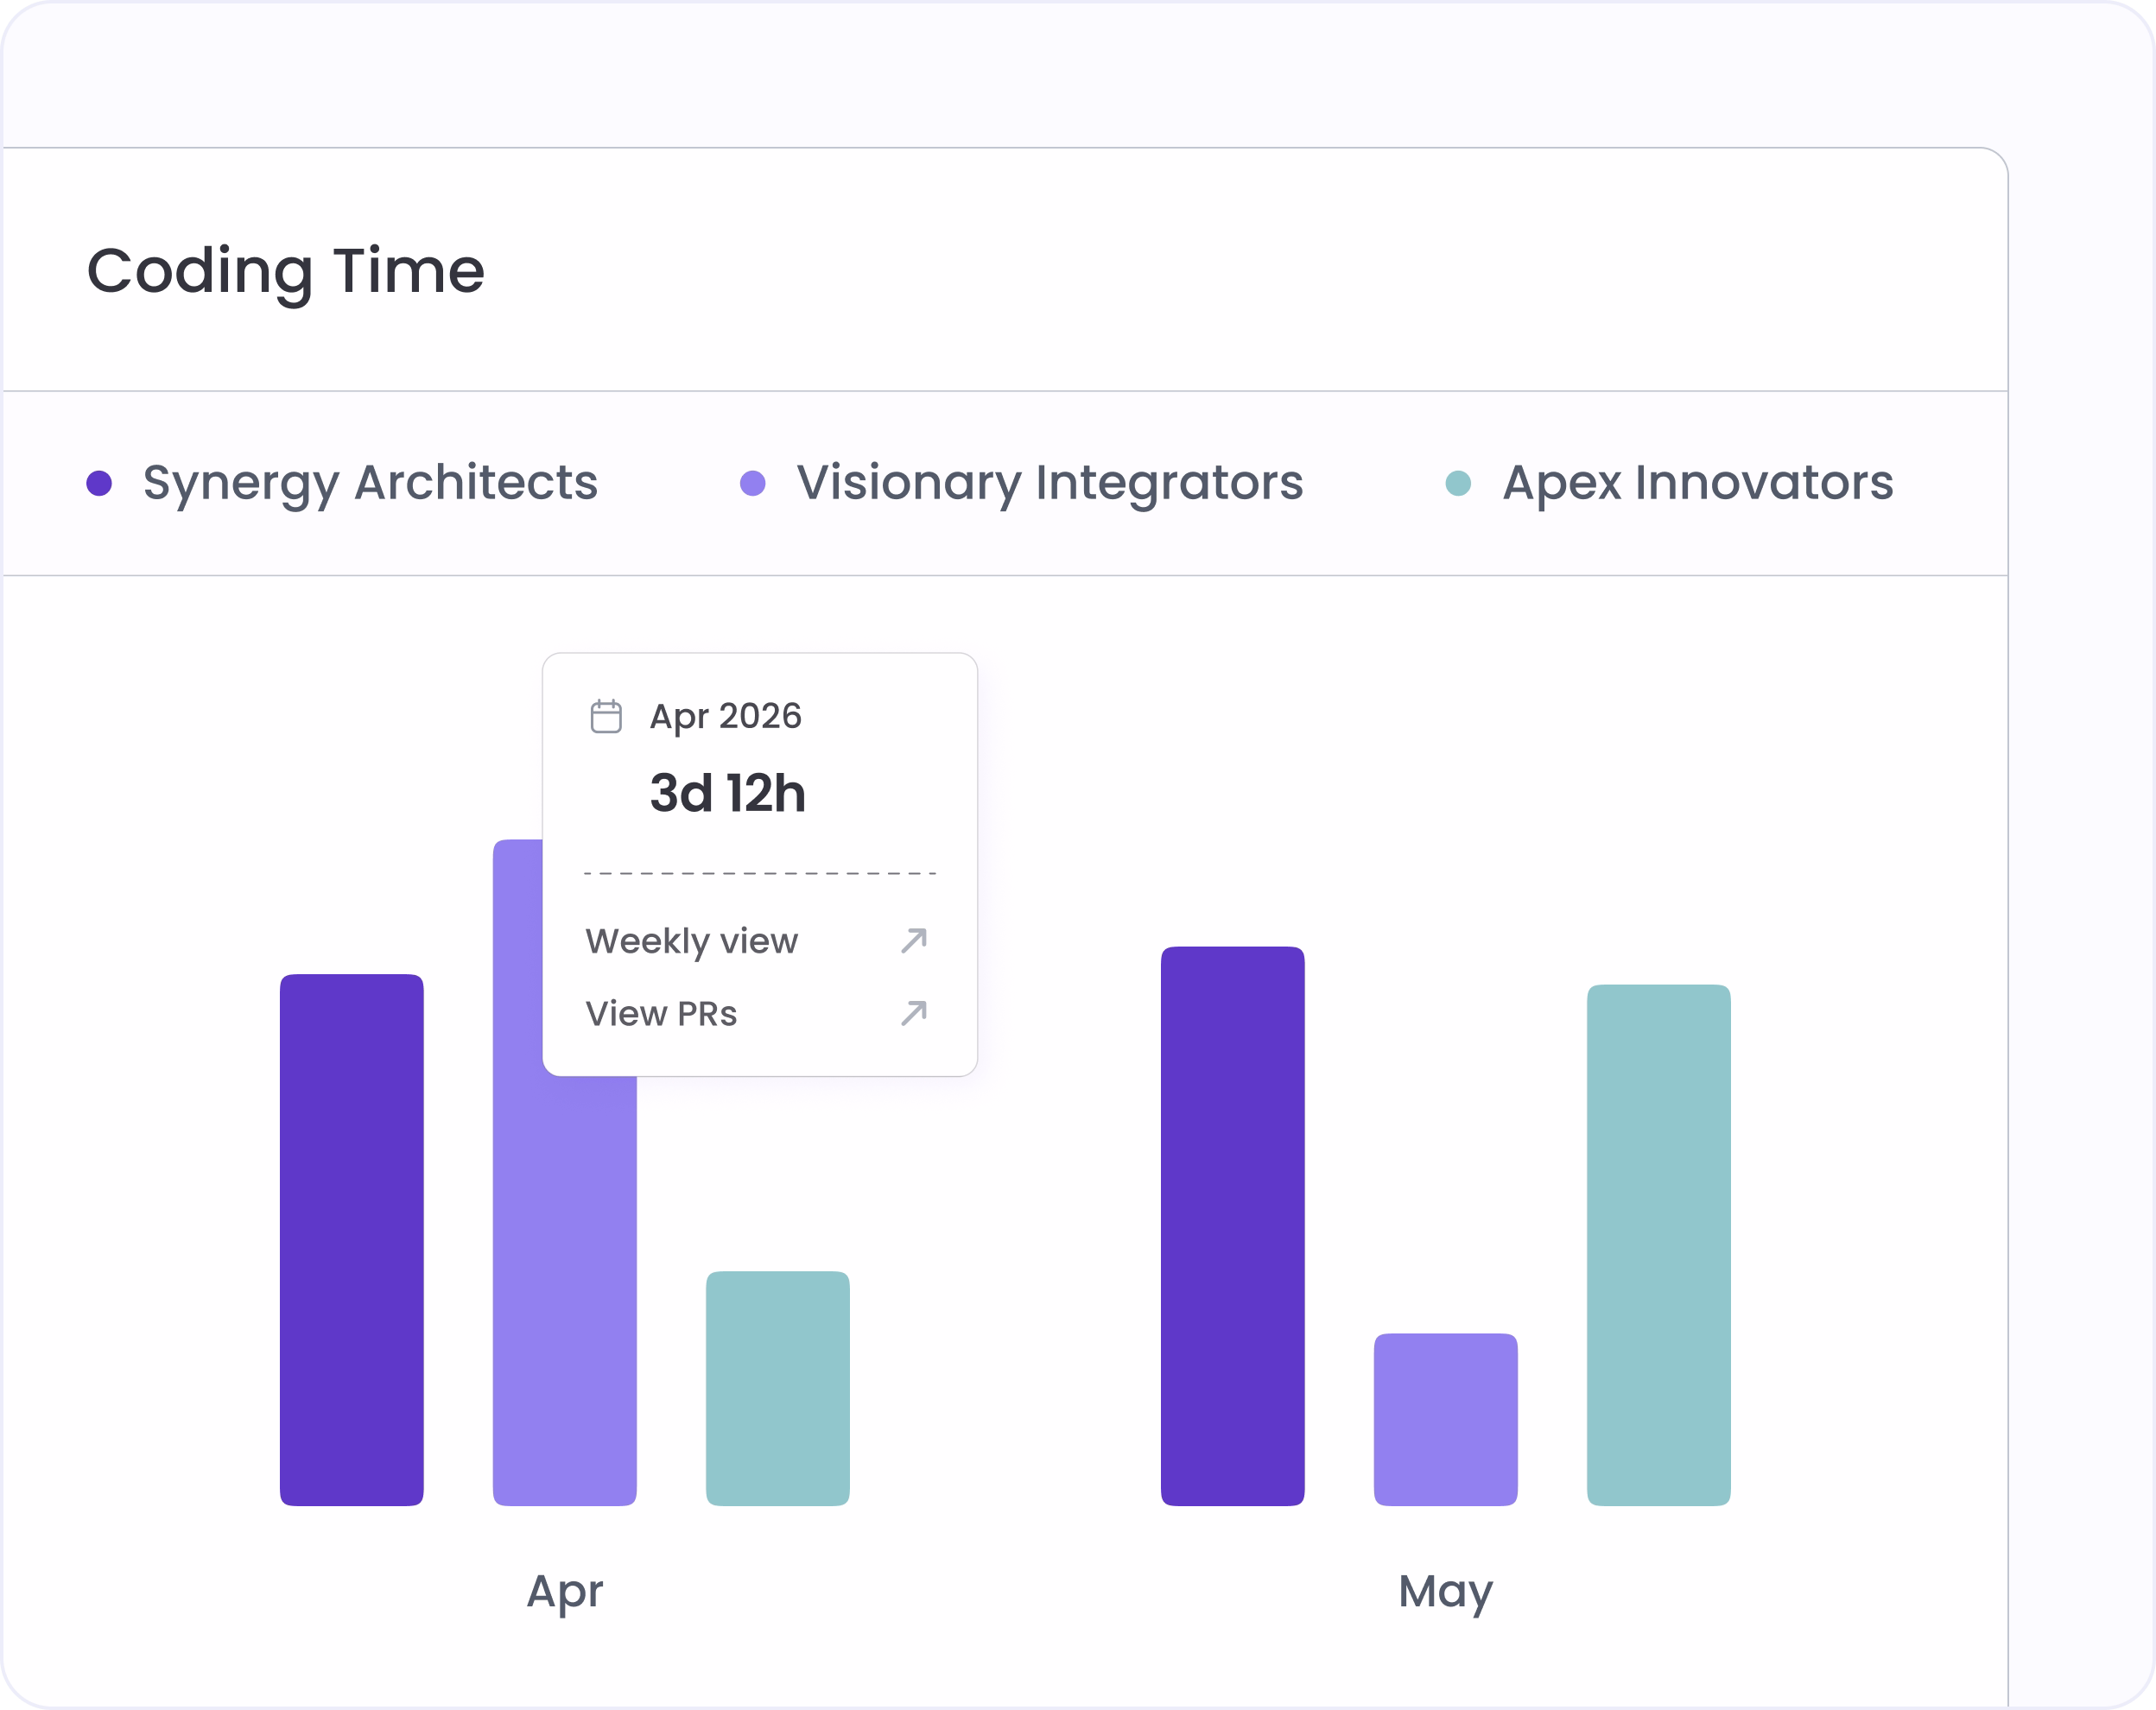
When something looks wrong in the quarterly numbers, drill into the sprint, then the individual PRs behind the spike, without leaving the screen. Three days of back-and-forth, compressed to one session.
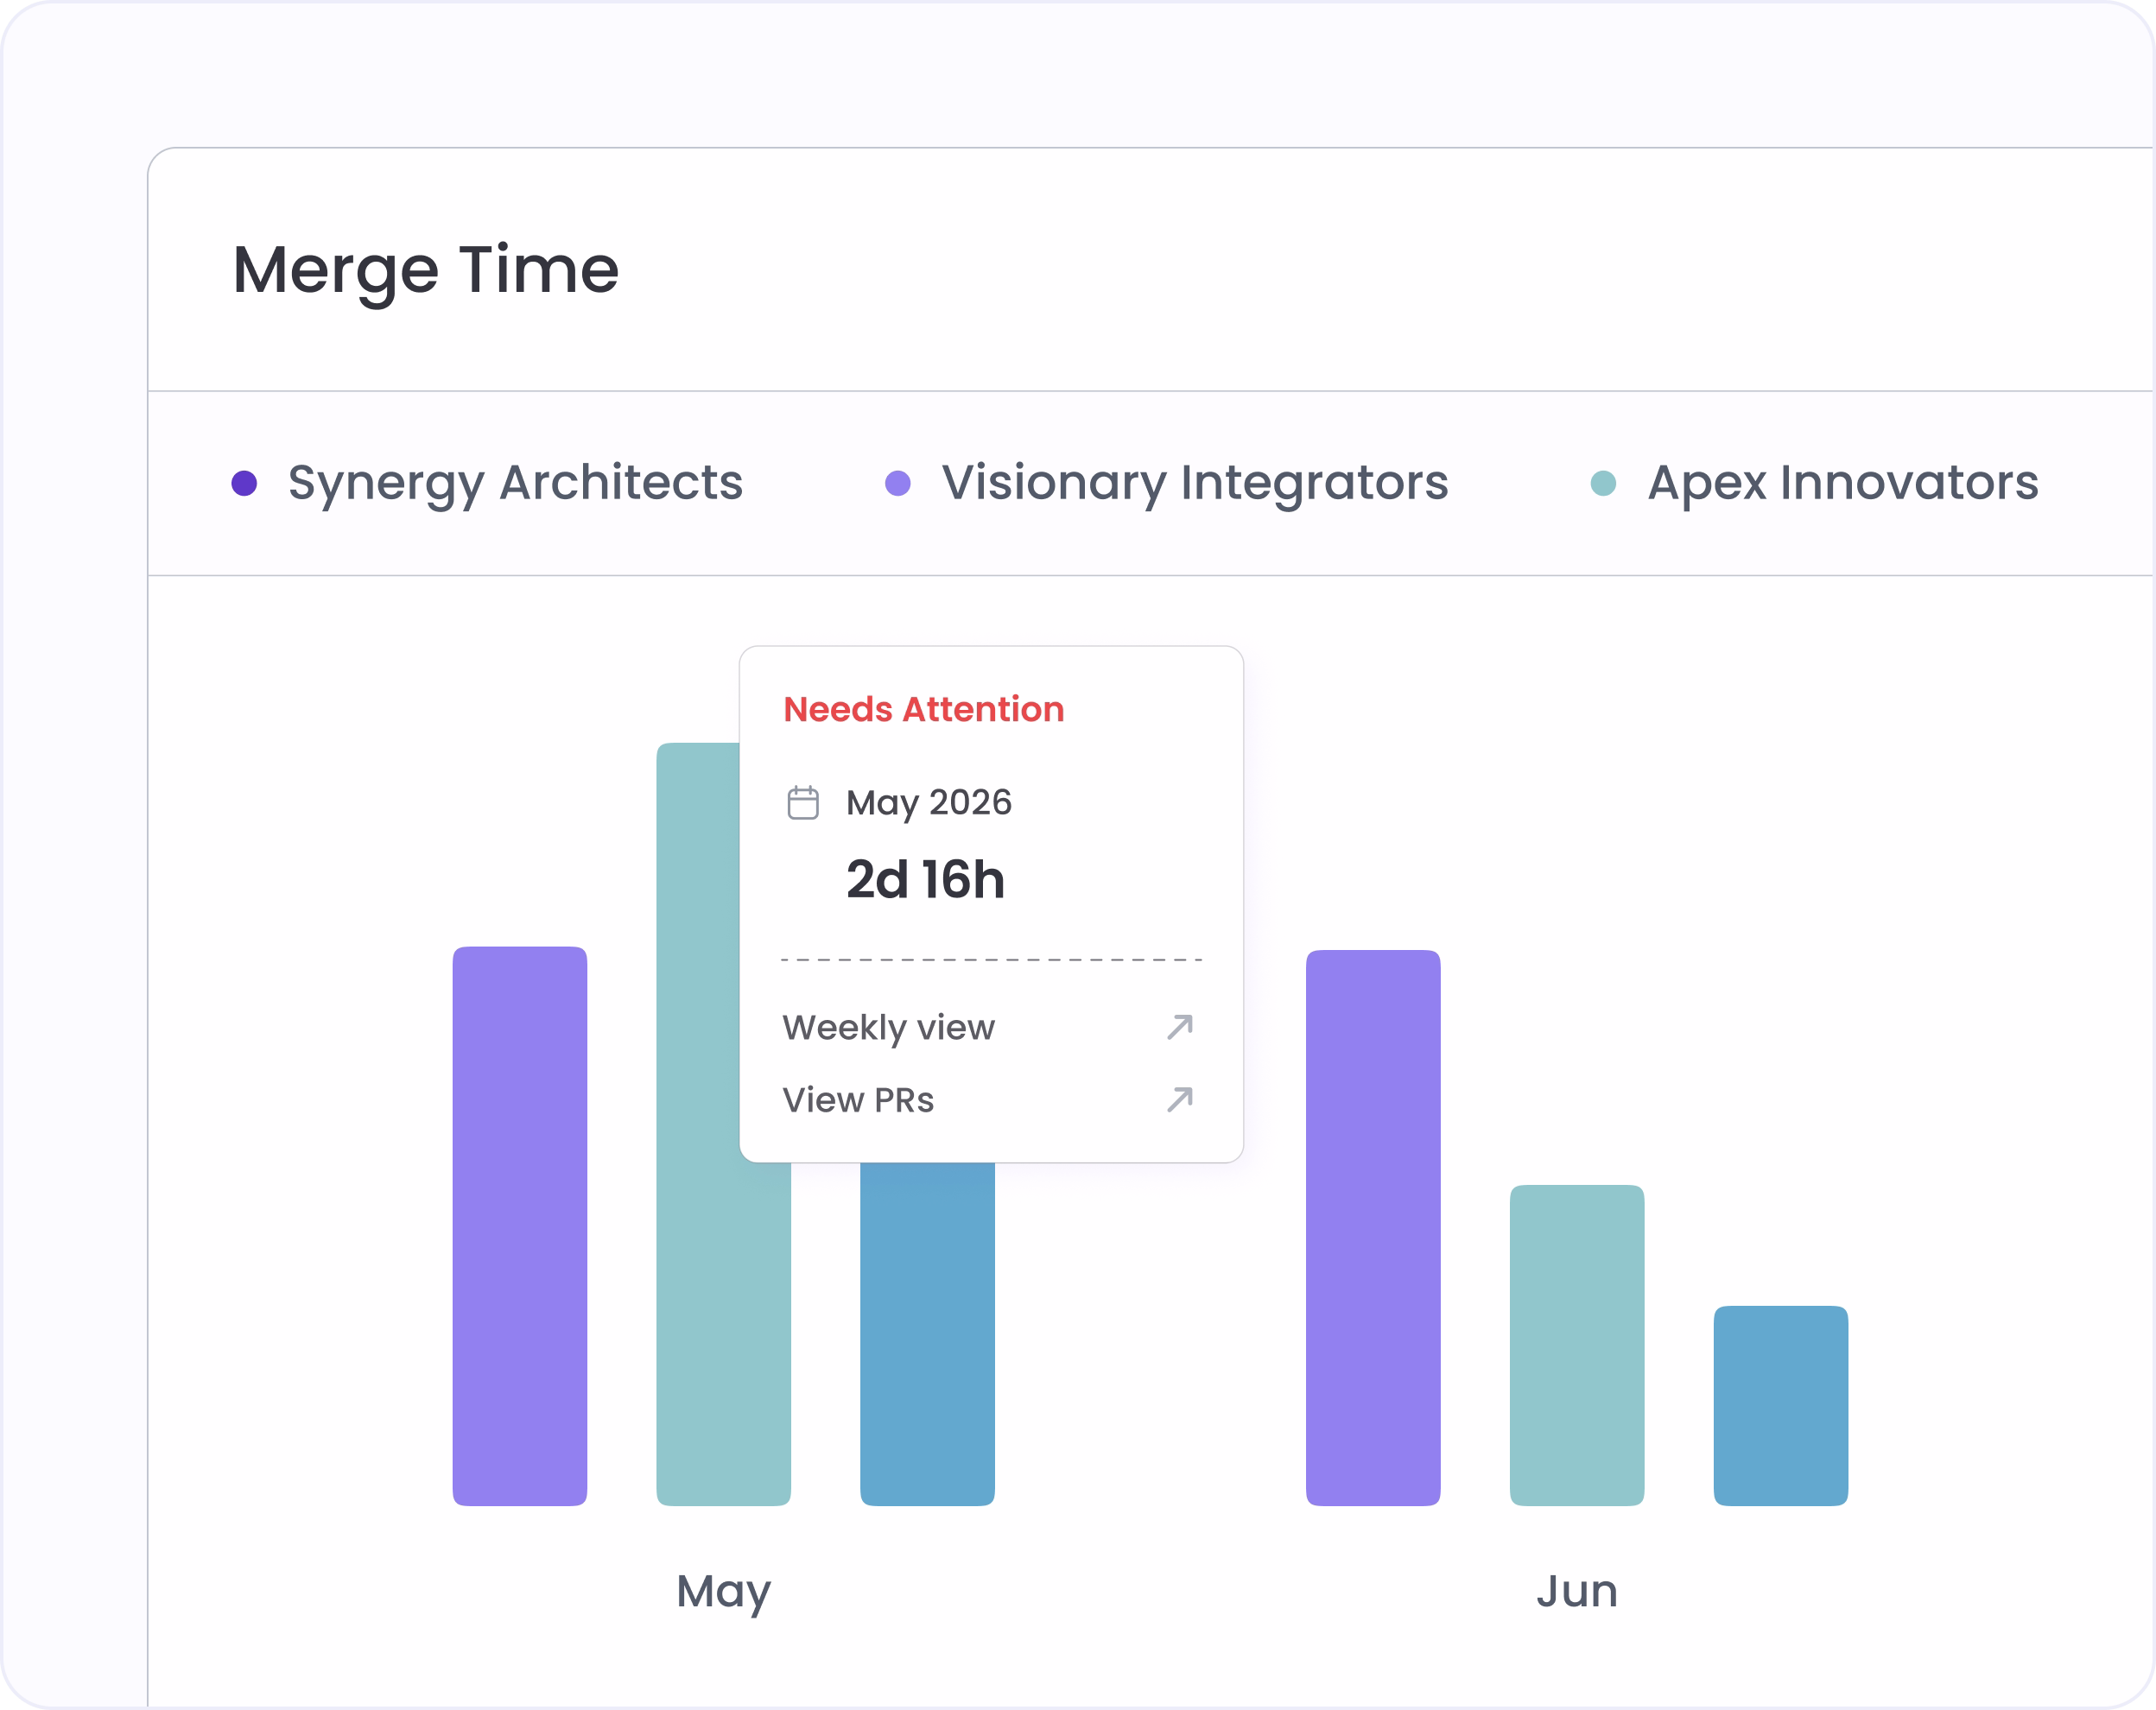
In an org of eight teams, the ones needing attention are rarely the loudest. Cockpit puts every team on the same metrics and time window, so coaching and resources go where the data points.
Set team, repo, and date range once. Save the filter, copy the URL, share it. Your next review starts where you left off.
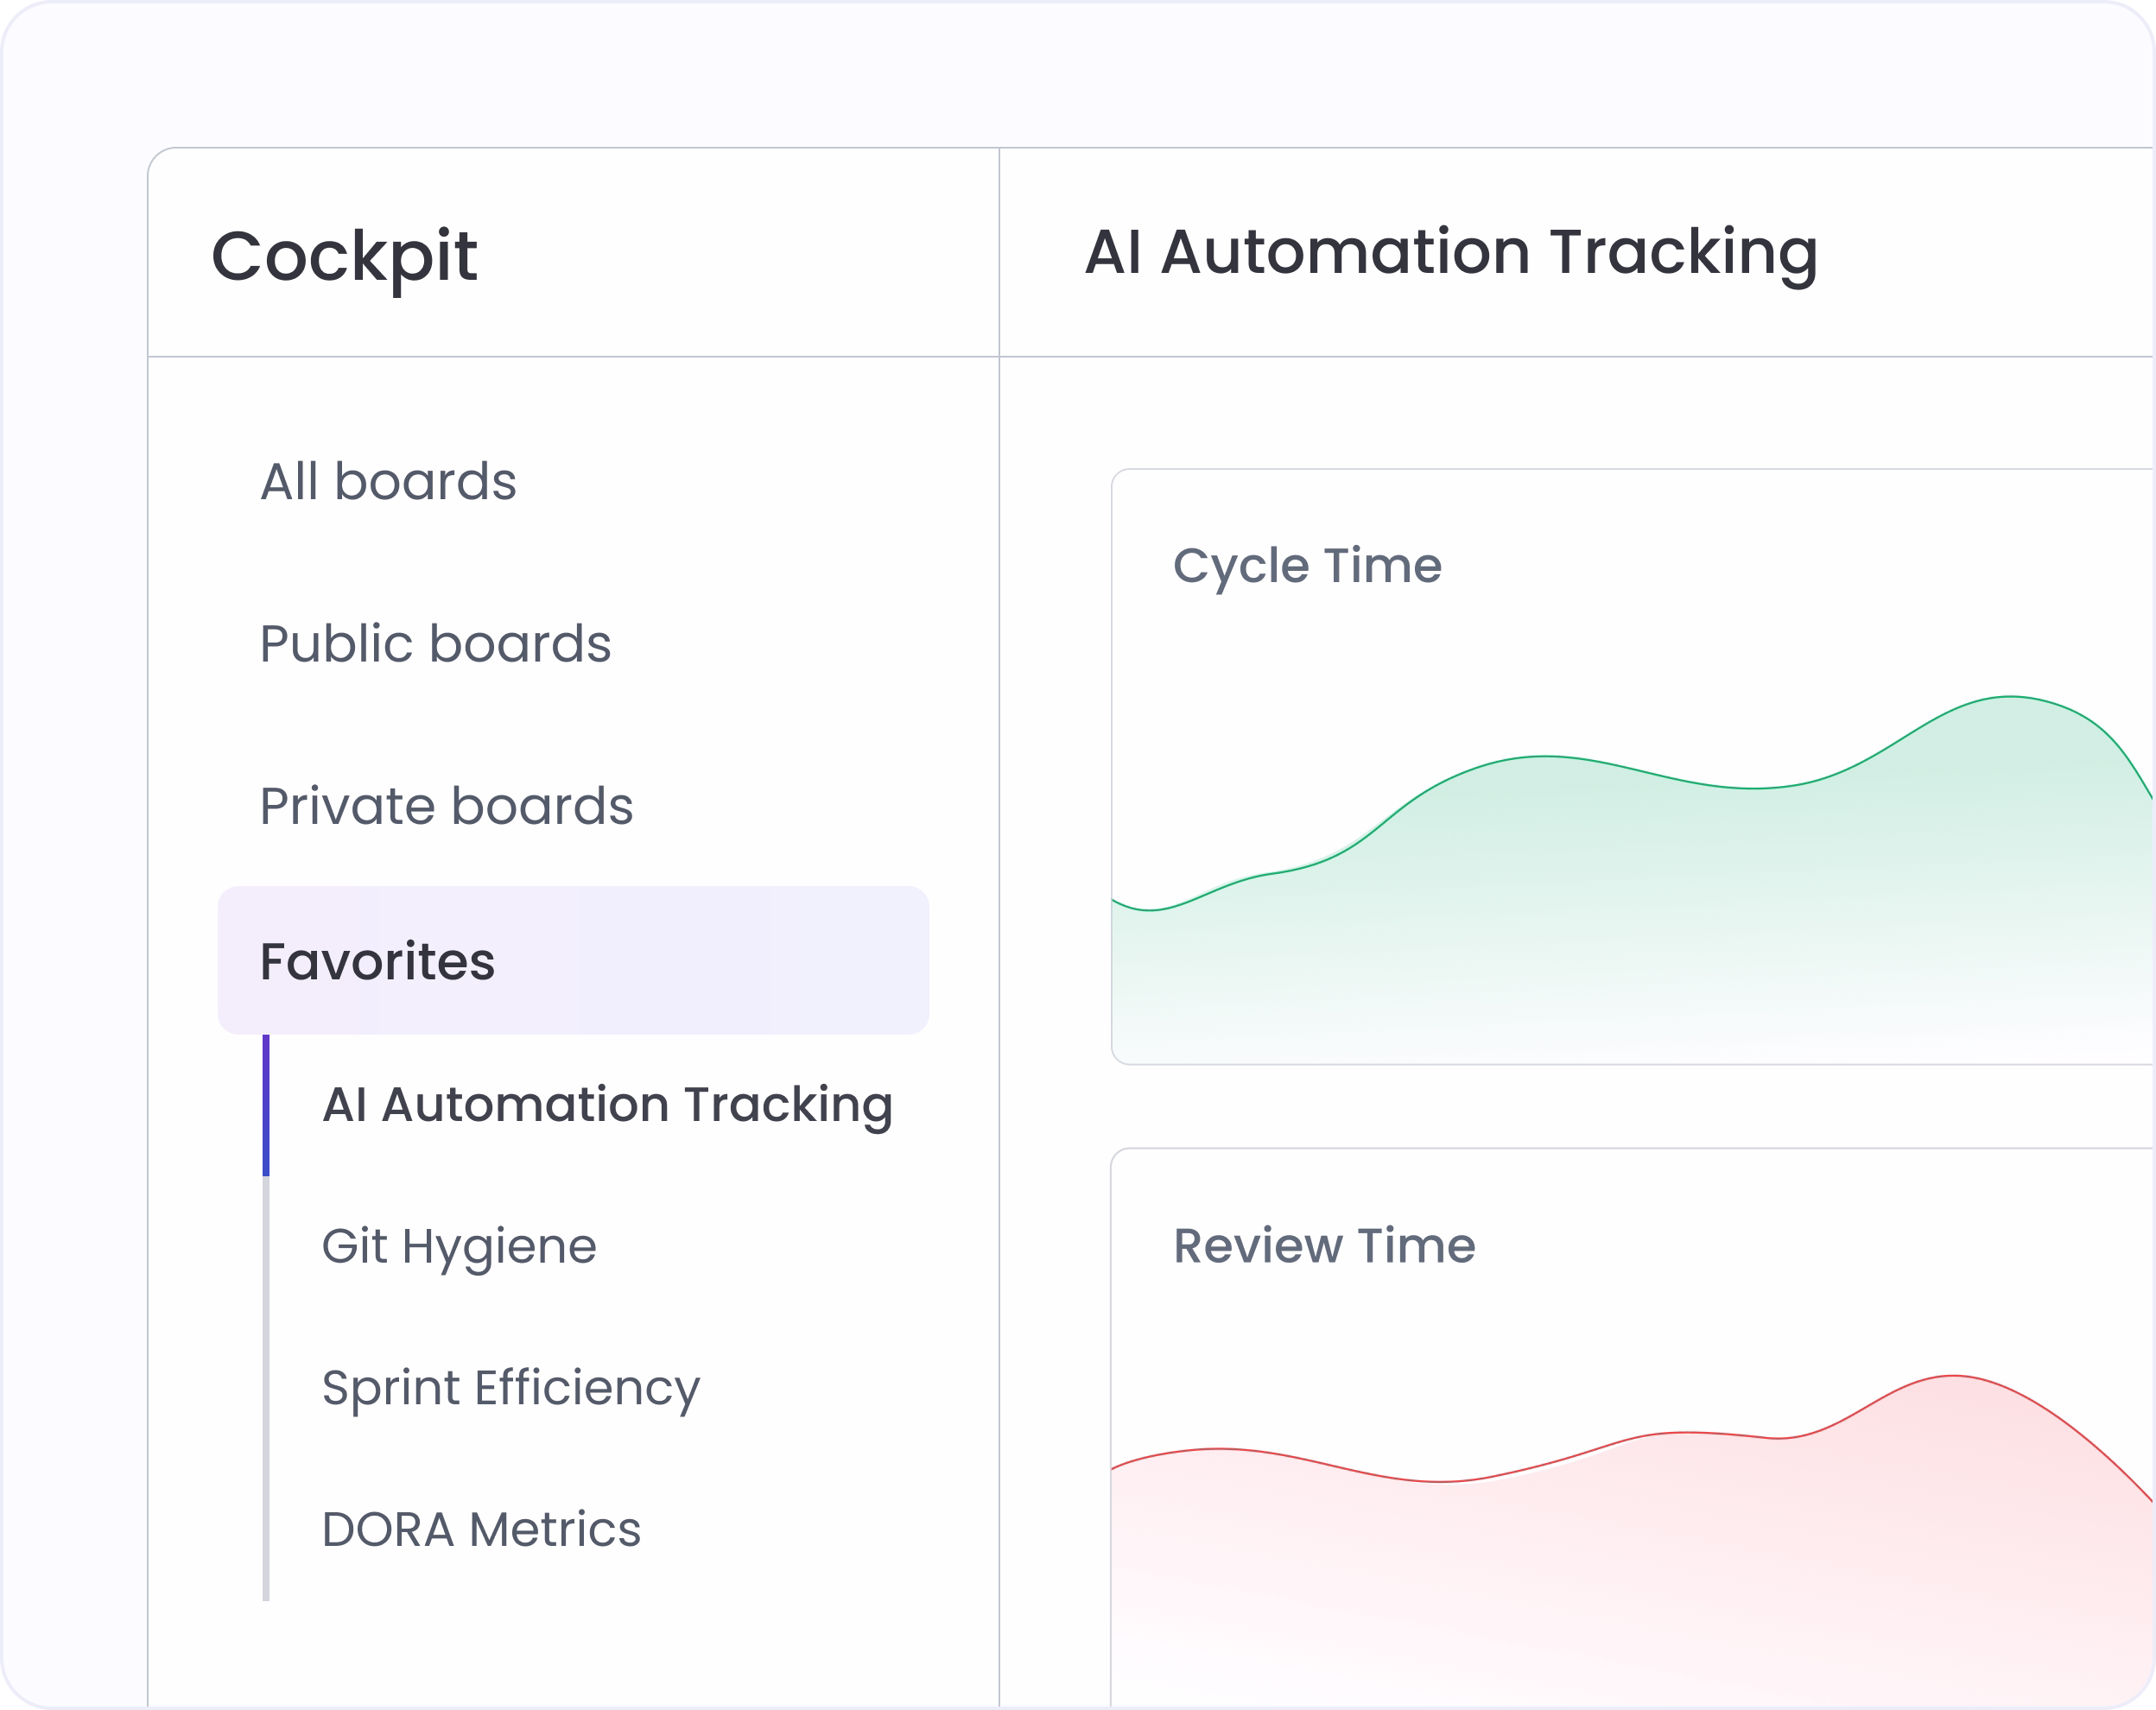
Public boards stay visible org-wide. Private boards stay with you. Only the owner can edit, so shared boards stay intact.
One click puts Cockpit on the big screen during leadership stand-ups. No browser fiddling, no screen-share fumbling.
Export any chart as an image for board decks, leadership reviews, or async updates. Always one click away.
Most teams have their first board live within 30 minutes of connecting their tools. Hivel pulls directly from GitHub, GitLab, Jira, and Linear. No manual data entry.
No. Cockpit ships with Hivel-provided templates covering delivery health, team throughput, AI impact, and more. Open one and you see real data immediately. Build custom boards when you're ready.
CTOs and VPs use org-level boards for leadership reviews and board prep. Directors and EMs build scoped boards for their teams and repos. Every role gets a view relevant to the decisions they're making.


.svg)
.png)