The SURGE FRAMEWORK

AI suggests a lot of code. Measure what actually shipped.

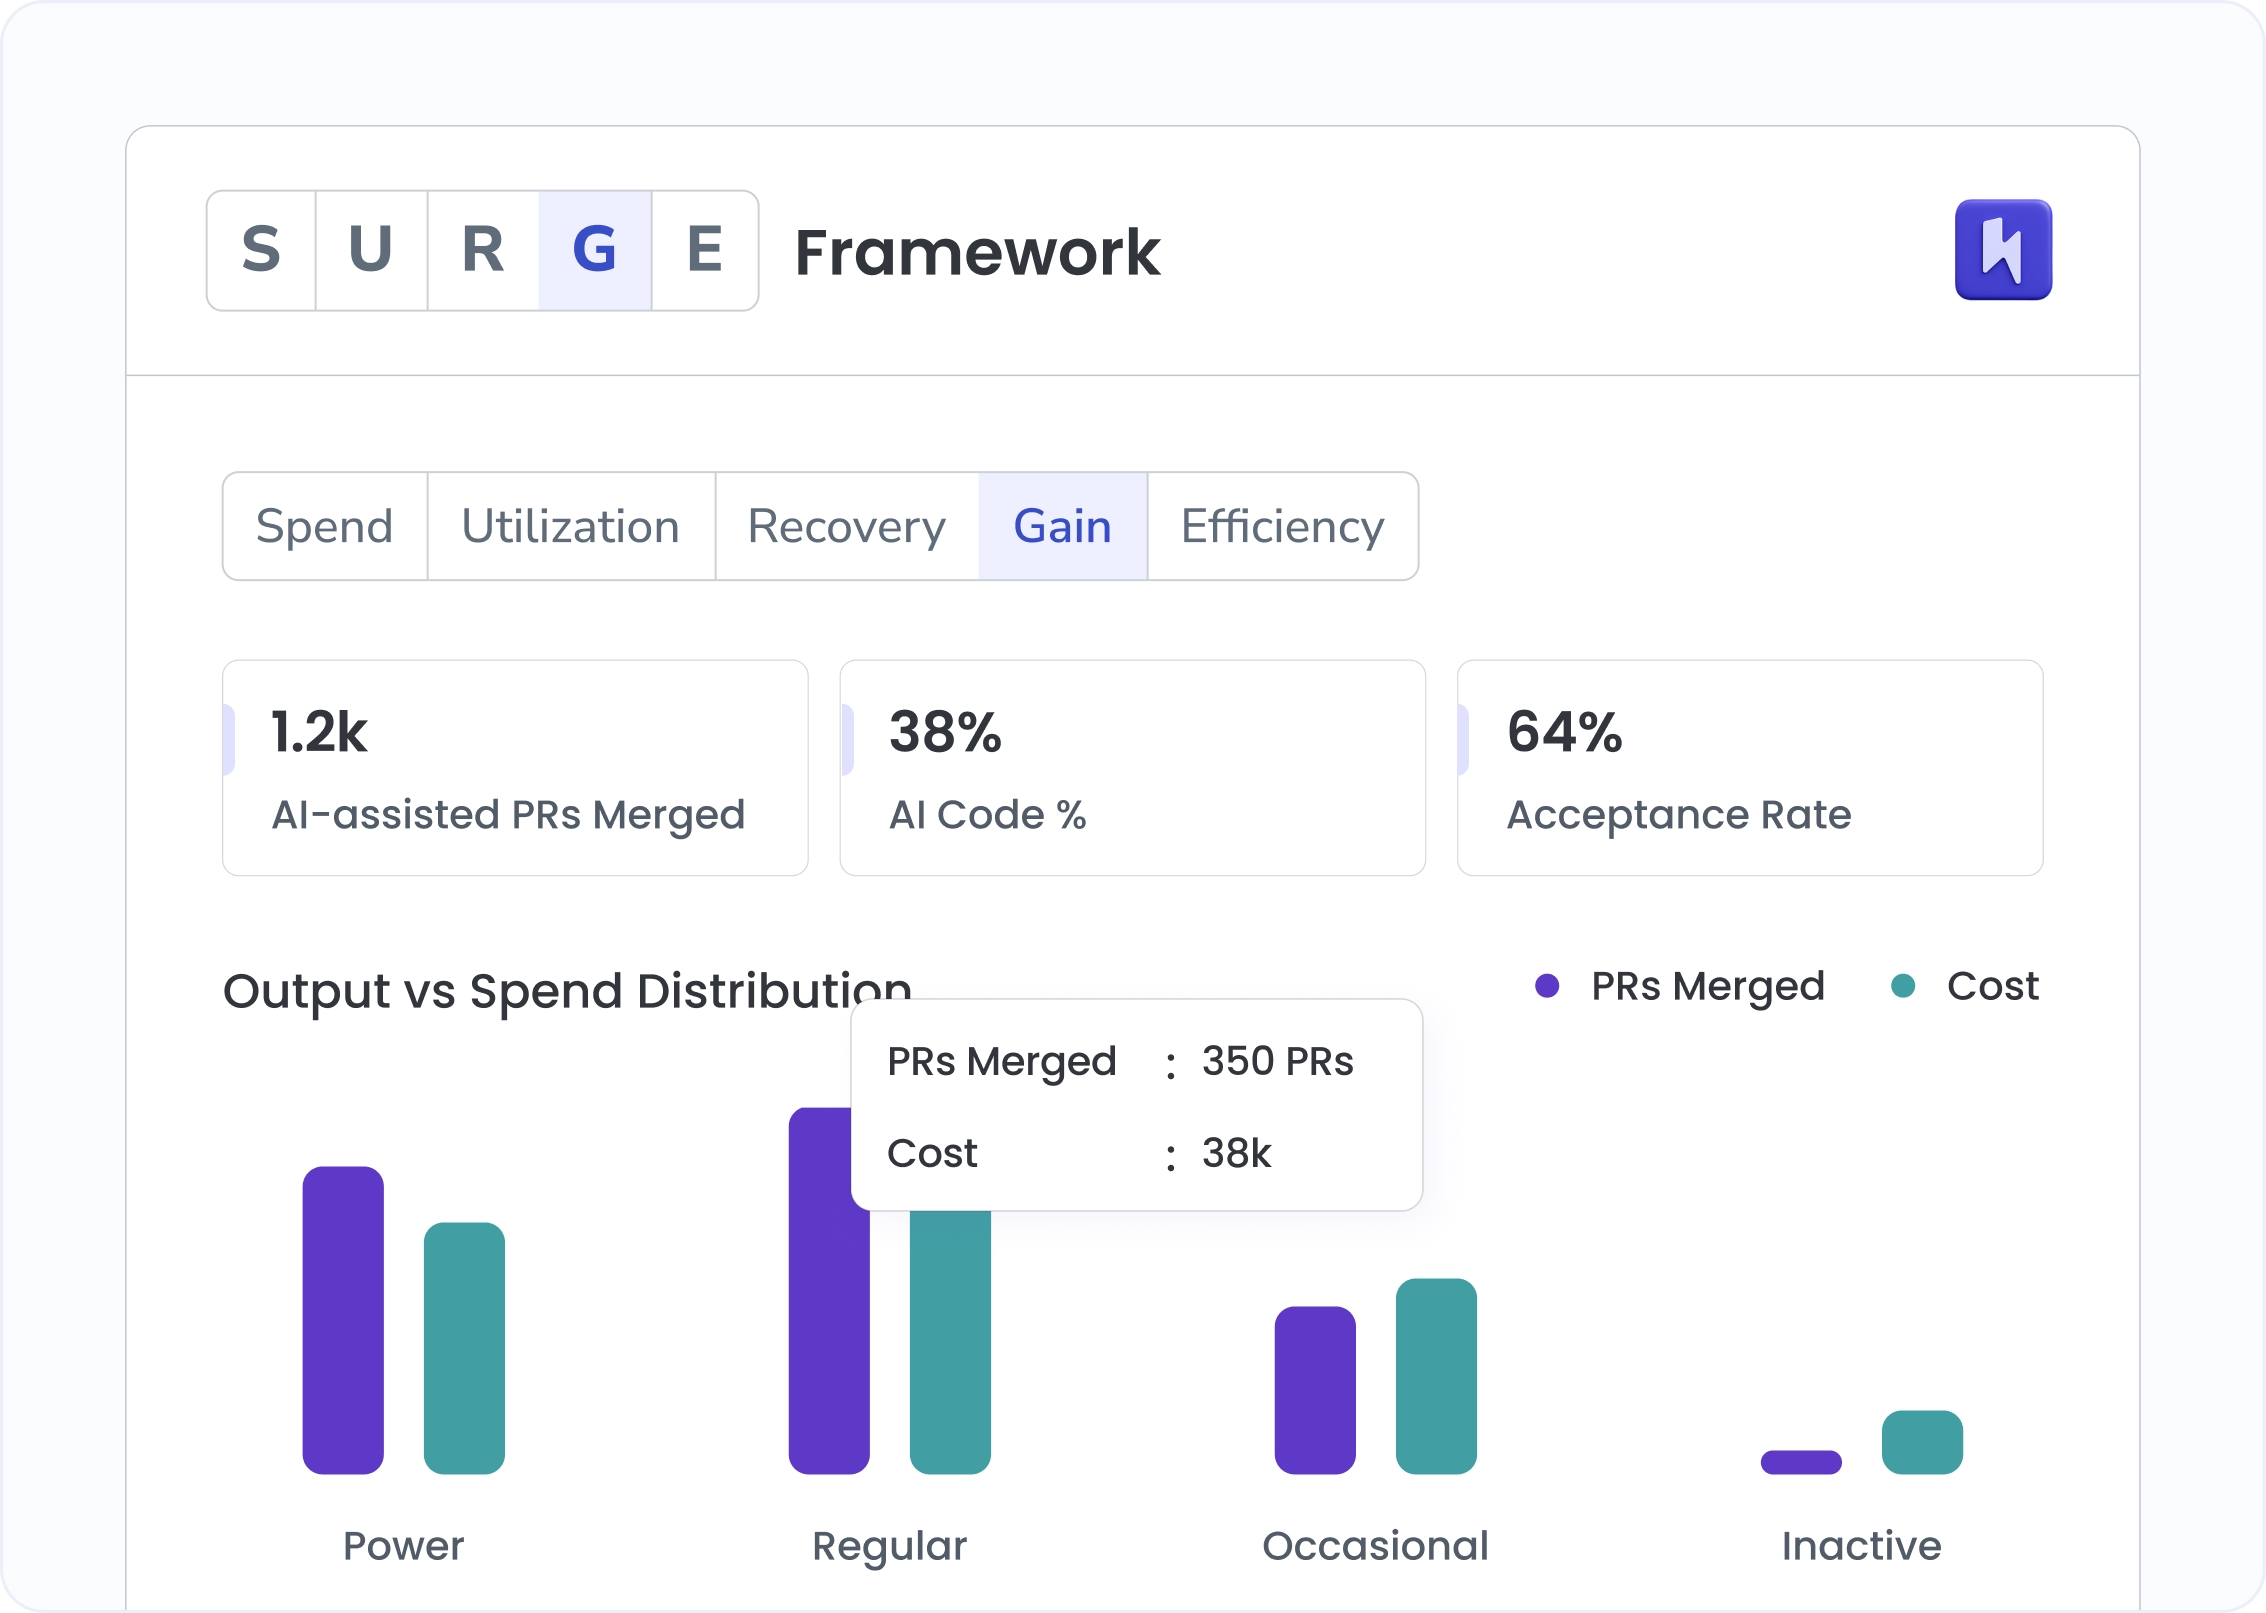
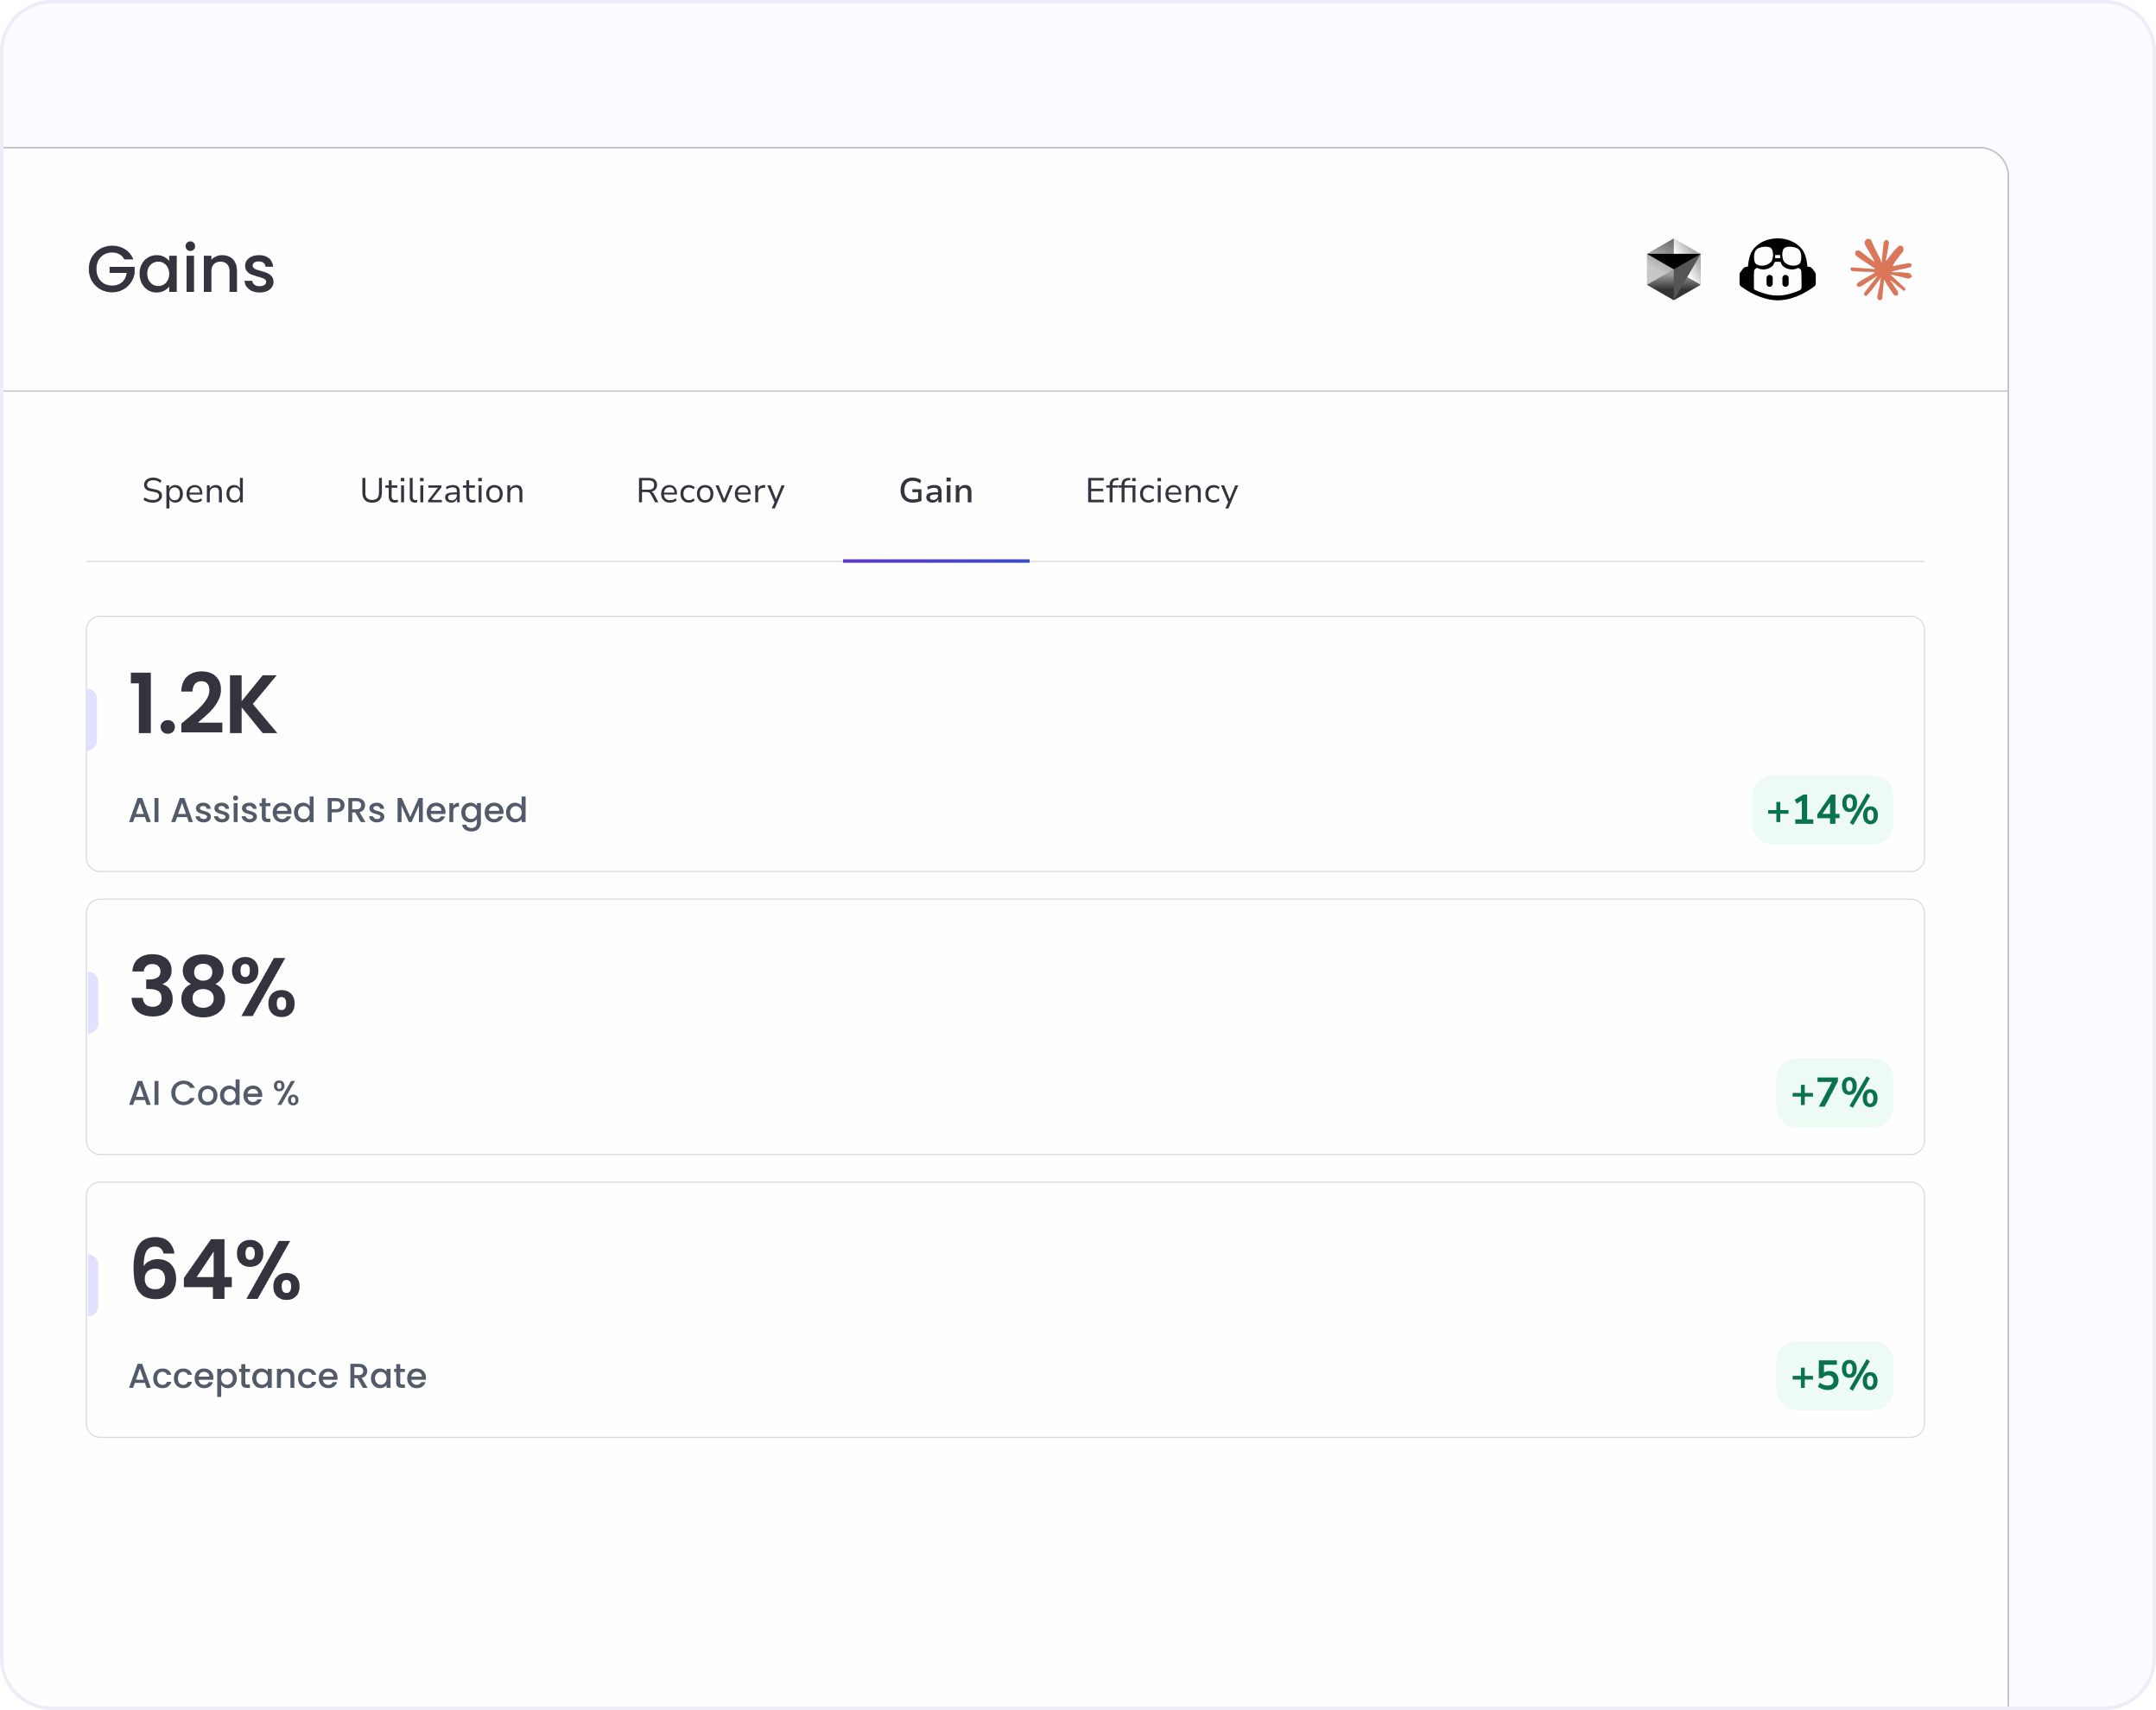
Gains shows AI-assisted PRs merged, AI code percentage, and acceptance rate from real production data. Skip the IDE counters and survey estimates. Measures what reached production and what each delivered change actually cost.

The problem

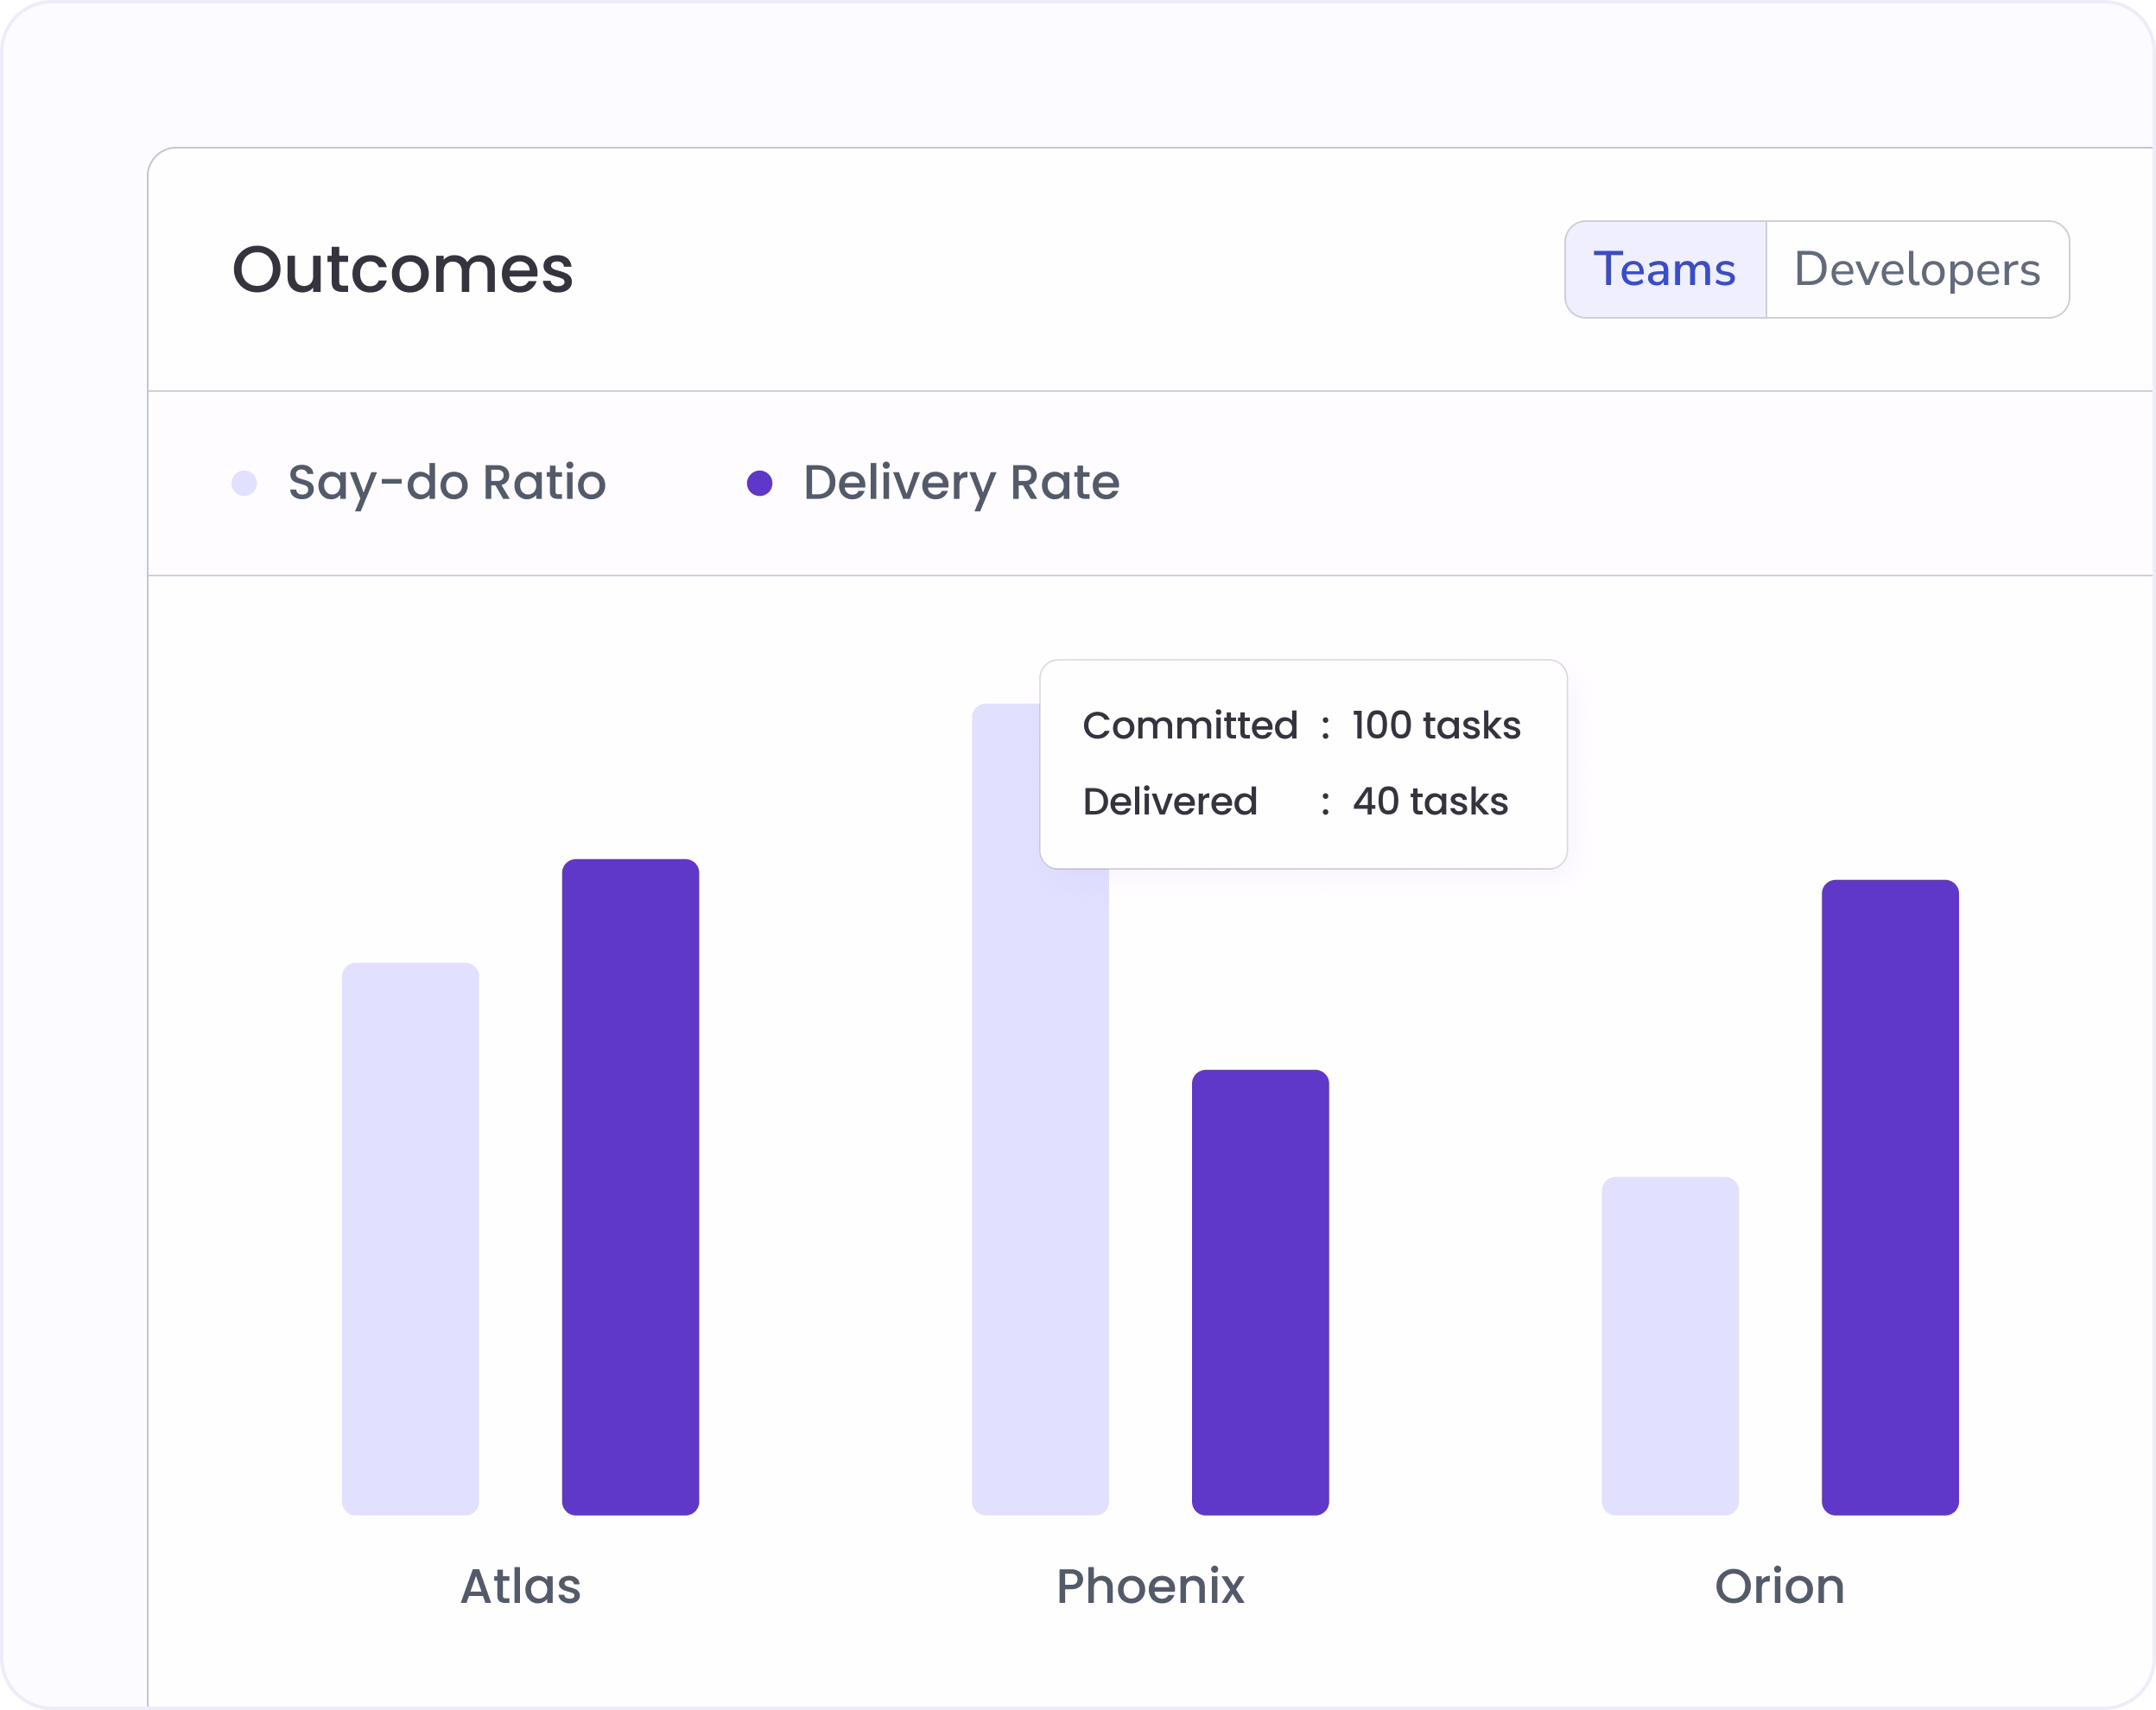
AI suggestions accepted. AI suggestions deleted. The gap is your real Gains number.

A developer accepts an AI suggestion in the IDE. By the time the PR ships, half of it has been rewritten. Vendor dashboards count the first event. The board cares about the second. Without merged-PR telemetry, AI ROI conversations run on the wrong number.

IDE acceptance is a vanity metric

A developer pressing Tab on an autocomplete is not the same as shipping the line to production. Acceptance rates from IDE plugins overstate AI's actual contribution by a factor most boards don't know.

Survey-based ROI cannot defend a renewal

Developer surveys say "AI saves me 30 minutes a day." That number multiplied across the team produces a confident ROI estimate. The estimate does not survive a serious finance review.

Power users get hidden inside team averages

Team-wide AI code percentage averages collapse the difference between Power users producing 60% AI-assisted PRs and Inactive seats producing zero. The team average tells you nothing about either.

The questions Jira reports can't answer. Investment Profile can.

AI-assisted PRs merged

Count the PRs that AI actually helped ship

Derived from actual codebase modifications rather than simple event logs. This delivers the definitive output metrics that executive teams require to validate engineering capital investments and prove true business impact.

Output vs spend

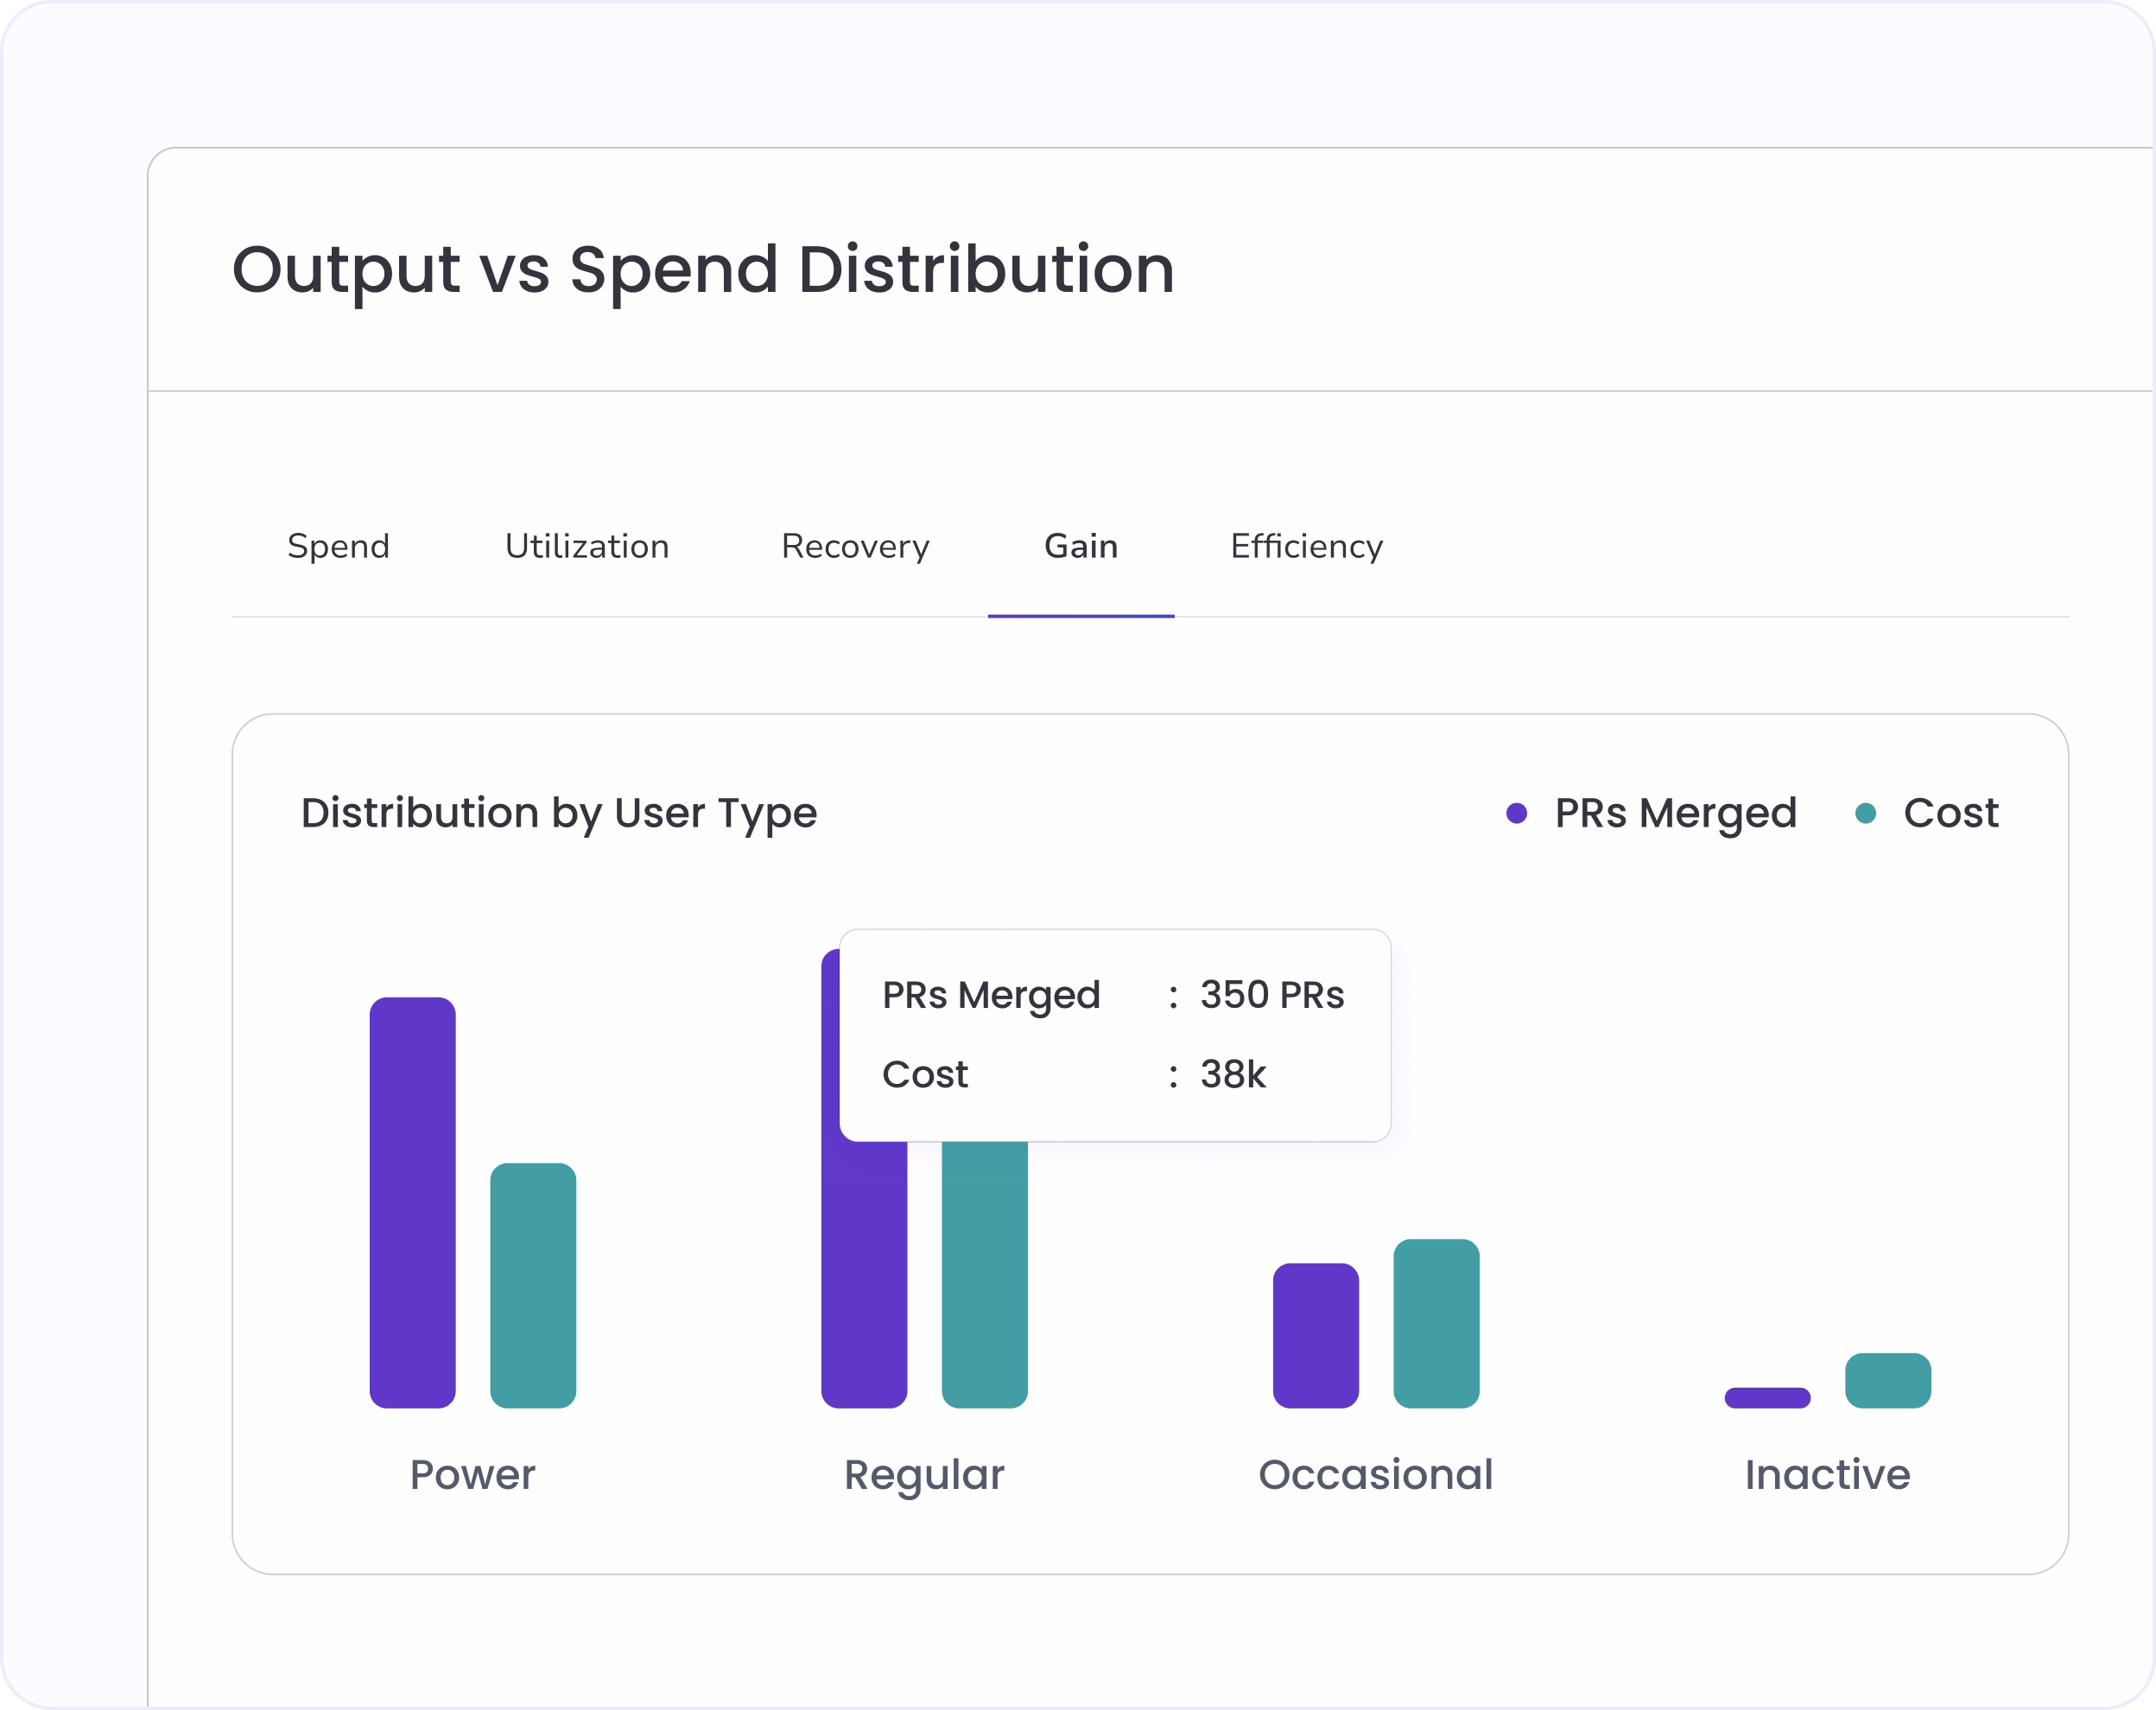
See where AI spend converts into shipped code, and where it doesn't

The Output vs Spend maps seat license costs directly to code delivery to visualize true AI conversion efficiency. Identify high-efficiency cohorts driving down per-PR costs, and isolate idle seats burning budget to build a data-driven justification for contract renewals.

Team-level attribution

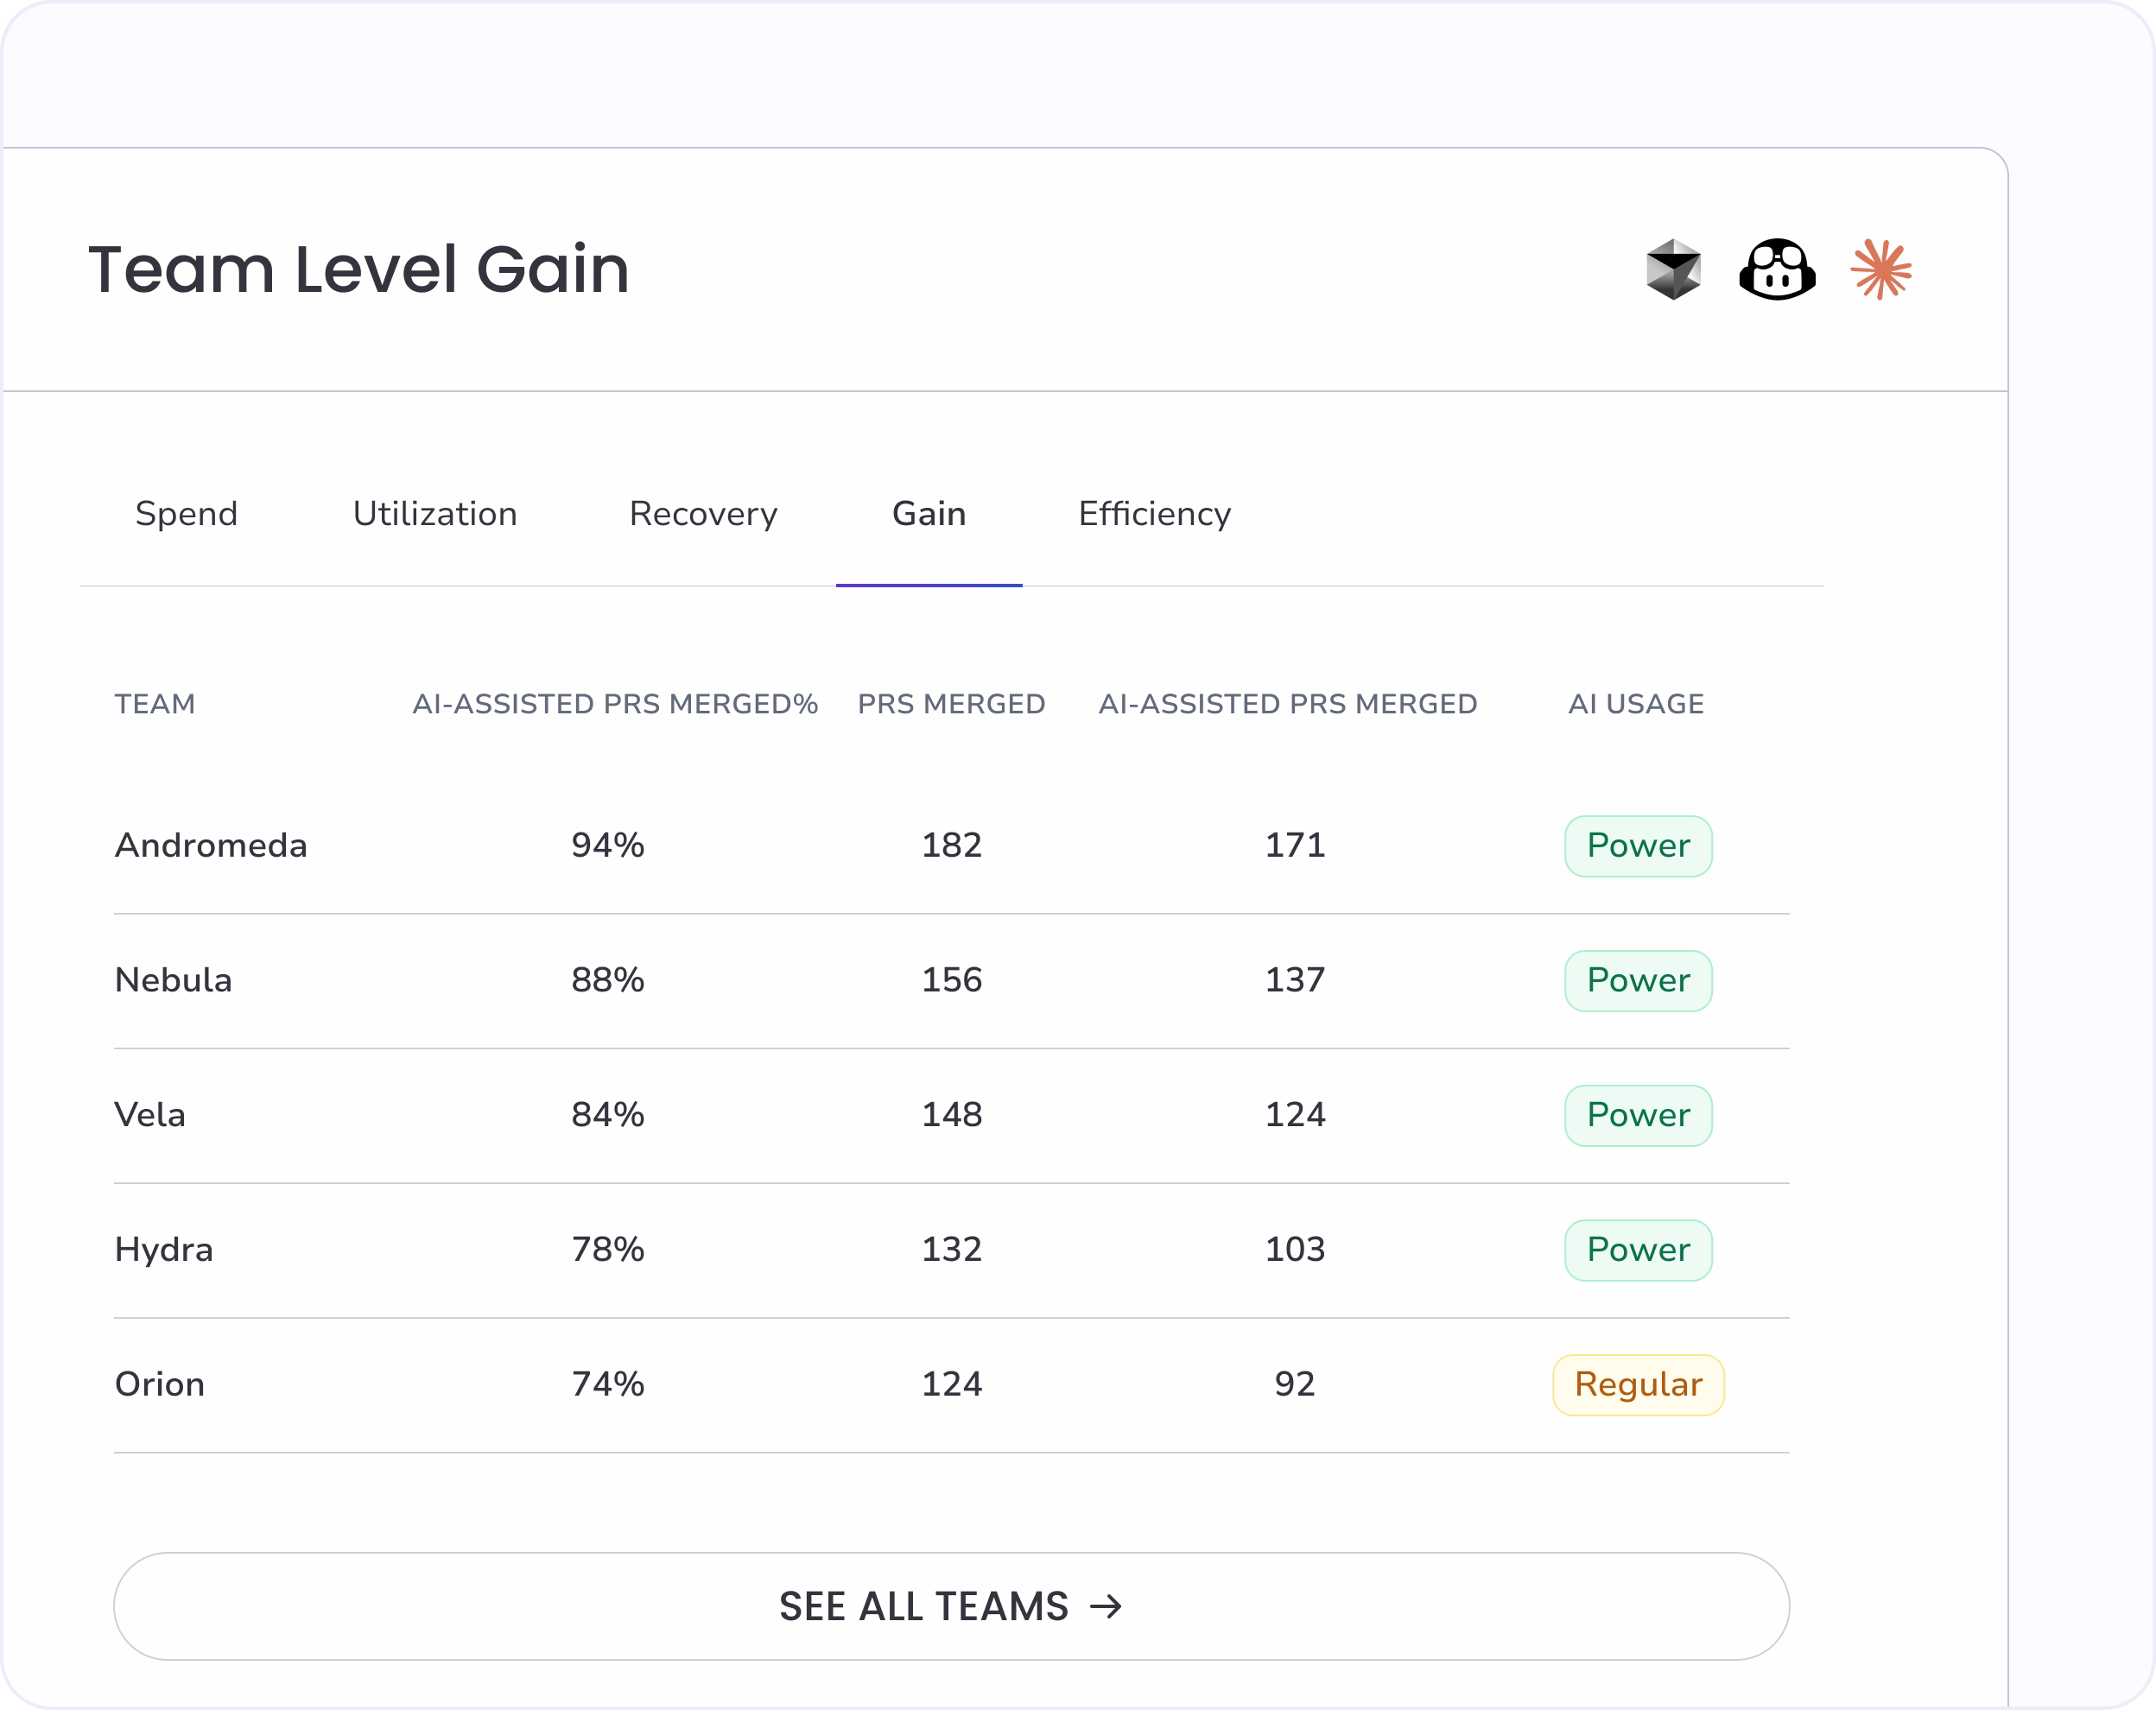
Identify which teams turn AI into production code

Track how effectively different engineering teams translate AI investments into final merged outputs. This team-level overview highlights your highest-velocity cohorts, detailing exact merge volumes and assistance rates to build a repeatable blueprint for organization-wide adoption.

Investment outcomes

Tie AI output to engineering goals and roadmap delivery

AI-assisted code is one signal. Whether engineering goals are being hit, sprint commitments delivered, and roadmap features shipped is the conversation that follows. The Gains pillar connects AI output to Investment Profile and Goals so the board sees what AI produced in terms business outcomes can audit.

Production-grade measurement of what AI actually shipped.

AI Code Telemetry

Detect AI-generated code in merged PRs from Copilot, Cursor, Claude, and code pasted from chat tools. Tool-agnostic measurement without IDE plugins.

Usage cohort attribution

Separate Power, Regular, Occasional, and Inactive user contributions to AI-assisted output. Spot where the real Gains come from.

Investment Profile integration

Tie AI-assisted code to specific initiatives, sprints, and epics. See which strategic programs AI is accelerating most.

Engineering goals tracking

Track engineering goals quarter over quarter alongside AI output. Show the board whether AI investment is moving the metrics that matter.

Frequently asked questions

How does Hivel detect AI-generated code in merged PRs?

Hivel's AI Code Telemetry analyzes merged PR diffs to detect AI-generated patterns. The detection covers Copilot, Cursor, Claude Code, and code pasted from chat tools like ChatGPT. No IDE plugin required, which means coverage is complete and tool-agnostic.

Can we see AI output tied to specific epics or initiatives?

Yes. Hivel's Investment Profile integration maps AI-assisted PRs to Jira epics, initiatives, and projects. See which strategic programs AI is accelerating most, and which roadmap areas AI hasn't moved at all.

What's the difference between Acceptance Rate and AI Code Percentage?

Acceptance Rate measures the percentage of AI suggestions developers accept in the moment, calculated from IDE event data. AI Code Percentage measures the share of code in merged PRs that was AI-generated, calculated from real diffs. The gap between them is where most AI ROI conversations go wrong.

How are Power, Regular, Occasional, and Inactive cohorts defined?

Hivel segments developers by AI usage frequency and depth. Power users use AI tools daily across multiple workflows. Regular users use them weekly. Occasional users use them less than once a week. Inactive seats are licensed but show near-zero activity. Cohort thresholds are configurable per organization.

Is our code stored?

No. Hivel analyzes commit and PR metadata with read-only access. Source code is never stored. AI detection runs on diff patterns and is discarded after analysis. SOC 2 Type II and ISO 27001 certified.

Trusted by 1000+ Engineering Teams

Vaibhav Bansal
V.P. Engineering
"Hivel has been phenomenal in helping us present our progress to leadership. Its insights into leading indicators have empowered our team leads to enhance review efficiency and ship features faster. Now, we are able to show the impact of our process changes, clearly identify areas of opportunity, and bring in a data-driven culture without spending time pulling manual reports."
Murali Swaminathan
Chief Technology Officer
"We were looking for a unique solution to understand engineering productivity and efficiency, with a single tool that could give leaders complete visibility. We evaluated other comparable tools, but none were comprehensive enough. When we came across Hivel, it checked all the boxes for measuring developer productivity across both AI and non-AI workflows."
Derek Mackie
Director of Engineering
"Using Hivel shone a light on the non-standard aspects of our work, emphasizing the need for crucial adjustments. The insights from Hivel helped us recognize areas for improvement, particularly in managing cycle times and streamlining development workflows. This guidance has been instrumental in our efforts to enhance operational efficiency and productivity."
Leonardo Pinheiro Ferrari
Chief Technology Officer
"Thanks to Hivel, we've seen a staggering 157% improvement in our deployment frequency. By identifying and addressing inefficiencies, and adopting best practices, we've significantly accelerated our progress. Hivel has been instrumental in our journey to operational excellence."
Chris Callander
Senior Engineering Manager
"Hivel has been instrumental in identifying areas for enhancement and guiding our strategic improvements. It has significantly contributed to our journey toward greater operational efficiency. The Activity and Dev360 features in Hivel have been particularly valuable for providing feedback to engineers during 1-1's, enhancing our communication and development practices."
Shiro Theuri
Chief Technology Officer
"Before Hivel, understanding our engineering team's dynamics was a game of guesswork. Now, with Hivel's clear dashboards and insights, our leaders have the clarity and time-saving tools they need to excel. It's been transformative in streamlining our operations."
Koti Reddy
Chief Technology Officer
"Incorporating Hivel into our daily operations has been a game-changer. It's not just a tool; it's a part of our strategic decision-making process, trusted by our leaders at every level. The impact on our engineering efficiency is undeniable and deeply valued."
Manoj Awasthi
Chief Technology Officer
"It has been great to partner with Hivel to get access to insights that help leaders at all levels gain visibility into bottlenecks and challenges that the teams face, build actionable plan to resolve them and track the progress over time. And thanks for the fantastic support!"
Ameen M
Engineering Manager
"Hivel has made a huge difference to how I manage my teams. Before every one-on-one or appraisal, I rely on it to dive into developer metrics and drive truly meaningful conversations. It helps me spot rework patterns, reward high performers, and benchmark our teams even against our US counterparts. The dashboards are intuitive, insightful, and honestly far more actionable than anything we get from Jira."
Paras Sood
Associate Director
"Hivel's insights have been pivotal in refining our engineering processes, elevating both efficiency and the developer experience. We're now making smarter decisions, faster, thanks to Hivel."
Vaibhav Bansal
V.P. Engineering
"Hivel has been phenomenal in helping us present our progress to leadership. Its insights into leading indicators have empowered our team leads to enhance review efficiency and ship features faster. Now, we are able to show the impact of our process changes, clearly identify areas of opportunity, and bring in a data-driven culture without spending time pulling manual reports."
Murali Swaminathan
Chief Technology Officer
“We were looking for a unique solution to understand engineering productivity and efficiency, with a single tool that could give leaders complete visibility. We evaluated other comparable tools, but none were comprehensive enough. When we came across Hivel, it checked all the boxes for measuring developer productivity across both AI and non-AI workflows.”
Vaibhav Bansal
V.P. Engineering
"Hivel has been phenomenal in helping us present our progress to leadership. Its insights into leading indicators have empowered our team leads to enhance review efficiency and ship features faster. Now, we are able to show the impact of our process changes, clearly identify areas of opportunity, and bring in a data-driven culture without spending time pulling manual reports."
Derek Mackie
Director of Engineering
"Using Hivel shone a light on the non-standard aspects of our work, emphasizing the need for crucial adjustments. The insights from Hivel helped us recognize areas for improvement, particularly in managing cycle times and streamlining development workflows. This guidance has been instrumental in our efforts to enhance operational efficiency and productivity."
Leonardo Pinheiro Ferrari
Chief Technology Officer
"Thanks to Hivel, we've seen a staggering 157% improvement in our deployment frequency. By identifying and addressing inefficiencies, and adopting best practices, we've significantly accelerated our progress. Hivel has been instrumental in our journey to operational excellence."

"The only tool our entire leadership team actually trusts"