Get the full picture on your AI adoption and impact.

We'll show you exactly how AI is impacting your speed and code quality.

NO CODE ACCESS
FREE AI ROI REPORT
NO CREDIT CARD
4.7/5

Hivel Score

One number that tells you if engineering is actually getting better.

When AI tools enter the workflow, the easy metrics climb first. Without something that tracks speed, quality, and throughput together over time, you can't tell what's signal and what's noise.

A score out of 100. Every signal behind it. One view to run engineering.

Is engineering performing better this month than six months ago?

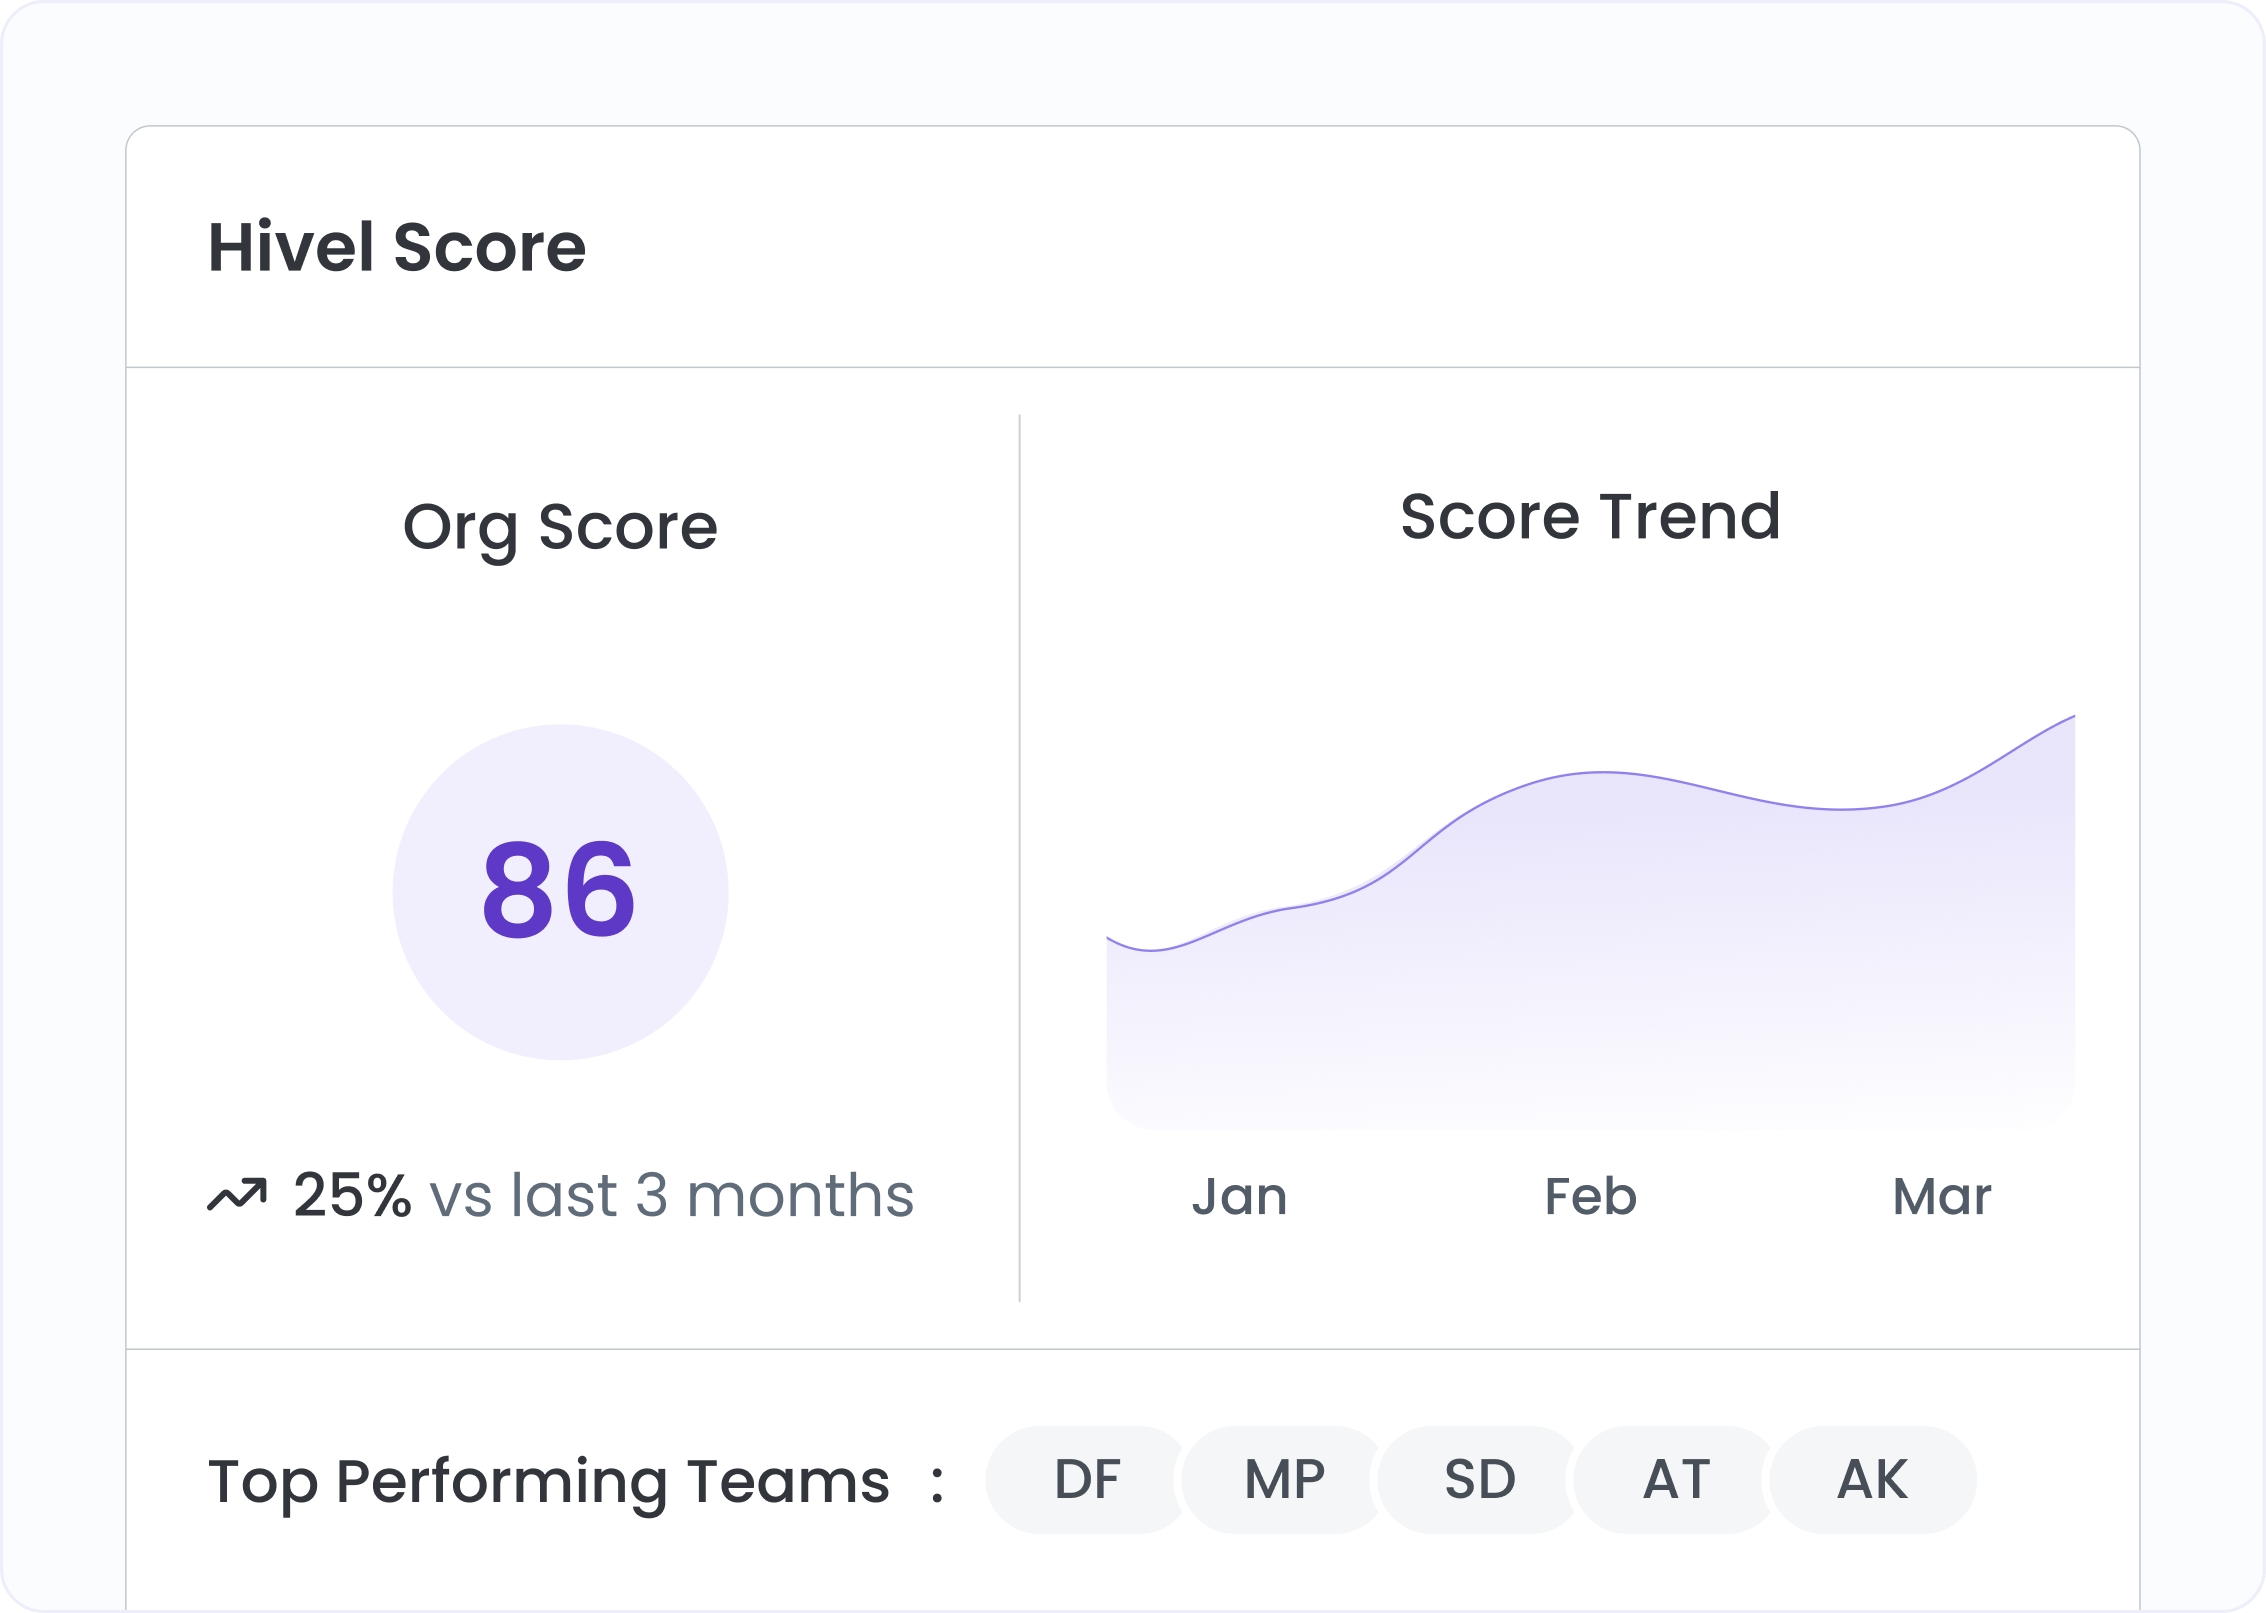
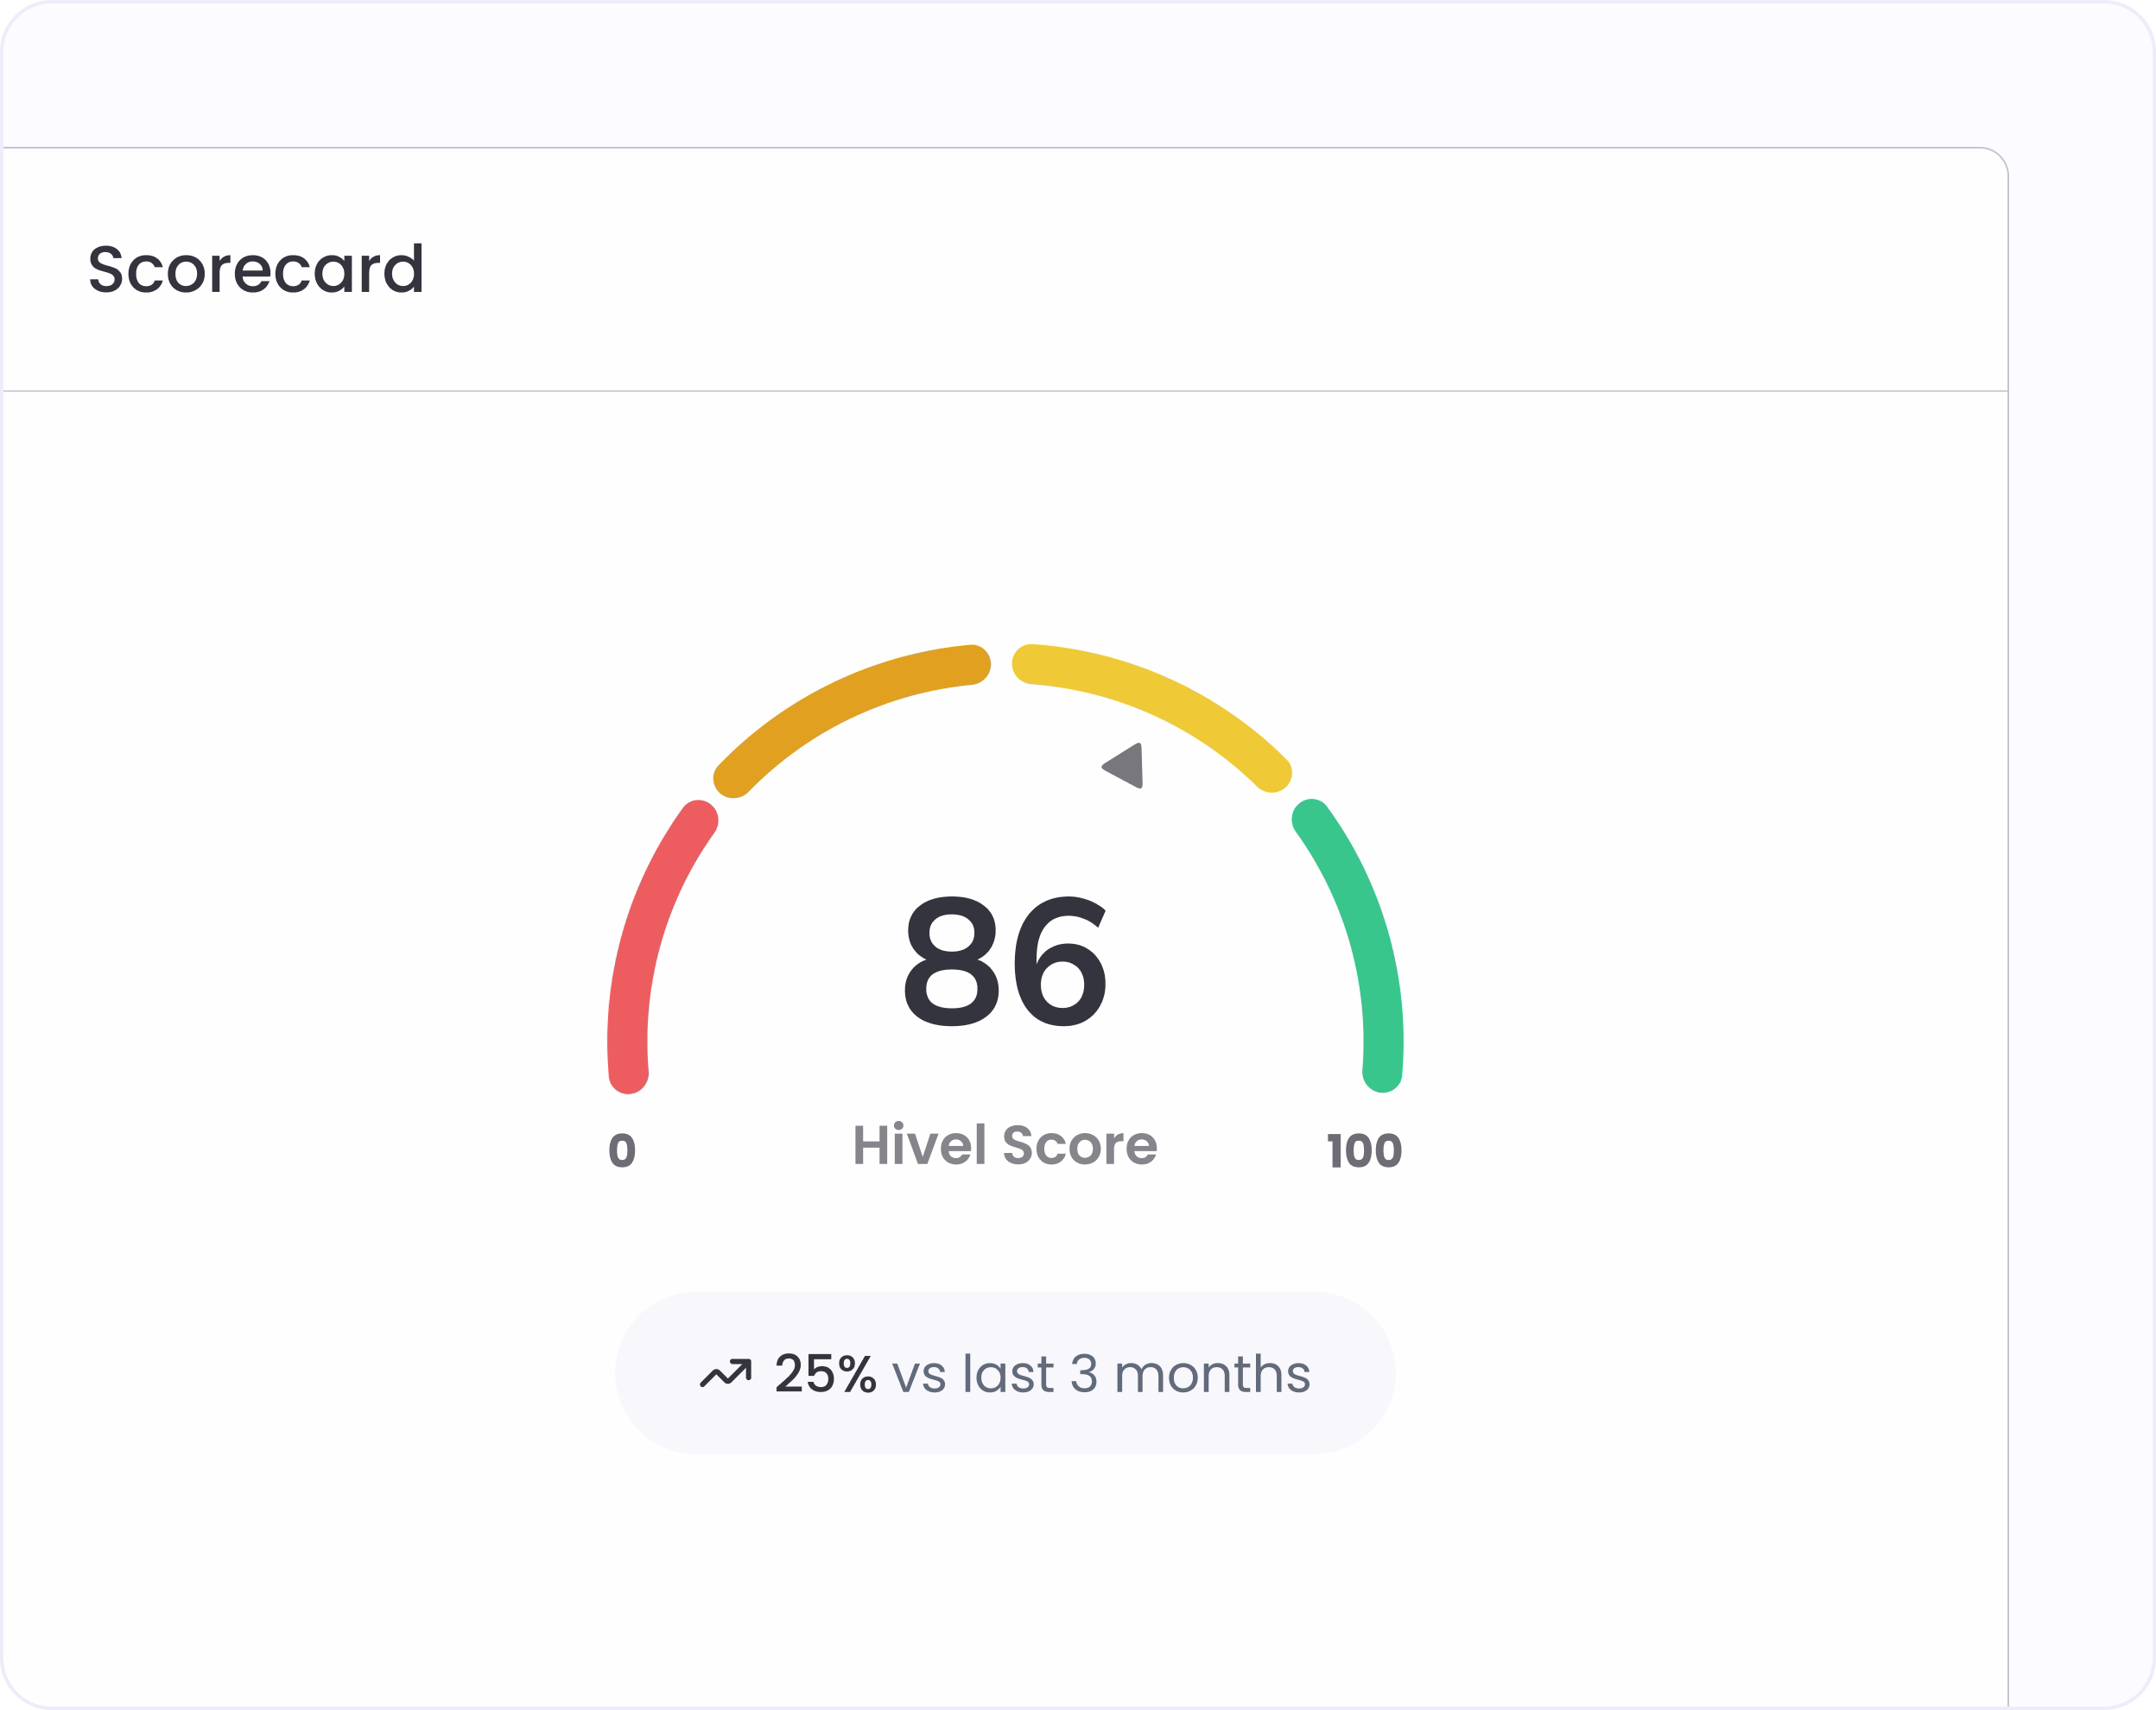
The Hivel Score shows the current score out of 100 alongside its change percentage versus the 6-month rolling average. When the number rises and the change is positive, something real has improved. When it drops, the breakdown tells you which bucket moved.

Is the score improving over time, or plateaued?

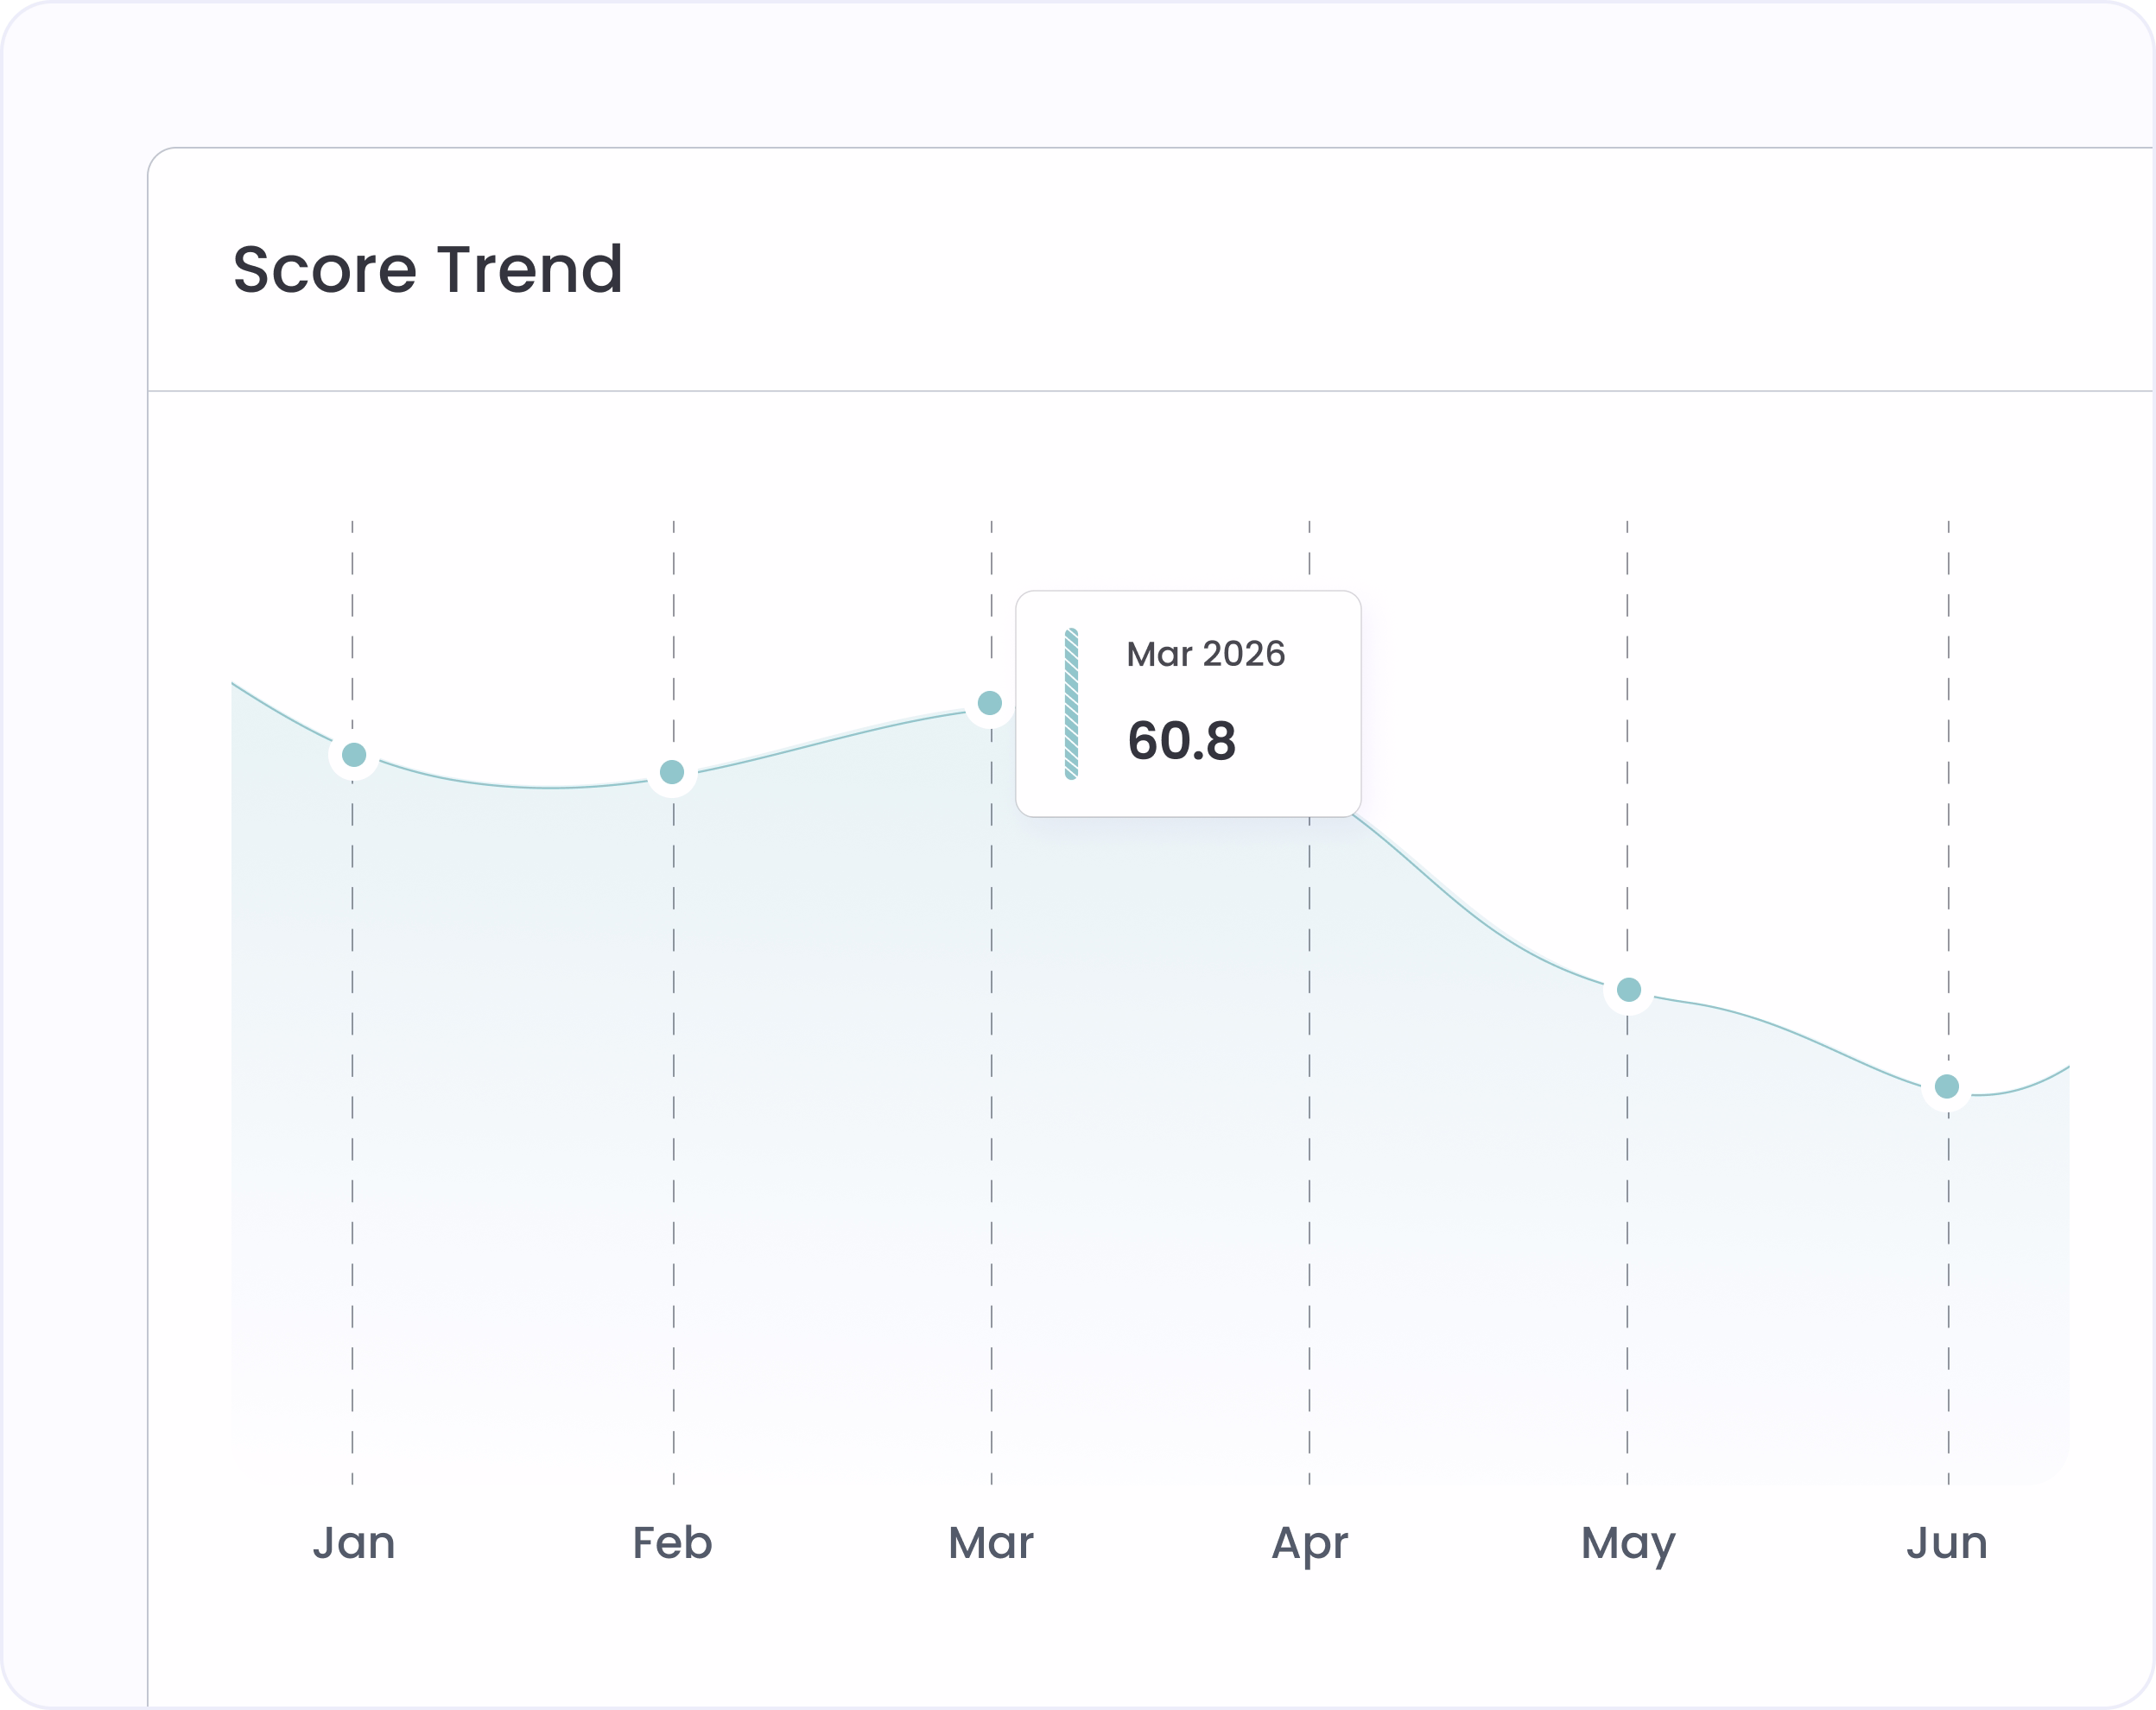
The Score Trend chart plots six months of monthly Hivel Scores as an area chart. A snapshot becomes a trajectory. If a recent AI rollout moved the score, you'll see it. If it's been flat despite rising commits, that's the conversation to have.

Which of the three pillars is pulling the score up or holding it back?

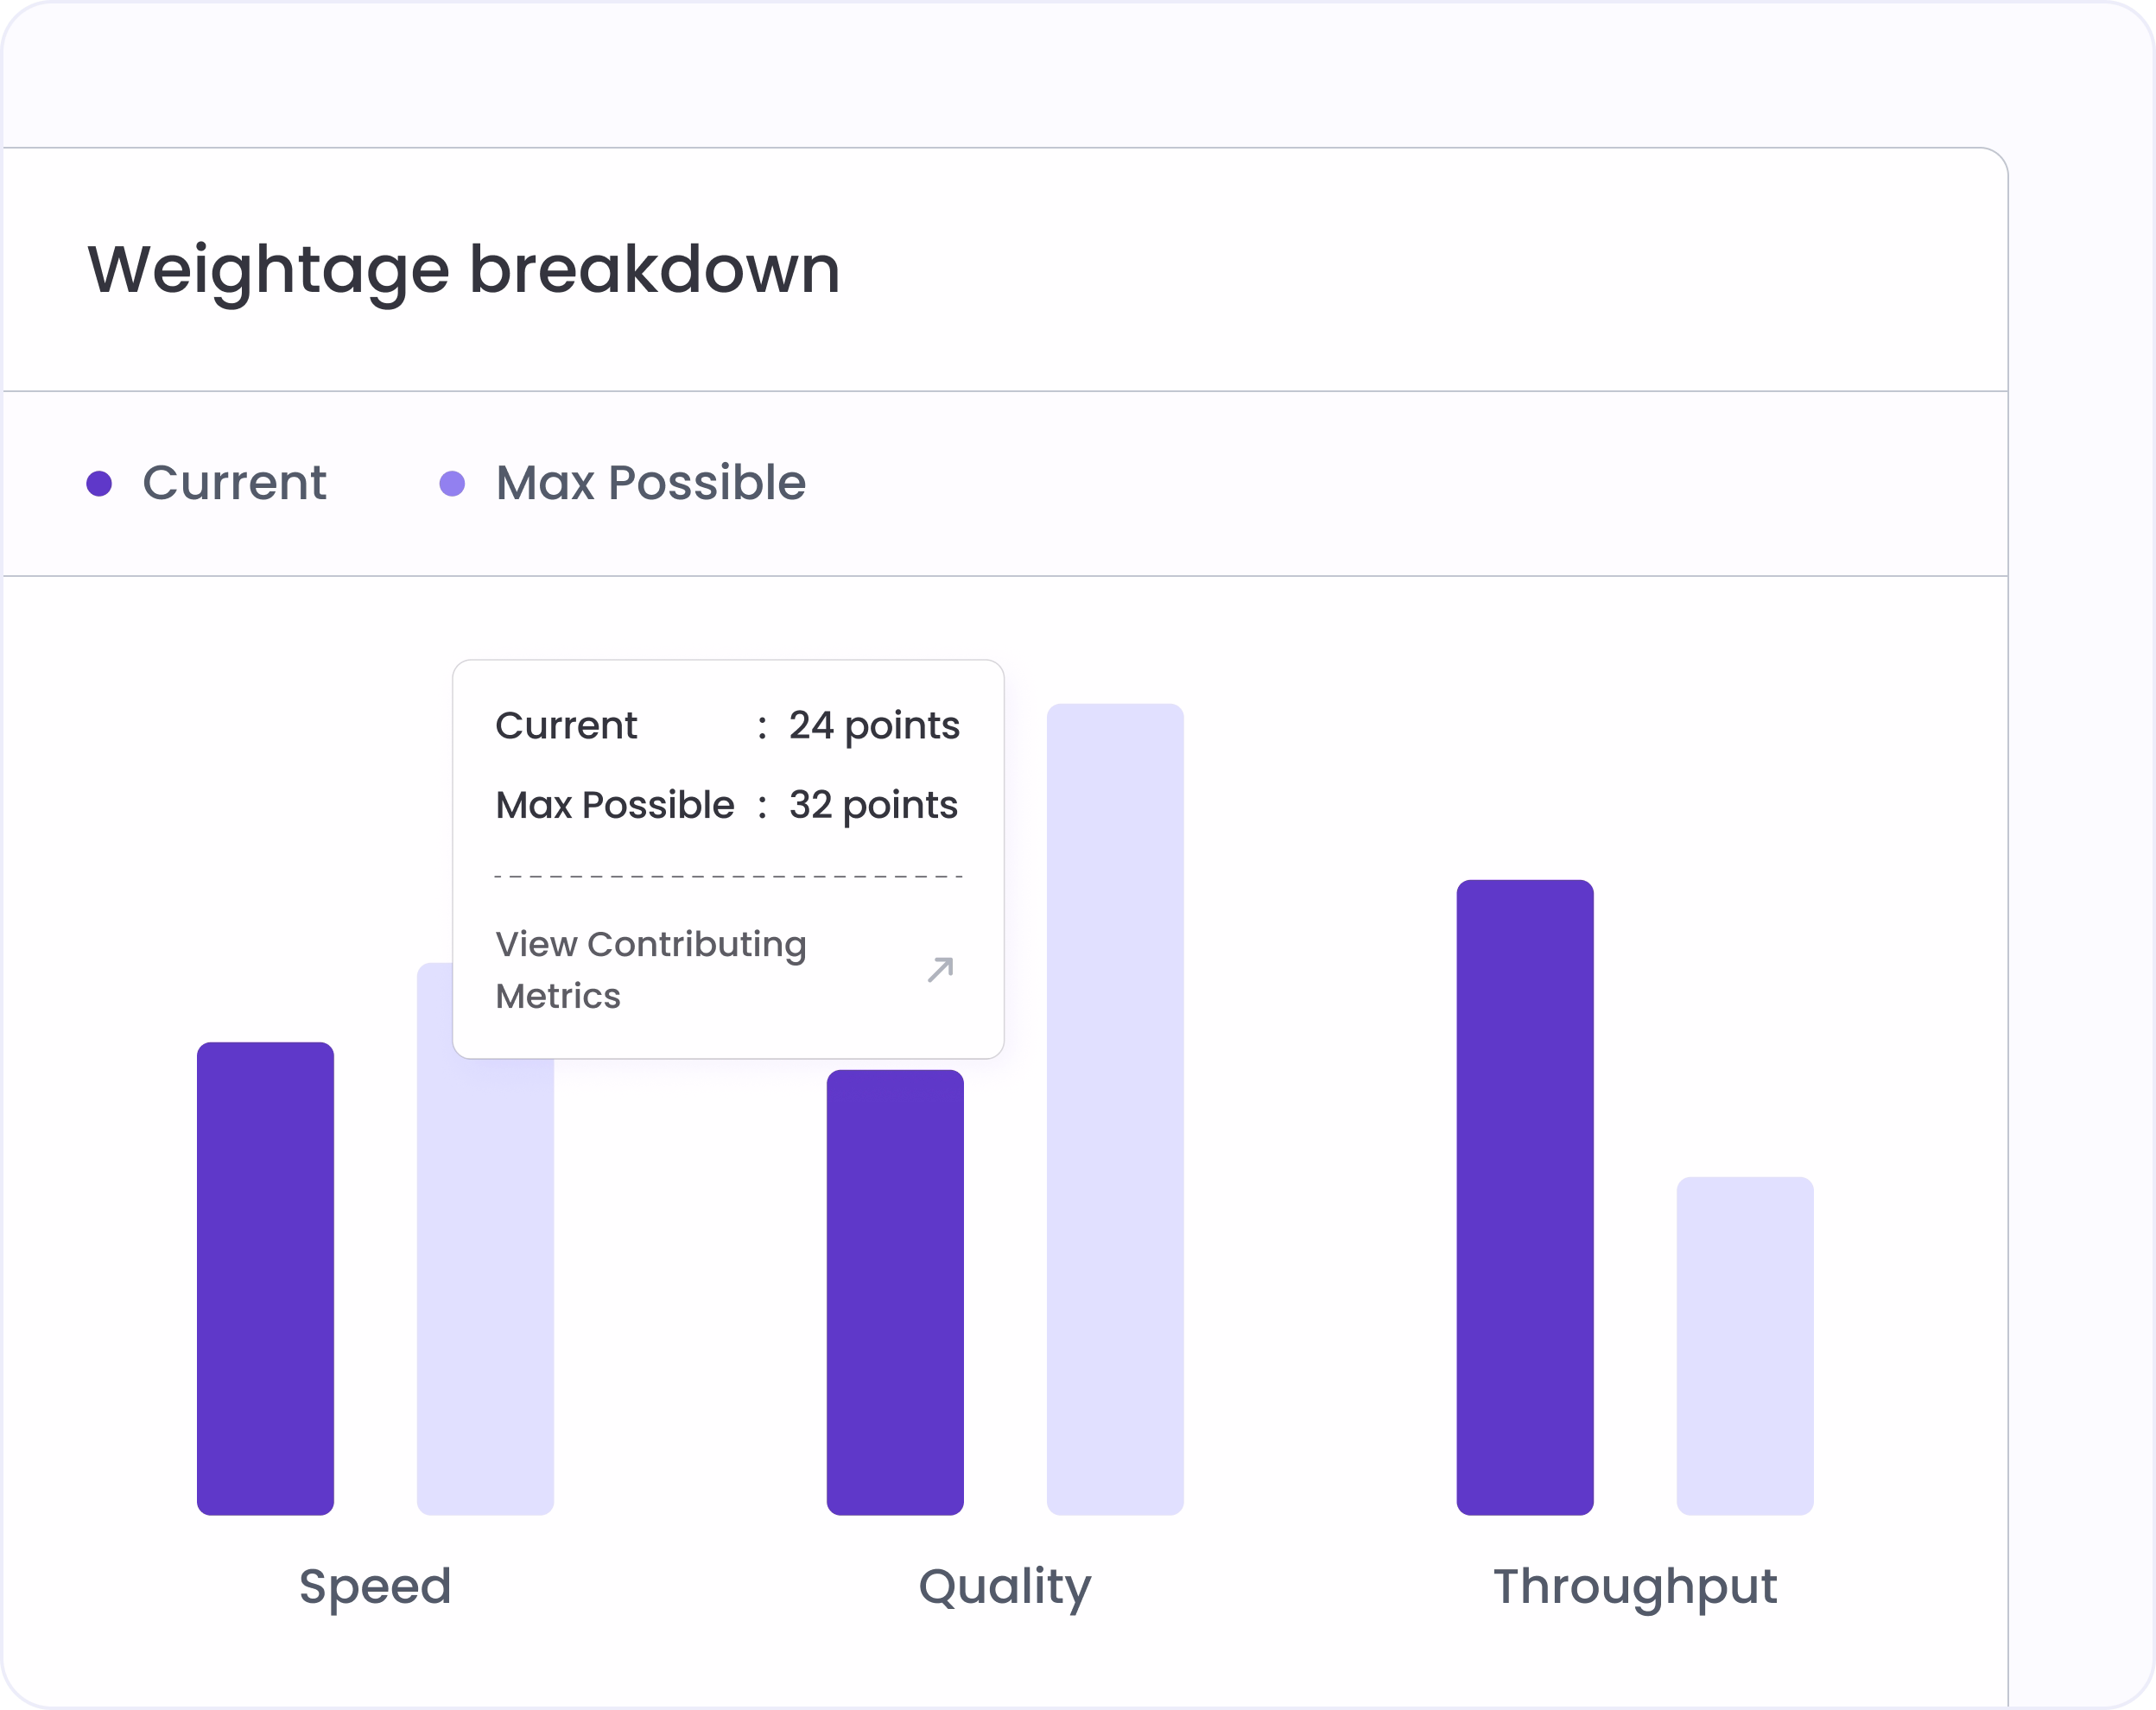
Understand how the Hivel Score is weighted across Speed, Quality, and Throughput. Click any pillar to open the Contributing Metrics modal and see exactly which underlying signals are driving the result. Transparent, not a black box.

Which teams are pulling the org score up or down?

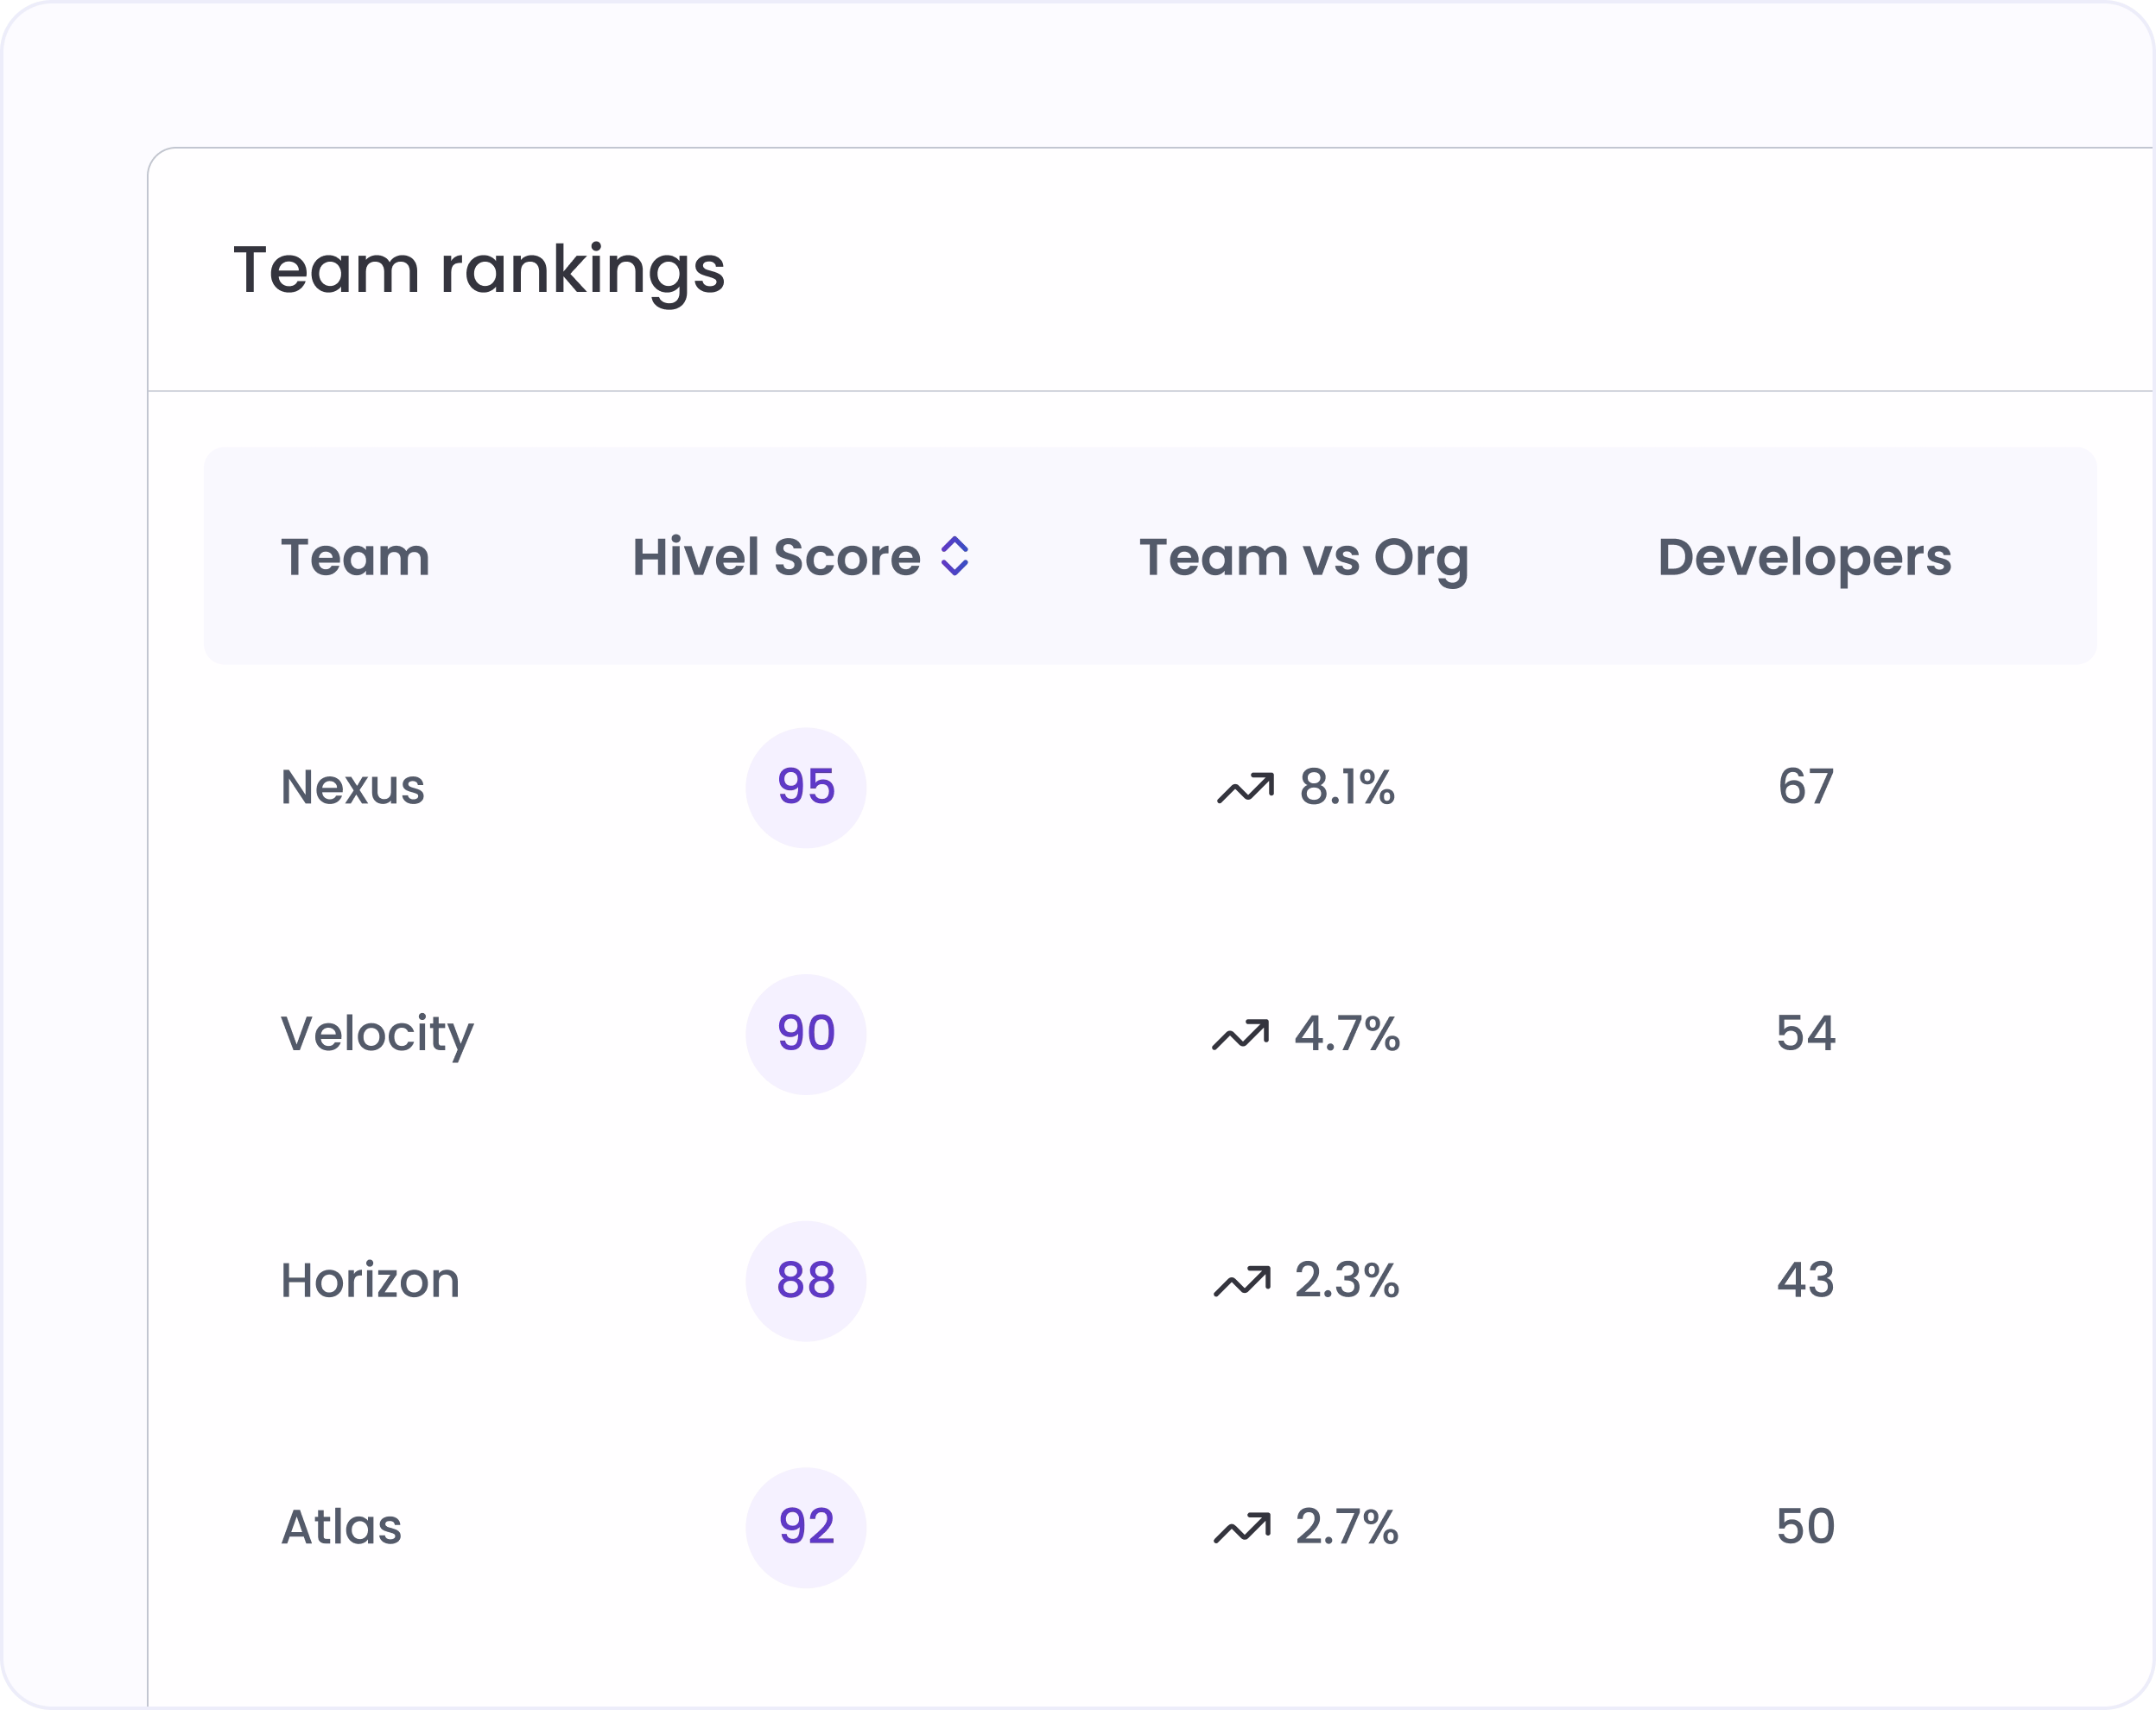
The Team Rankings table shows every team's Hivel Score, change vs prior period, and score relative to the org average in one sortable view. Toggle between Top Scoring and Low Scoring to focus coaching where data says it's needed.

Four tabs. Every angle on engineering effort.

Configurable weightages

Decide what matters most to your org. Adjust Speed, Quality, and Throughput weights using sliders. The score recalculates in real time.

Org vs team toggle

Switch between org-level and team-level scoring without leaving the screen. Team-scoped users see their team's score calibrated against org norms.

6-month rolling baseline

Every month's score calculates against a 6-month rolling baseline from your own org's data, not an industry benchmark. Improvement is relative.

Top and low scoring toggle

The Team Rankings table splits into Top 5 and Low 5 with one click. See who's above the org average instantly.

Hivel × Freshworks Case Study Card
Freshworks NASDAQ: FRSH

How Freshworks measured AI impact across 1,500 engineers — in real time

No standard way to measure AI adoption across 1,500 engineers
Couldn't tell which AI tools were helping vs just running
Surveys were the only answer — slow, expensive, inaccurate
40% Increase in engineering throughput
50% Reduction in rework and maintenance
25% More features released in key business units
10% Improvement in time-to-market

Frequently asked questions

What goes into the Hivel Score?

Hivel Score combines signals across three buckets: Speed (how fast code moves from start to merge), Quality (how clean and stable that code is), and Throughput (how consistently the team is active and shipping). Each bucket has a configurable weight. The overall score reflects all three combined.

What does the score compare against?

Each month's score is calculated against a 6-month rolling baseline from your own org's data, not an industry benchmark. The score reflects whether your org is improving relative to its own trajectory. The change percentage shows exactly how much the score moved vs the prior 6-month average.

Can we adjust which metrics matter more?

Yes. Admins configure the Speed, Quality, and Throughput weightages using sliders in the Hivel Score configuration view. The three weights must sum to 100%. The score recalculates immediately on save.

Trusted by 1000+ Engineering Teams

Vaibhav Bansal
V.P. Engineering
"Hivel has been phenomenal in helping us present our progress to leadership. Its insights into leading indicators have empowered our team leads to enhance review efficiency and ship features faster. Now, we are able to show the impact of our process changes, clearly identify areas of opportunity, and bring in a data-driven culture without spending time pulling manual reports."
Murali Swaminathan
Chief Technology Officer
"We were looking for a unique solution to understand engineering productivity and efficiency, with a single tool that could give leaders complete visibility. We evaluated other comparable tools, but none were comprehensive enough. When we came across Hivel, it checked all the boxes for measuring developer productivity across both AI and non-AI workflows."
Derek Mackie
Director of Engineering
"Using Hivel shone a light on the non-standard aspects of our work, emphasizing the need for crucial adjustments. The insights from Hivel helped us recognize areas for improvement, particularly in managing cycle times and streamlining development workflows. This guidance has been instrumental in our efforts to enhance operational efficiency and productivity."
Leonardo Pinheiro Ferrari
Chief Technology Officer
"Thanks to Hivel, we've seen a staggering 157% improvement in our deployment frequency. By identifying and addressing inefficiencies, and adopting best practices, we've significantly accelerated our progress. Hivel has been instrumental in our journey to operational excellence."
Chris Callander
Senior Engineering Manager
"Hivel has been instrumental in identifying areas for enhancement and guiding our strategic improvements. It has significantly contributed to our journey toward greater operational efficiency. The Activity and Dev360 features in Hivel have been particularly valuable for providing feedback to engineers during 1-1's, enhancing our communication and development practices."
Shiro Theuri
Chief Technology Officer
"Before Hivel, understanding our engineering team's dynamics was a game of guesswork. Now, with Hivel's clear dashboards and insights, our leaders have the clarity and time-saving tools they need to excel. It's been transformative in streamlining our operations."
Koti Reddy
Chief Technology Officer
"Incorporating Hivel into our daily operations has been a game-changer. It's not just a tool; it's a part of our strategic decision-making process, trusted by our leaders at every level. The impact on our engineering efficiency is undeniable and deeply valued."
Manoj Awasthi
Chief Technology Officer
"It has been great to partner with Hivel to get access to insights that help leaders at all levels gain visibility into bottlenecks and challenges that the teams face, build actionable plan to resolve them and track the progress over time. And thanks for the fantastic support!"
Ameen M
Engineering Manager
"Hivel has made a huge difference to how I manage my teams. Before every one-on-one or appraisal, I rely on it to dive into developer metrics and drive truly meaningful conversations. It helps me spot rework patterns, reward high performers, and benchmark our teams even against our US counterparts. The dashboards are intuitive, insightful, and honestly far more actionable than anything we get from Jira."
Paras Sood
Associate Director
"Hivel's insights have been pivotal in refining our engineering processes, elevating both efficiency and the developer experience. We're now making smarter decisions, faster, thanks to Hivel."
Vaibhav Bansal
V.P. Engineering
"Hivel has been phenomenal in helping us present our progress to leadership. Its insights into leading indicators have empowered our team leads to enhance review efficiency and ship features faster. Now, we are able to show the impact of our process changes, clearly identify areas of opportunity, and bring in a data-driven culture without spending time pulling manual reports."
Murali Swaminathan
Chief Technology Officer
“We were looking for a unique solution to understand engineering productivity and efficiency, with a single tool that could give leaders complete visibility. We evaluated other comparable tools, but none were comprehensive enough. When we came across Hivel, it checked all the boxes for measuring developer productivity across both AI and non-AI workflows.”
Vaibhav Bansal
V.P. Engineering
"Hivel has been phenomenal in helping us present our progress to leadership. Its insights into leading indicators have empowered our team leads to enhance review efficiency and ship features faster. Now, we are able to show the impact of our process changes, clearly identify areas of opportunity, and bring in a data-driven culture without spending time pulling manual reports."
Derek Mackie
Director of Engineering
"Using Hivel shone a light on the non-standard aspects of our work, emphasizing the need for crucial adjustments. The insights from Hivel helped us recognize areas for improvement, particularly in managing cycle times and streamlining development workflows. This guidance has been instrumental in our efforts to enhance operational efficiency and productivity."
Leonardo Pinheiro Ferrari
Chief Technology Officer
"Thanks to Hivel, we've seen a staggering 157% improvement in our deployment frequency. By identifying and addressing inefficiencies, and adopting best practices, we've significantly accelerated our progress. Hivel has been instrumental in our journey to operational excellence."

"The only tool our entire leadership team actually trusts"