Get the full picture on your AI adoption and impact.

We'll show you exactly how AI is impacting your speed and code quality.

NO CODE ACCESS
FREE AI ROI REPORT
NO CREDIT CARD
4.7/5

Coding Breakdown

AI is shipping more code. Is it shipping more product?

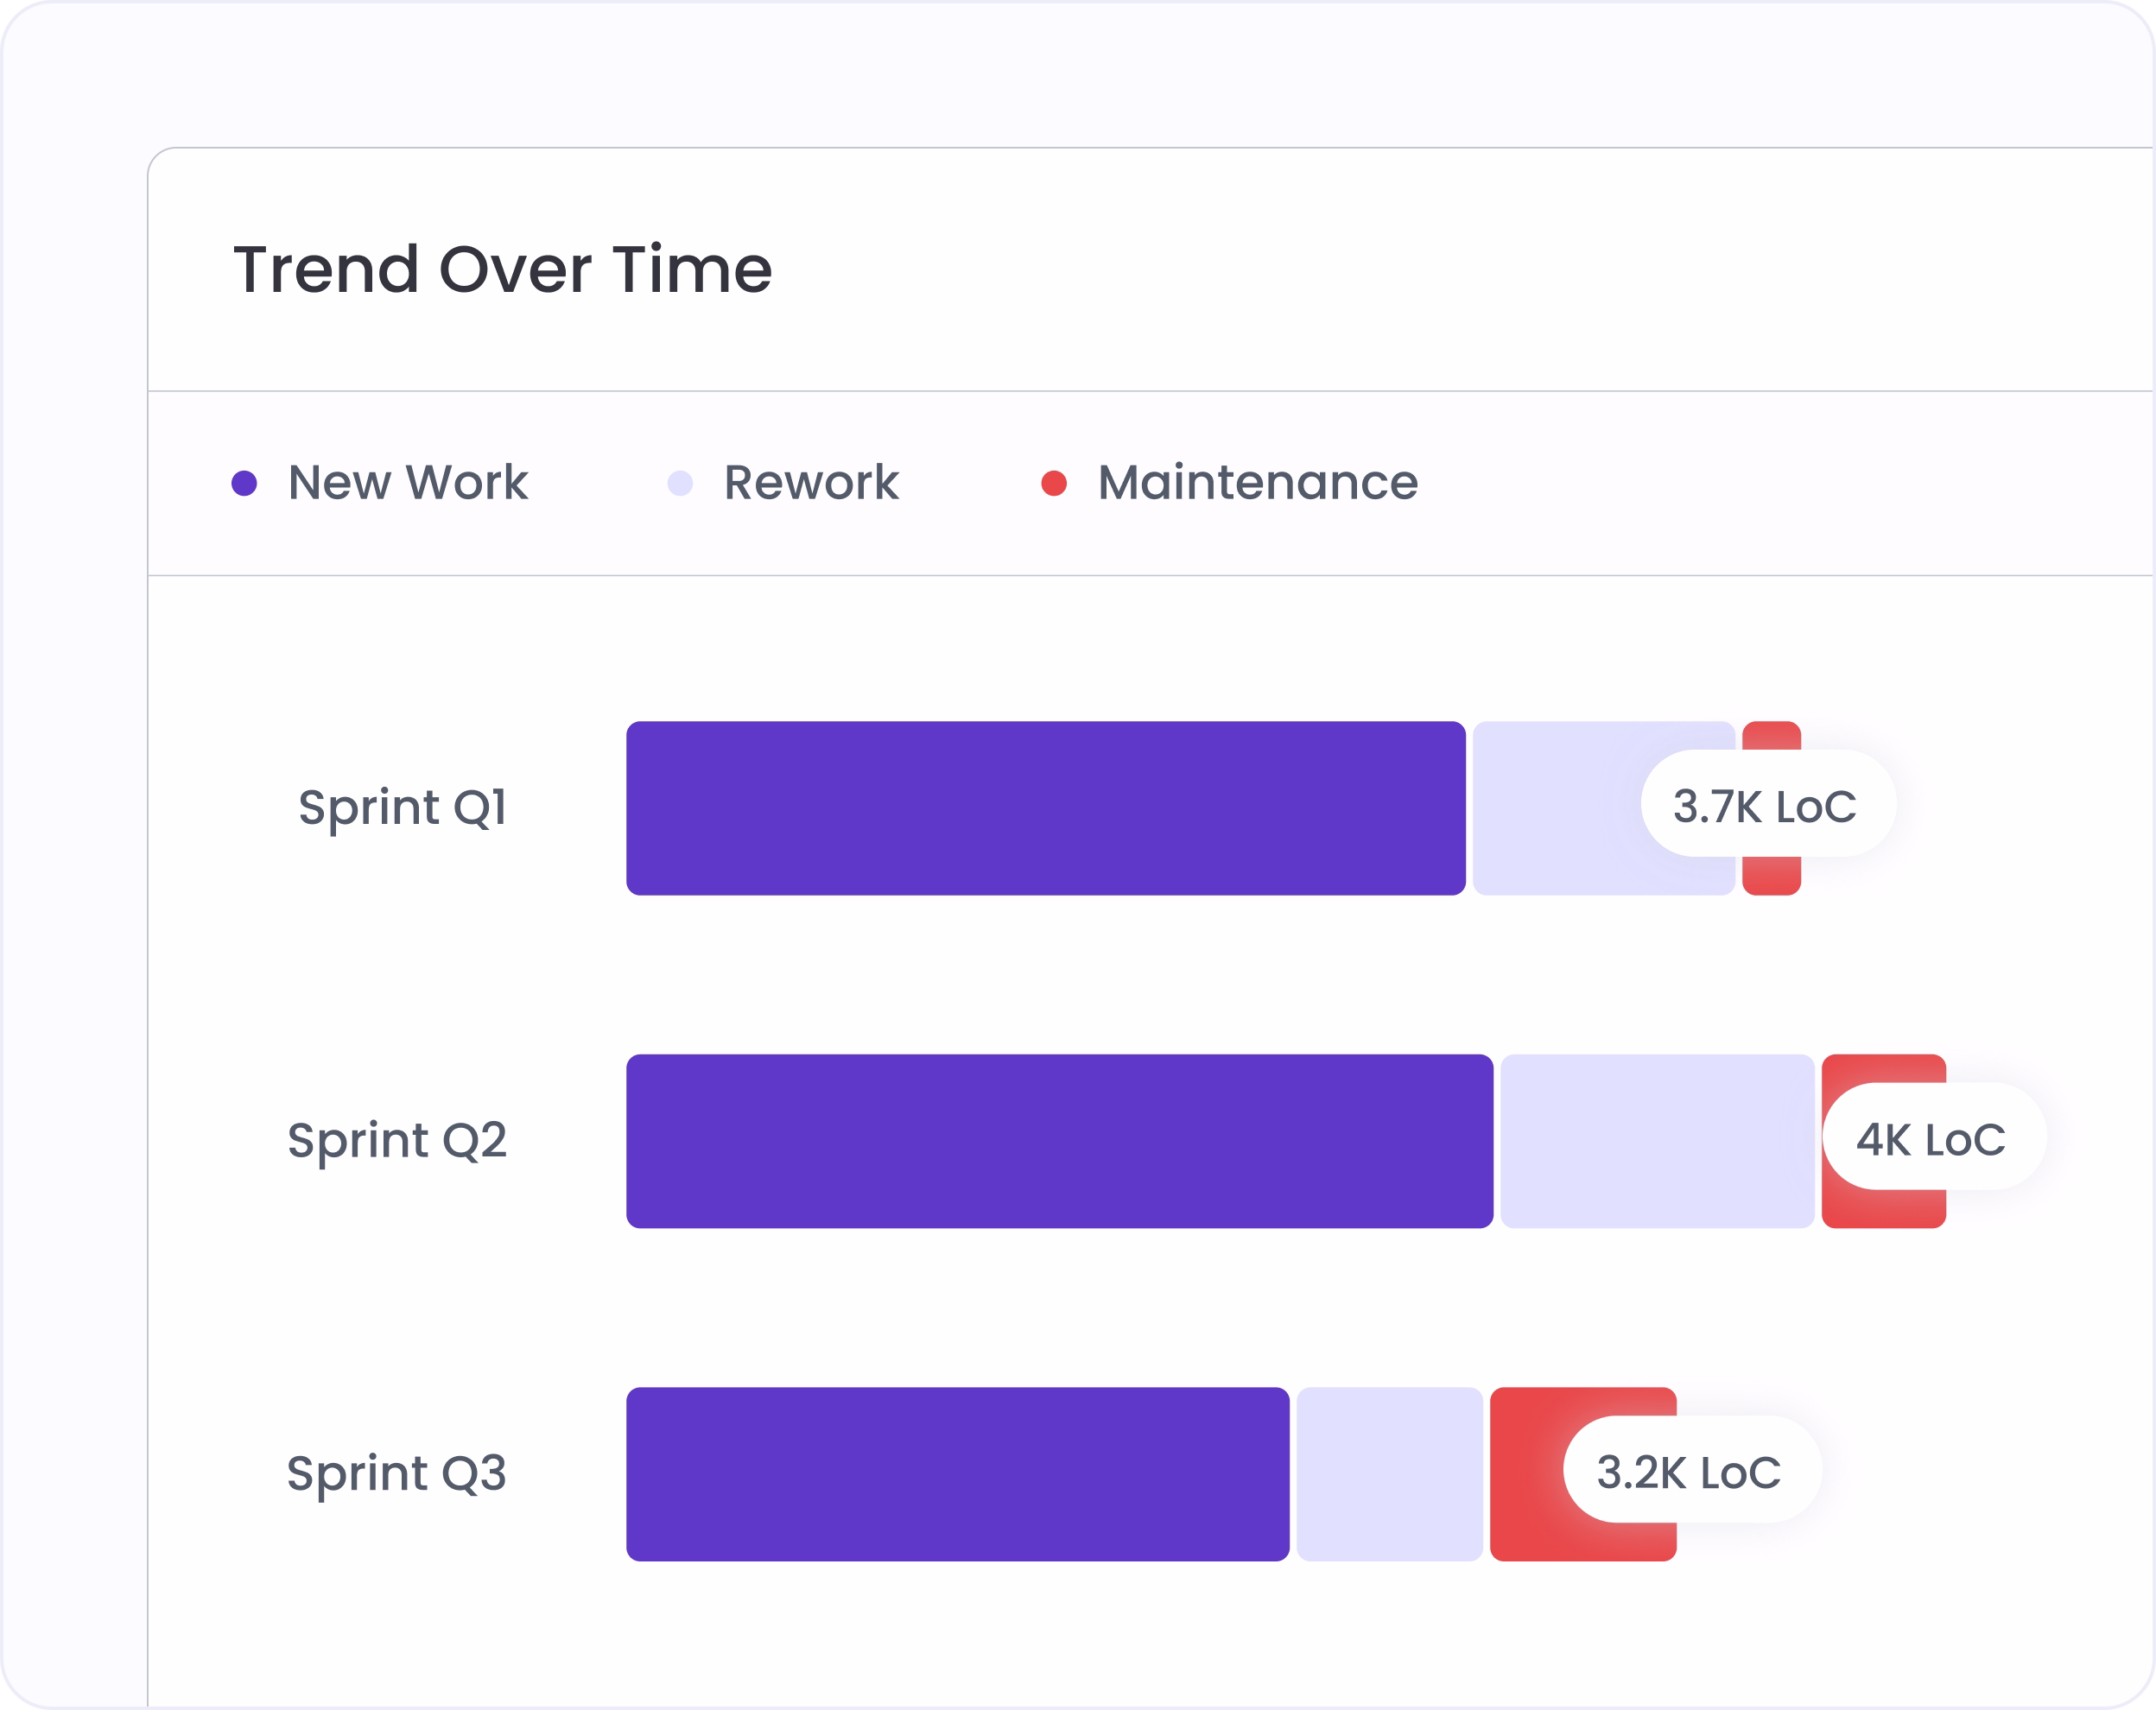
Hivel classifies every line your team writes as new work, rework, or maintenance. See exactly where engineering capacity is going, sprint by sprint, and prove whether AI is moving the product forward.

New work, rework, maintenance: three numbers that explain engineering capacity.

Know how much of each sprint went to building versus fixing

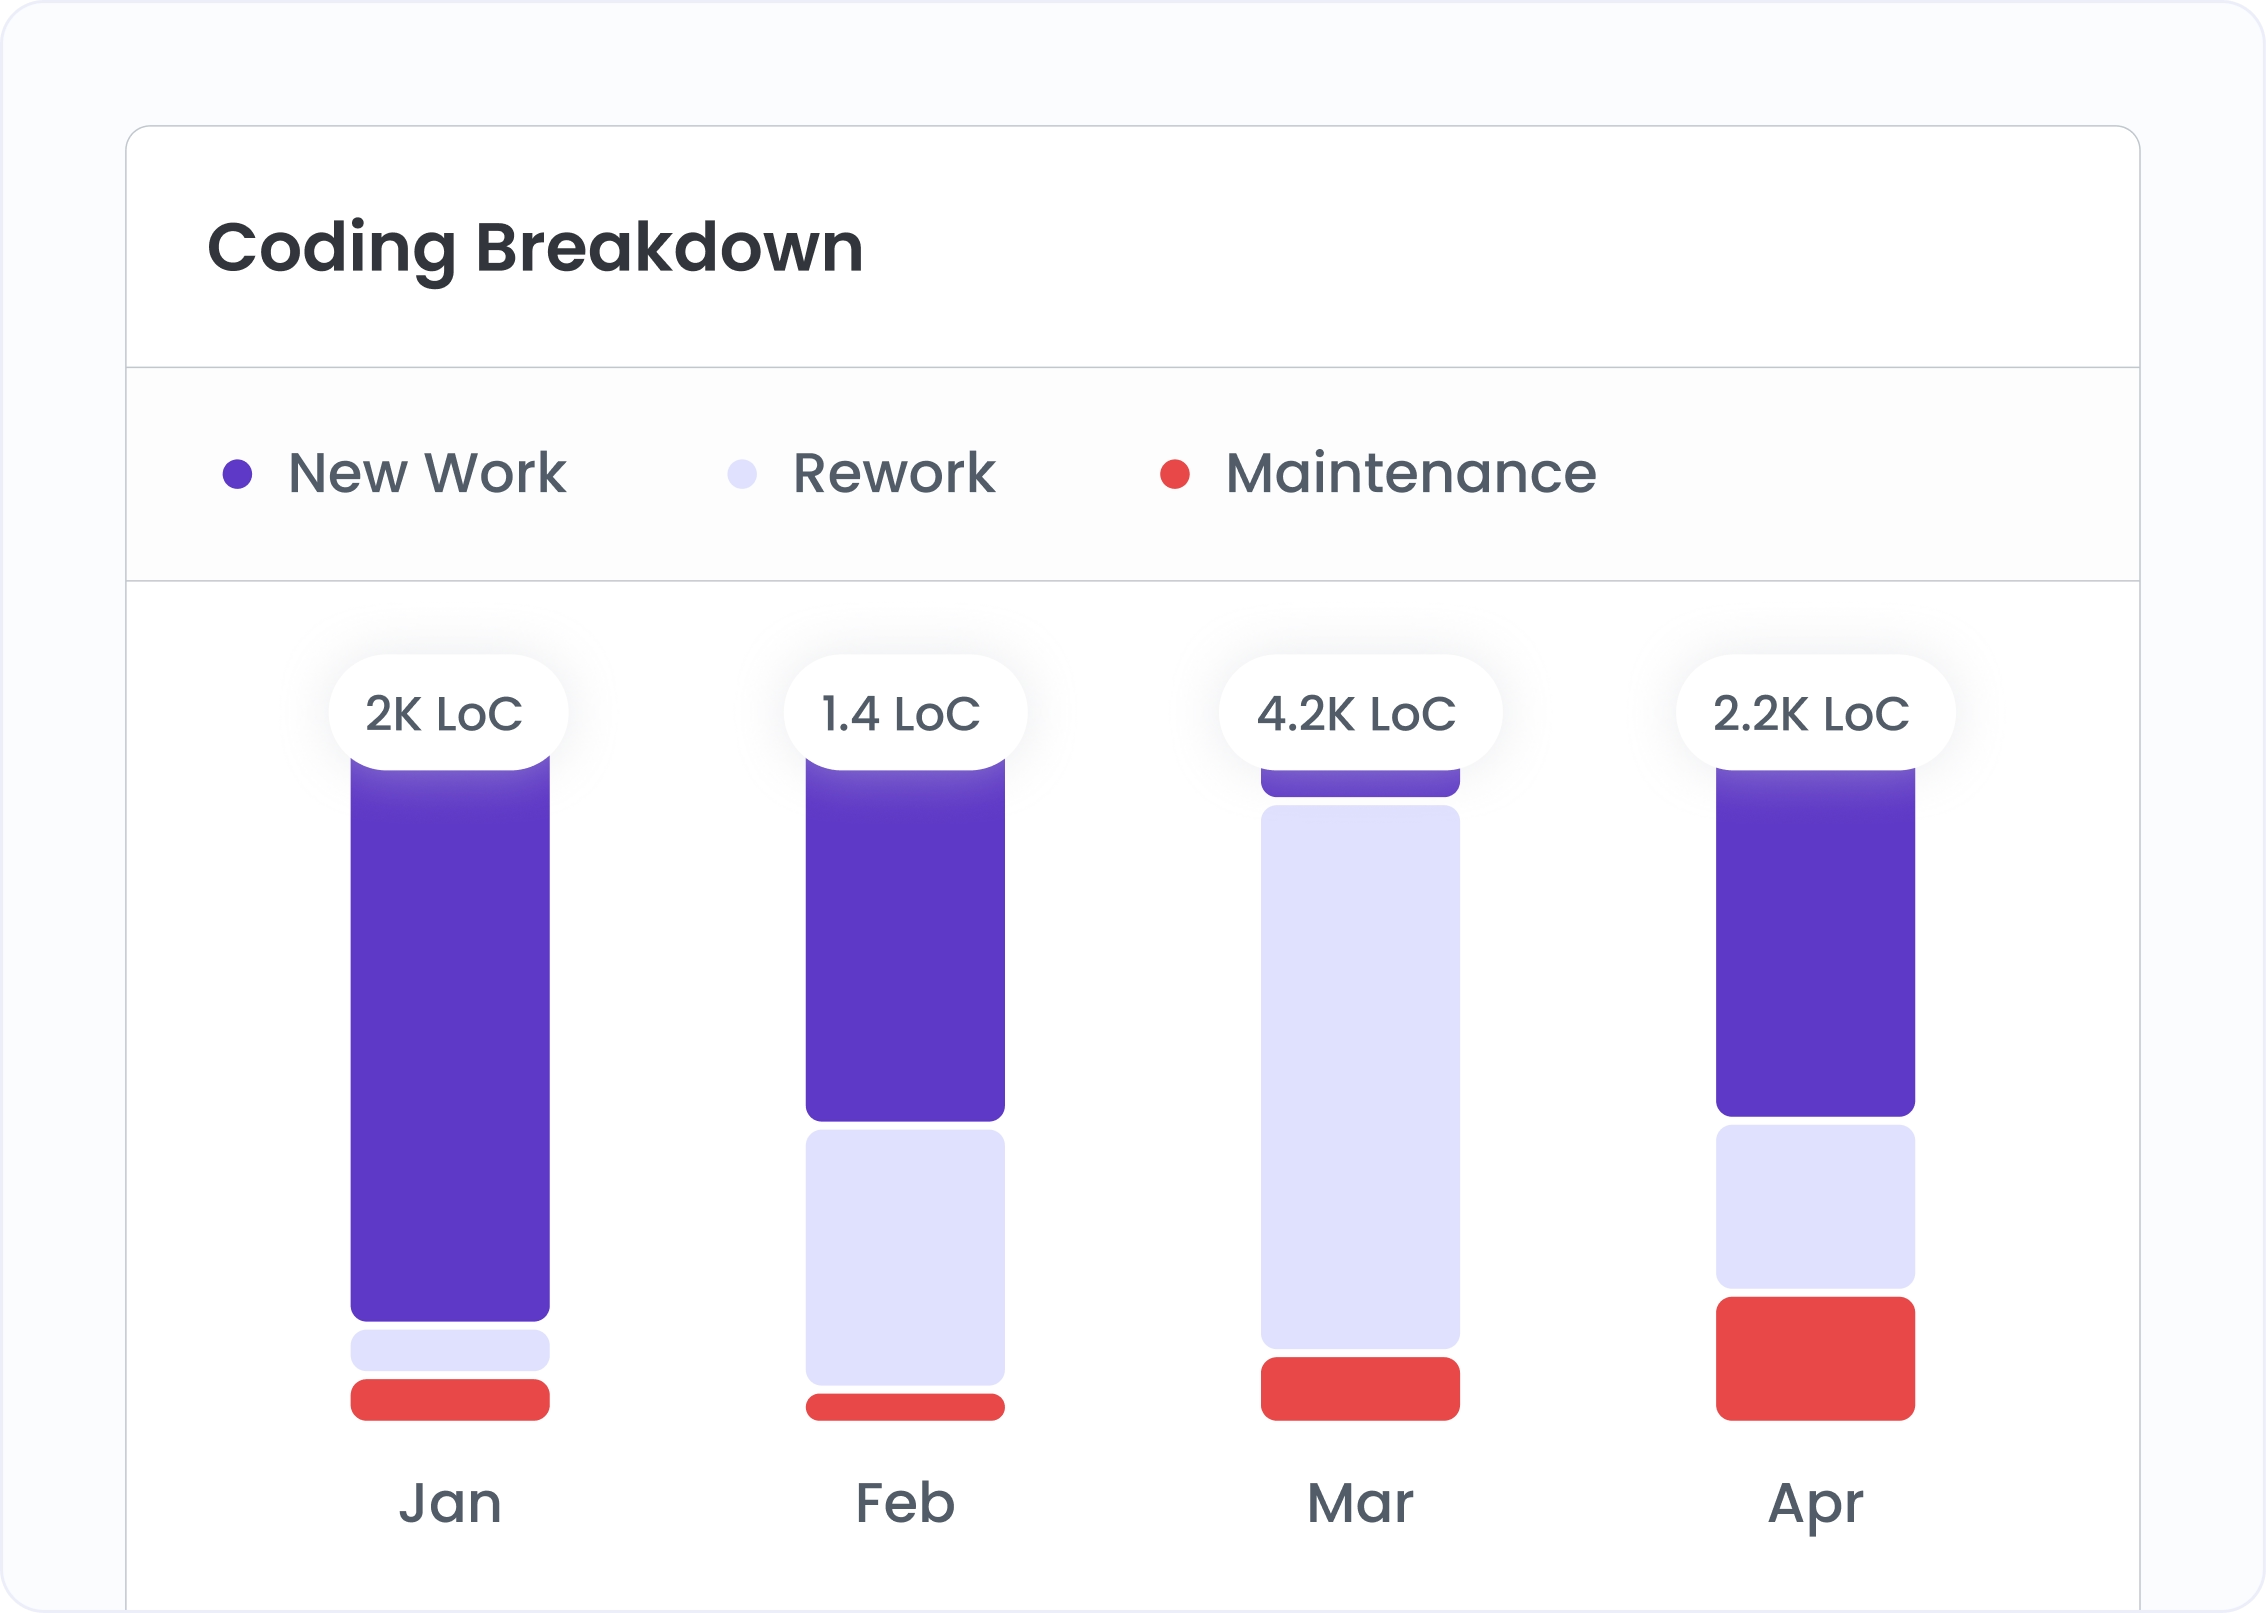
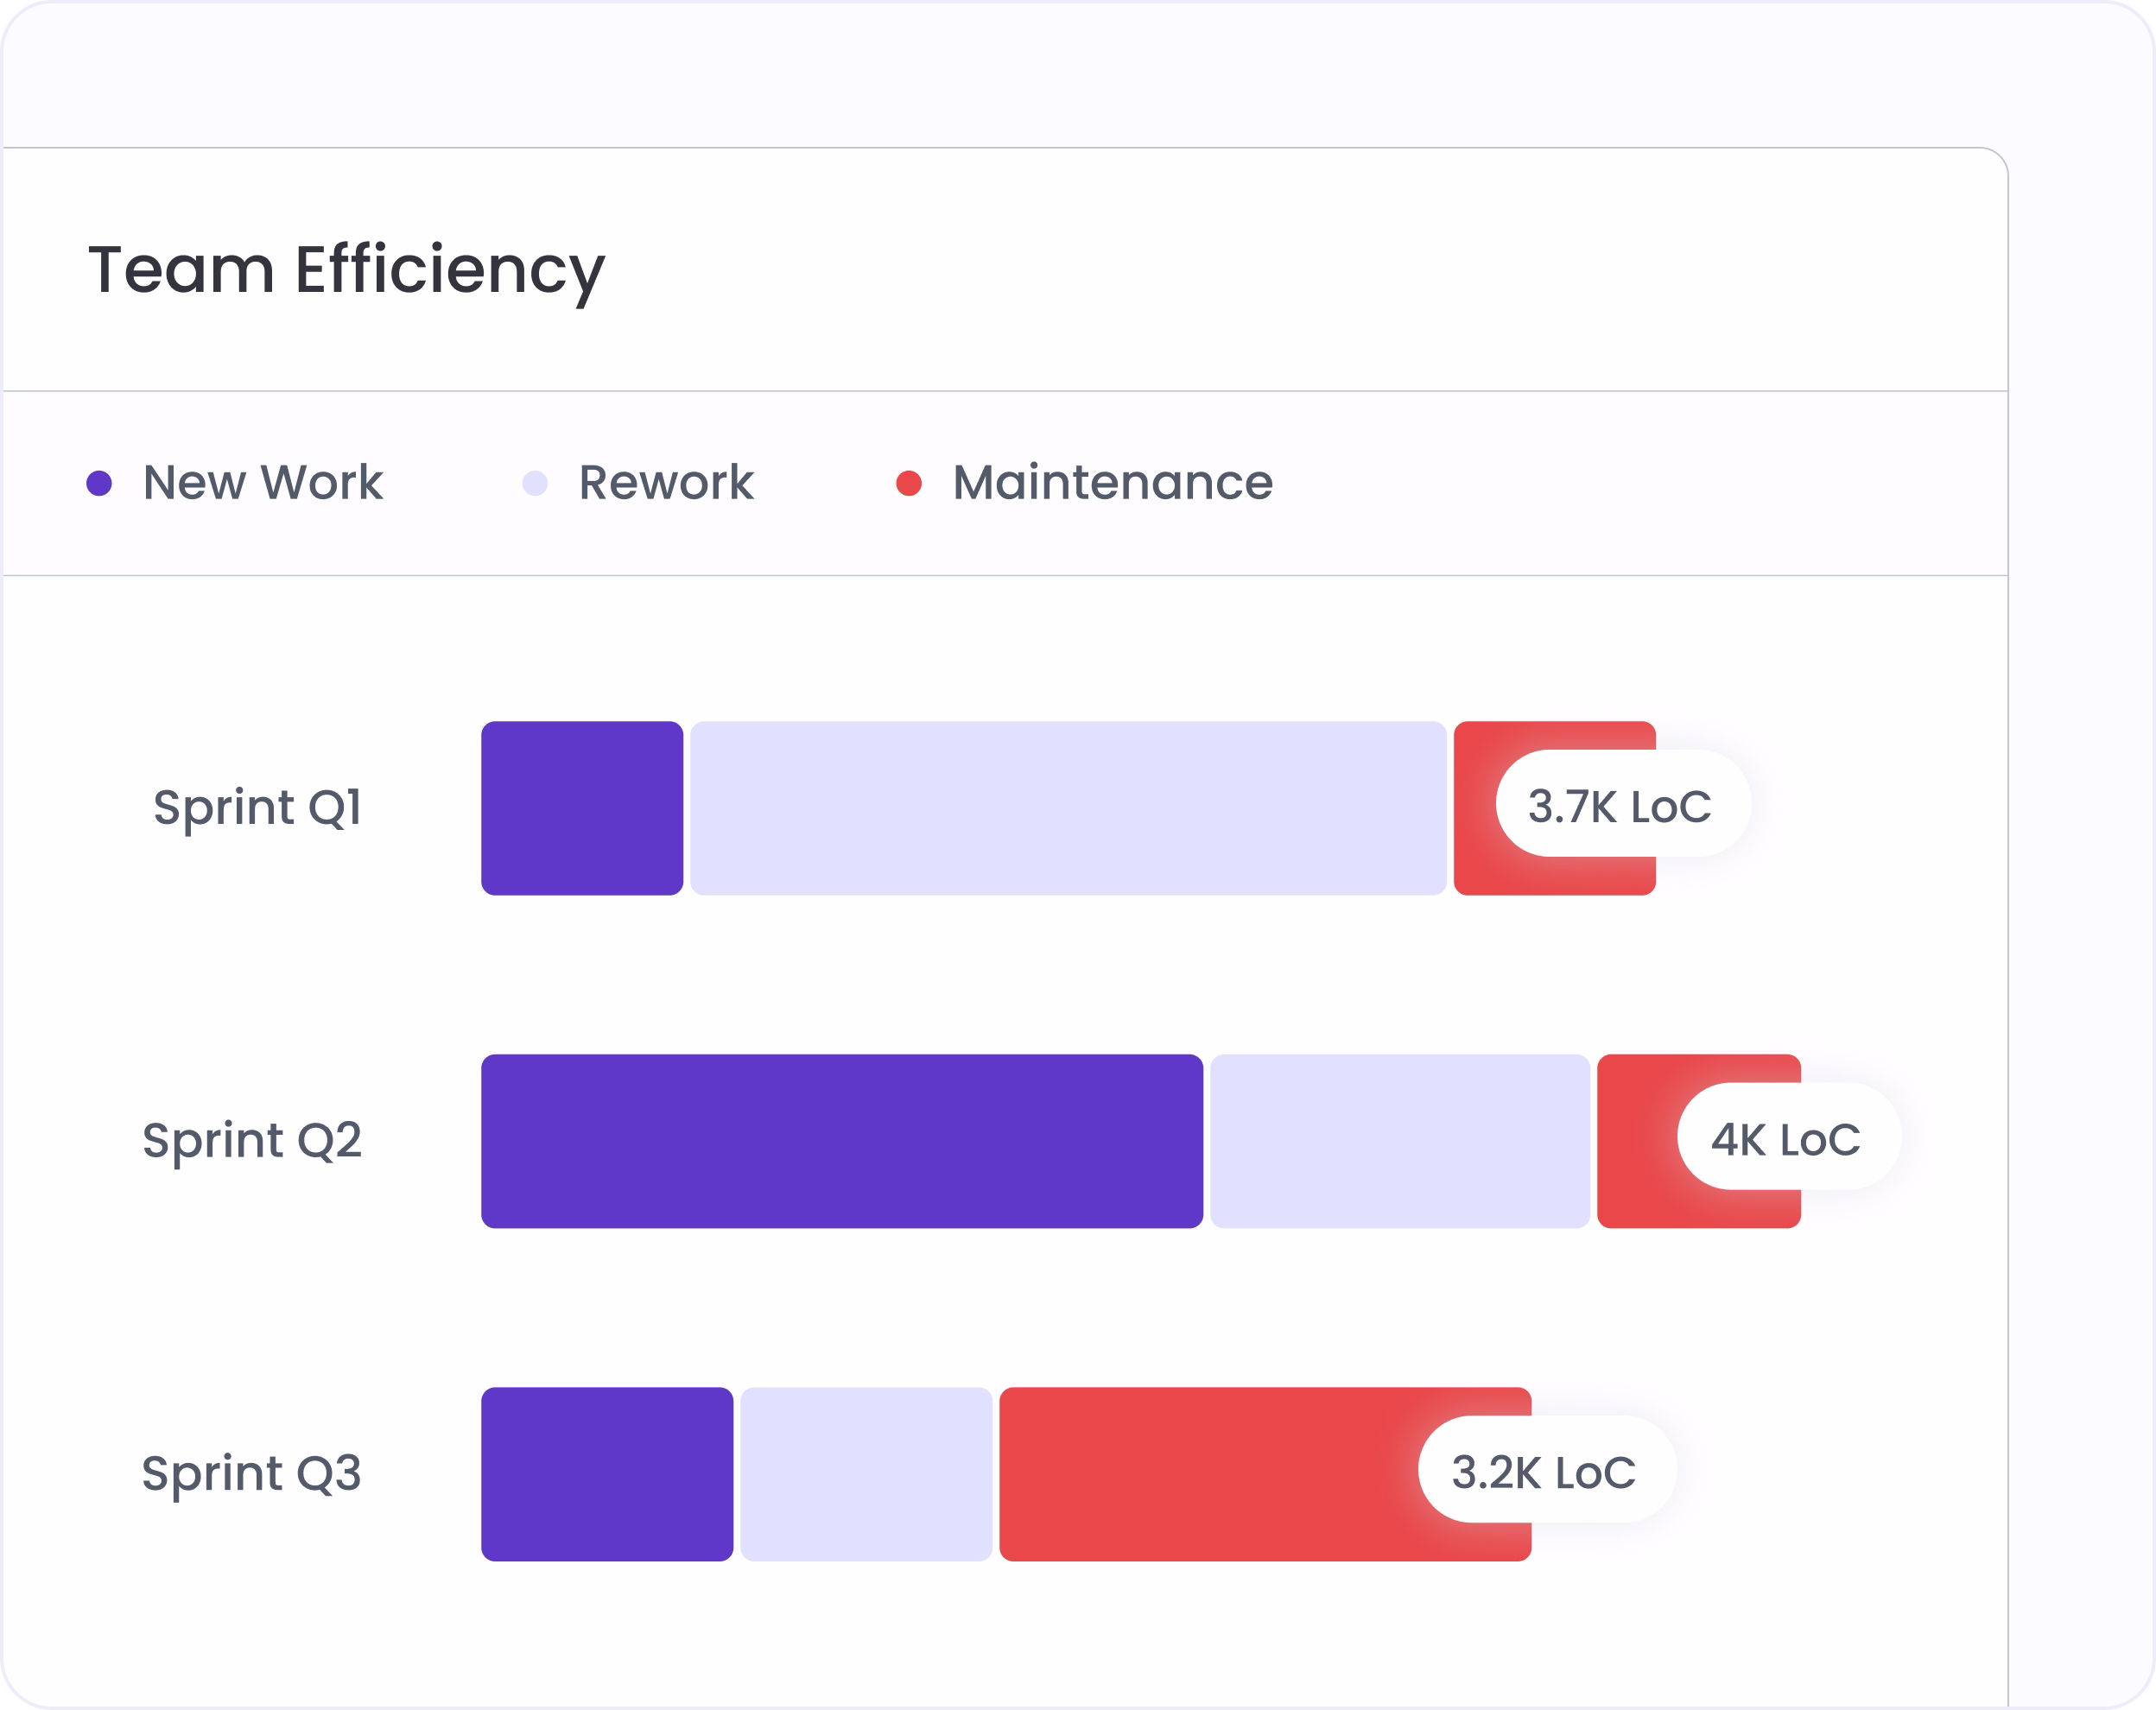
The stacked column chart shows New Work, Rework, and Maintenance proportions week by week. When rework climbs, requirements are breaking upstream. When maintenance dominates, tech debt is consuming sprint capacity before new features get a chance.

Trace rework back to the exact commits that caused it

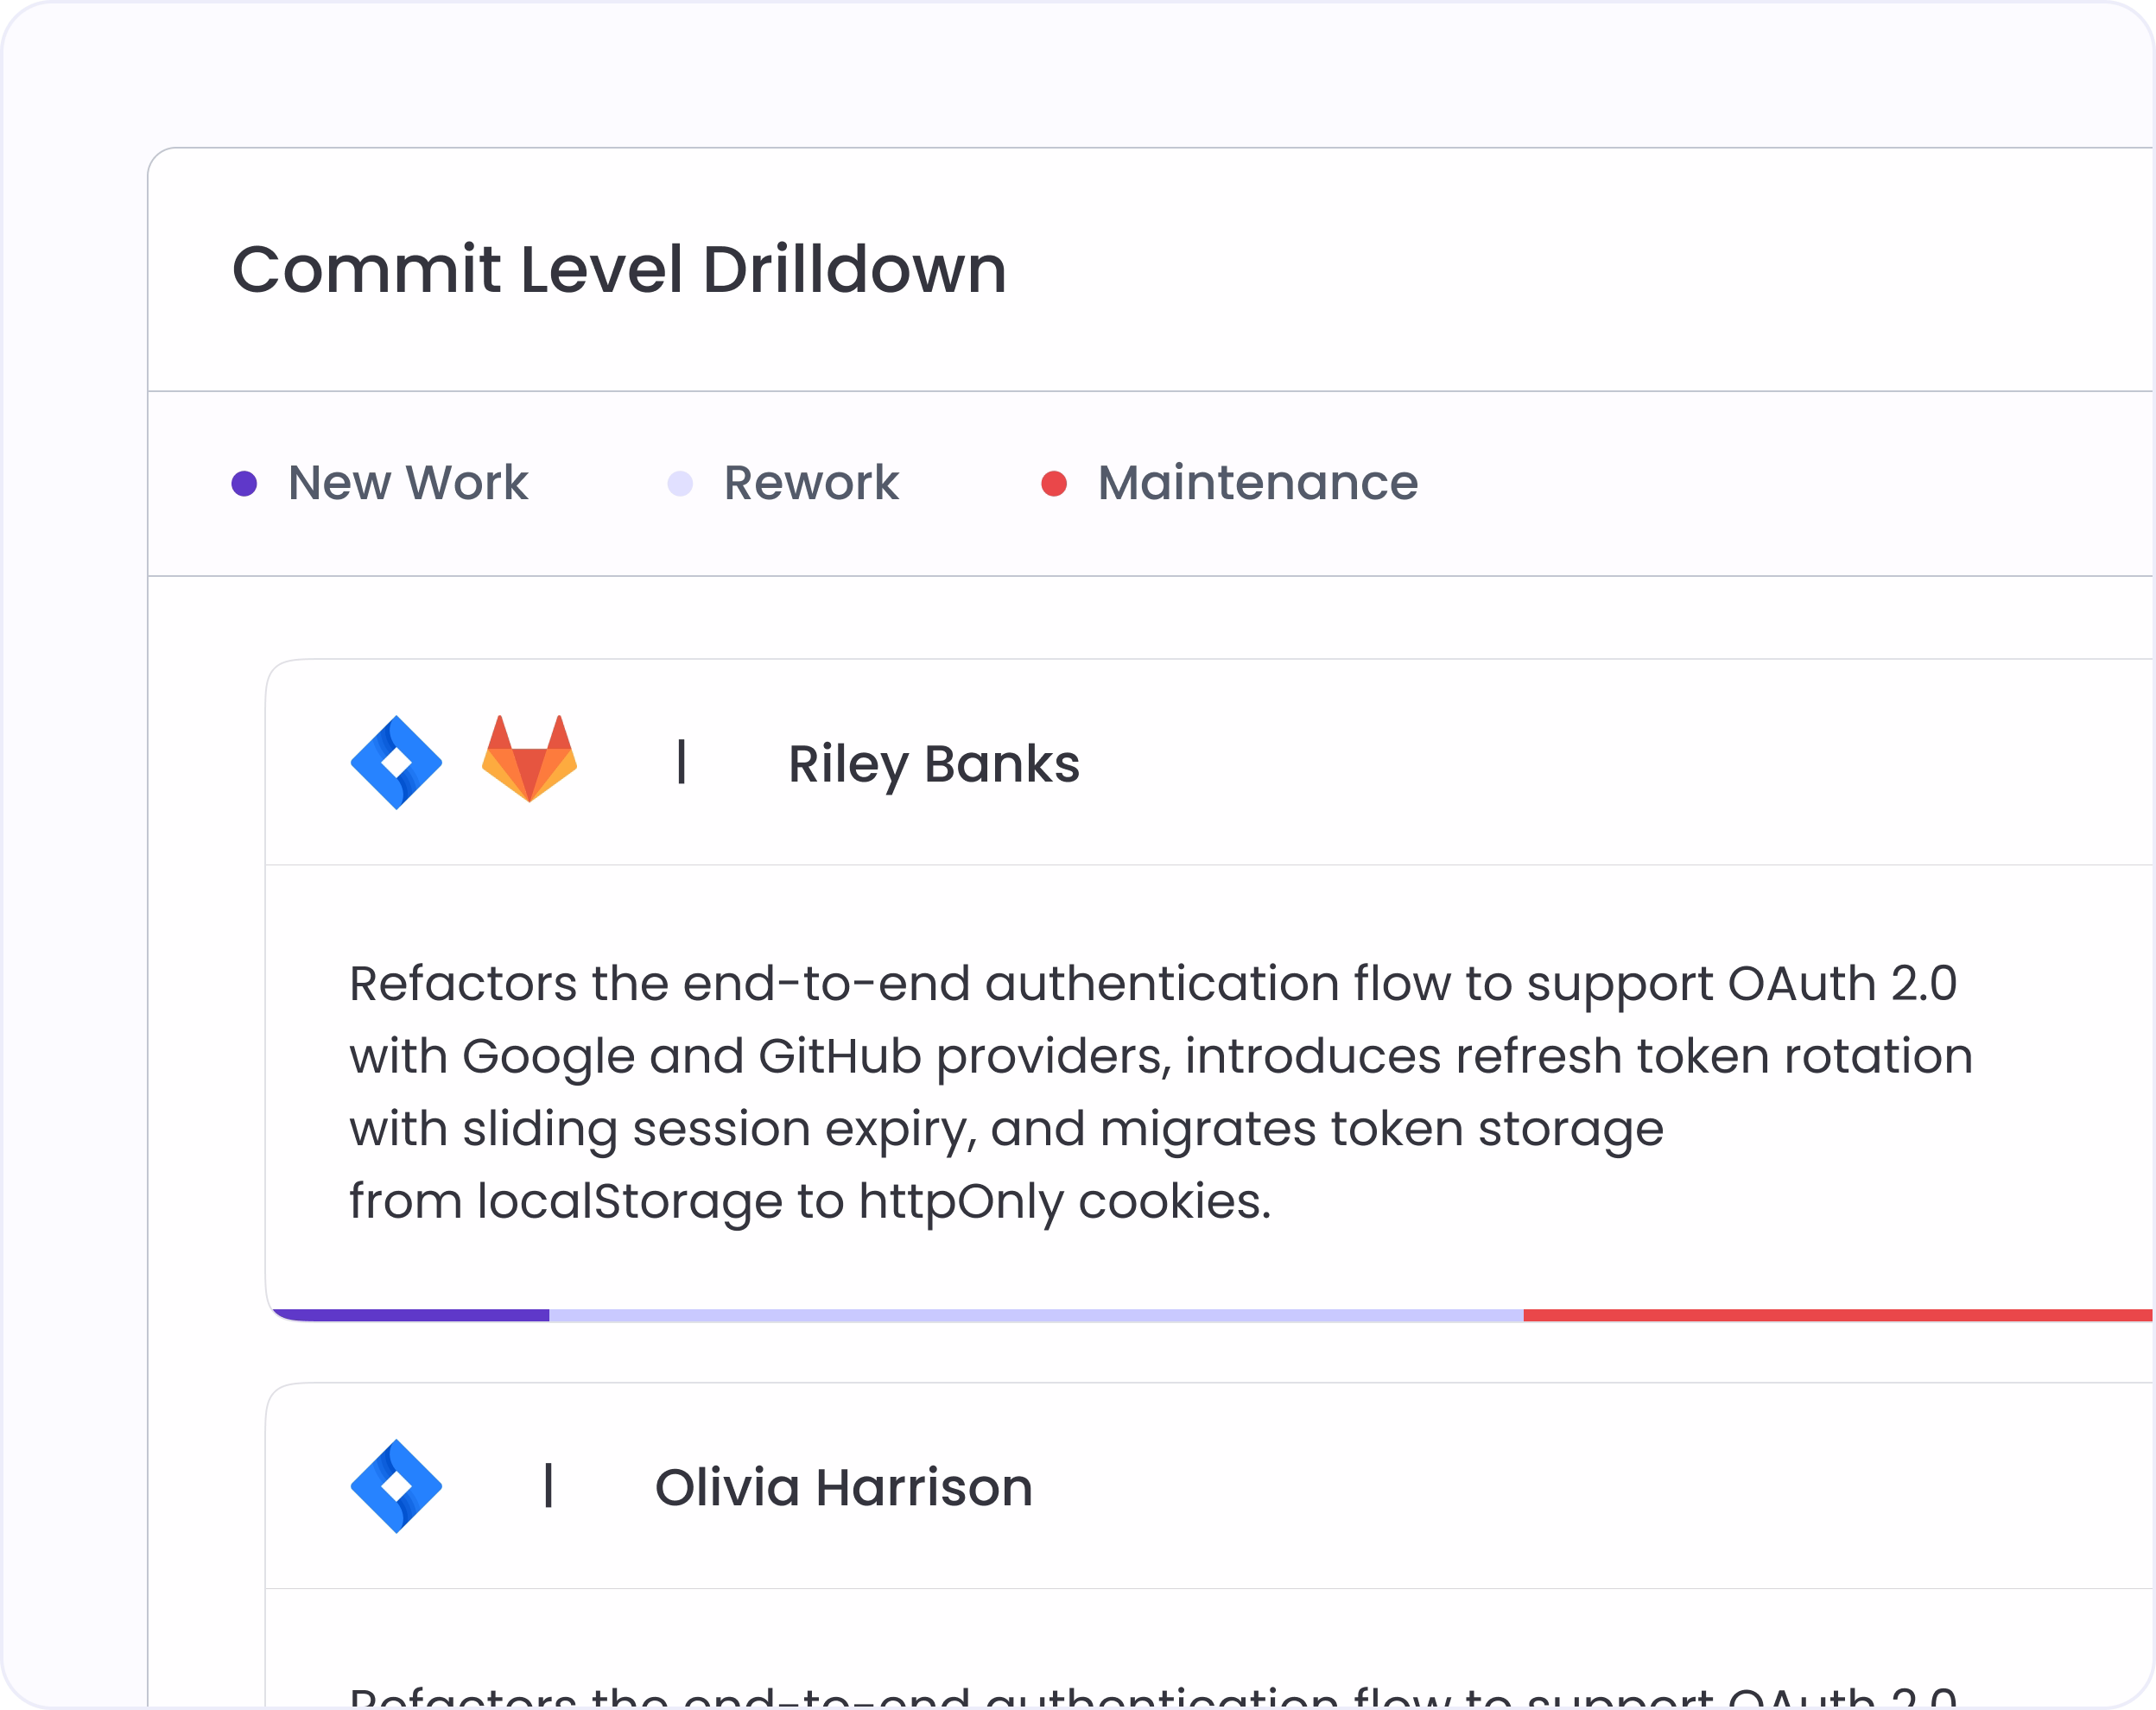
Click any bar and the commits behind it appear, each showing its New Work, Rework, and Maintenance split, the developer who wrote it, and the Jira ticket it belonged to. The sprint lost to rework stops being an abstraction.

See which teams and developers carry the most maintenance burden

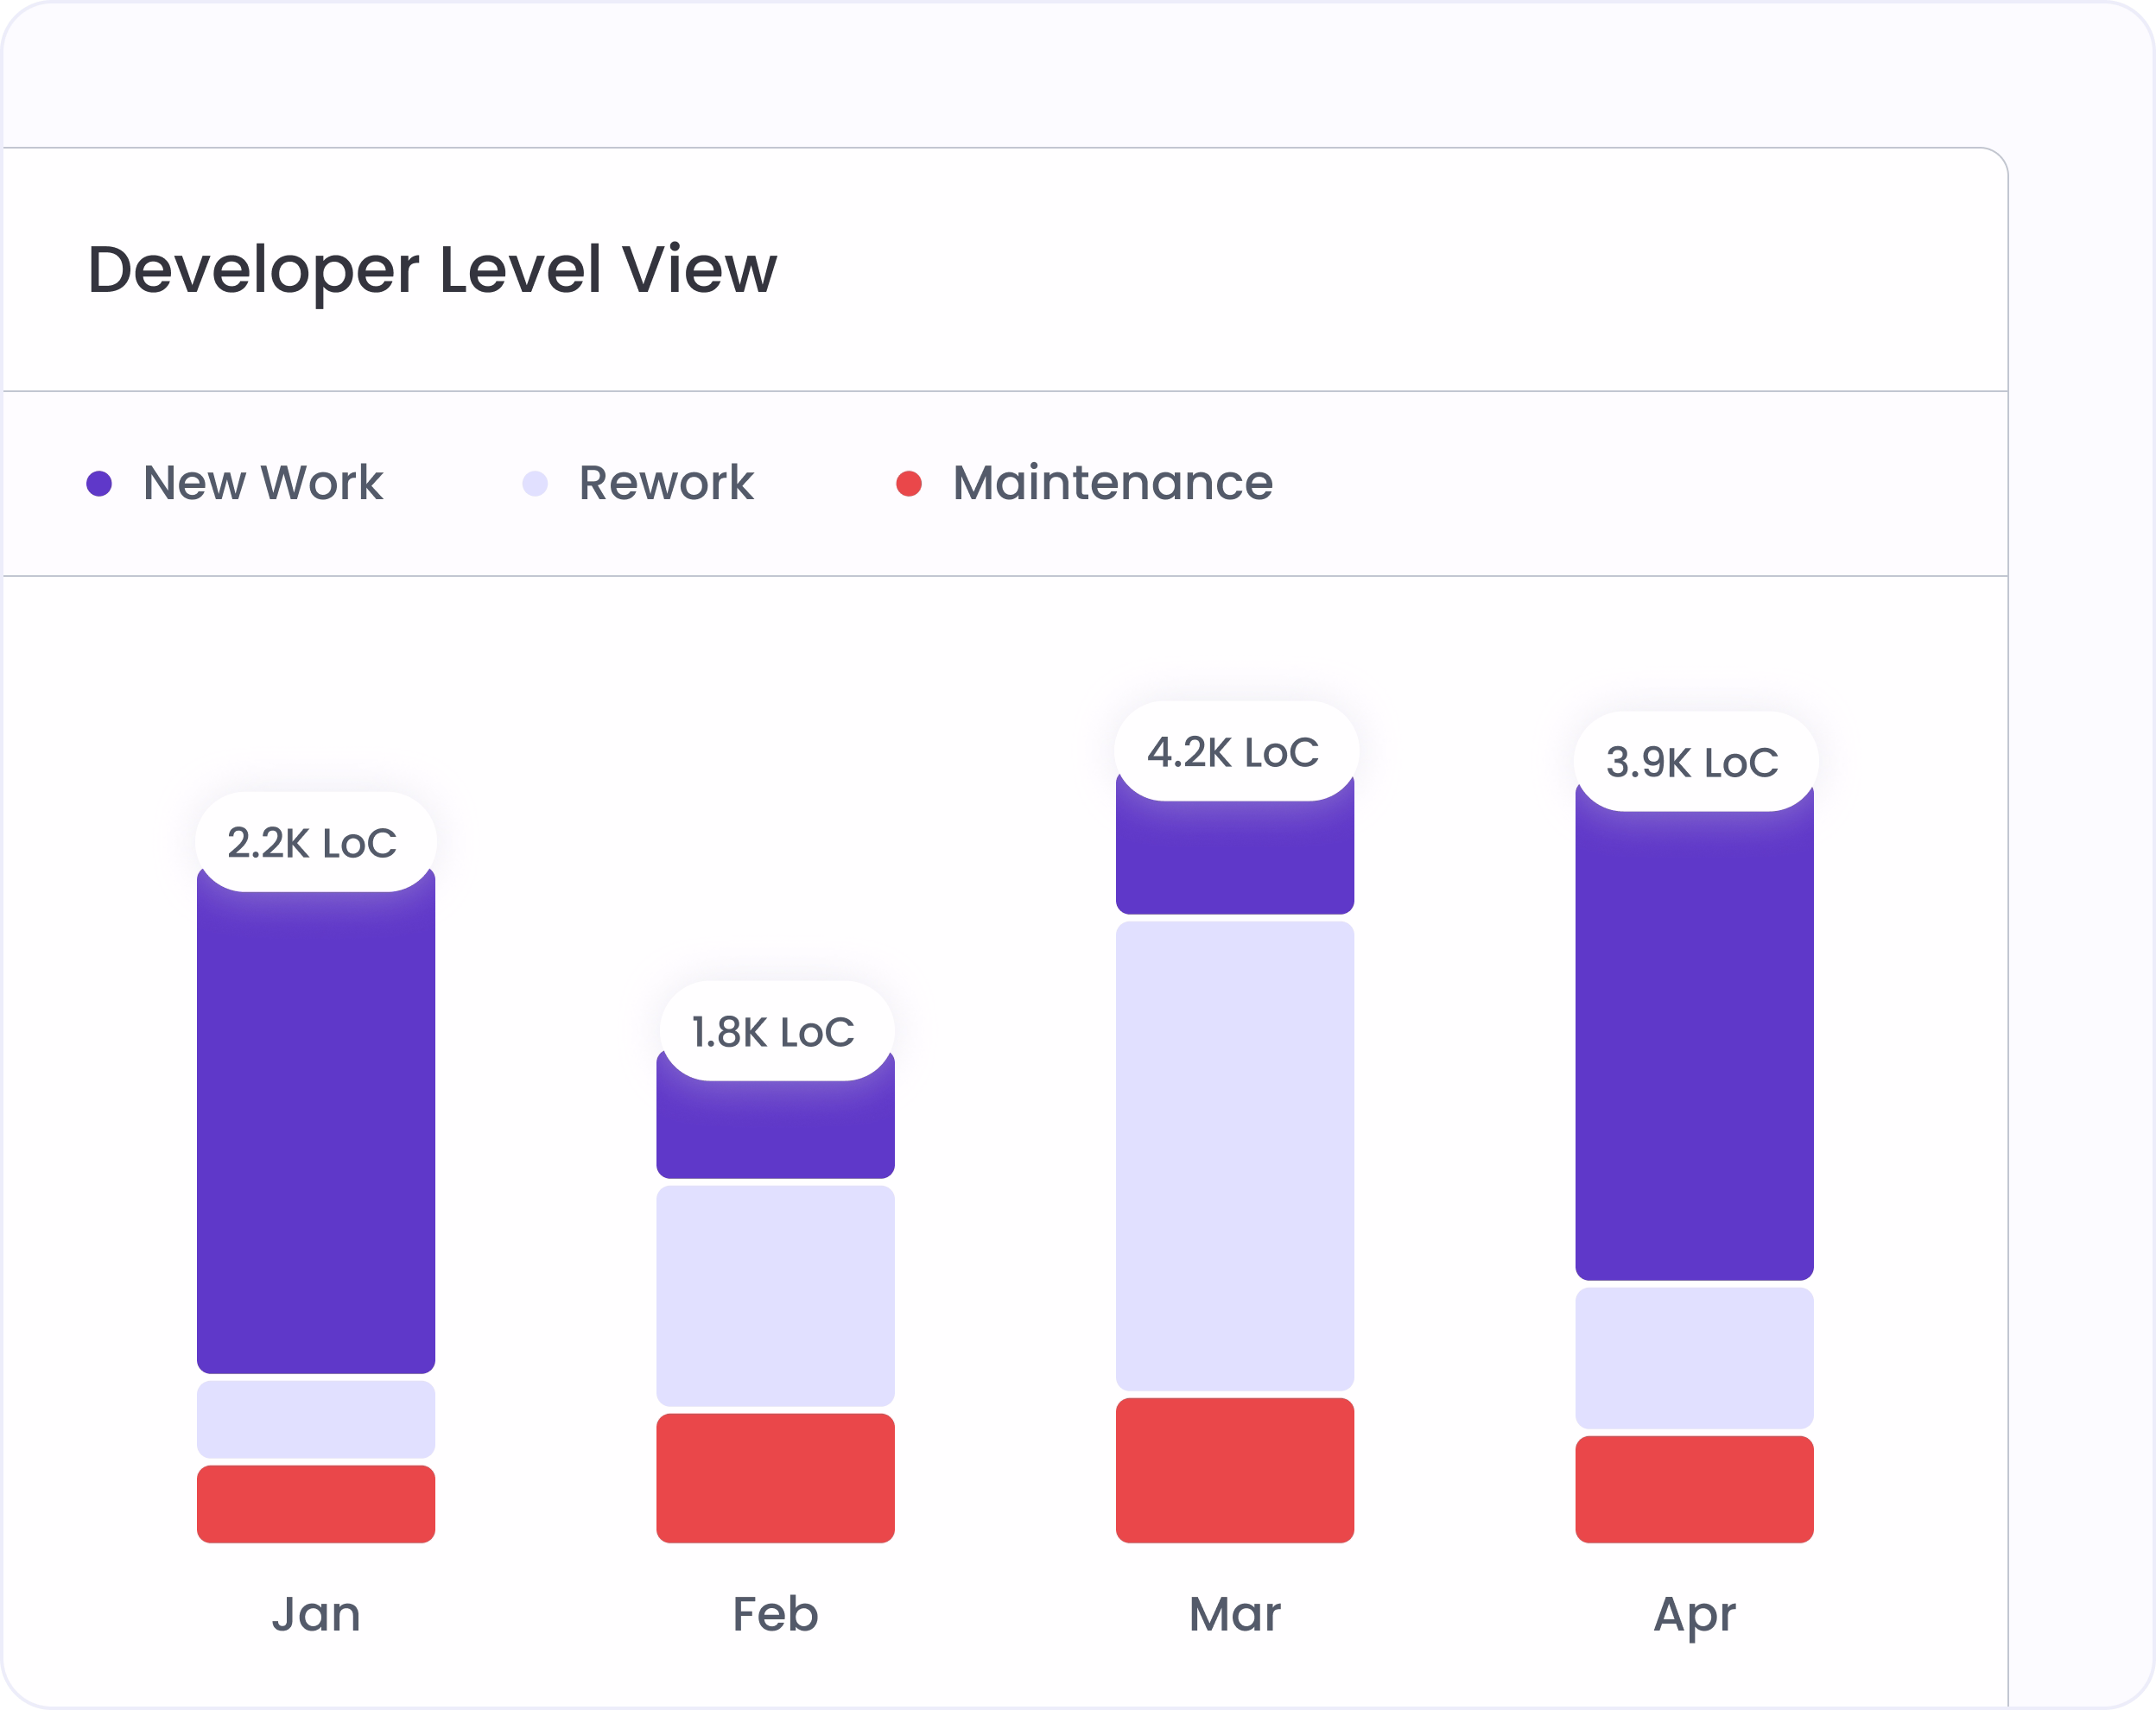
Filter to any team or individual developer for their personal New Work, Rework, and Maintenance split. The developer with the highest maintenance percentage isn't slow. They're probably working in the most compromised part of the codebase.

Track whether AI is shifting capacity toward new work

As AI tools roll out, New Work percentage should climb and Rework should shrink. If rework is flat or rising despite higher AI usage, something earlier in the process (requirements, scoping, review) is generating instability that AI speed can't fix.

Four tabs. Every angle on engineering effort.

Baseline before you improve

Set the New Work, Rework, and Maintenance baseline per team before making process changes. Improvement is only measurable against a starting point.

Unaccounted work filter

Filter to PRs with no linked ticket to see how much effort happens outside the roadmap. Untracked work that shows as rework is the most expensive kind.

Exclude outlier commits

A one-off large refactor skewing the maintenance percentage? Exclude the commit directly. Metrics update immediately.

Repo and workspace scoping

Scope the view to specific repos to compare quality patterns across product areas. The repo with highest rework usually slows feature delivery most.

Hivel × Freshworks Case Study Card
Freshworks NASDAQ: FRSH

How Freshworks measured AI impact across 1,500 engineers — in real time

No standard way to measure AI adoption across 1,500 engineers
Couldn't tell which AI tools were helping vs just running
Surveys were the only answer — slow, expensive, inaccurate
40% Increase in engineering throughput
50% Reduction in rework and maintenance
25% More features released in key business units
10% Improvement in time-to-market

Frequently asked questions

How does Hivel classify code as new work, rework, or maintenance?

New Work is any new line of code written. Rework is code modified or deleted within 30 days of being written: bug fixes, scope changes, integration failures. Maintenance is code modified or deleted that was originally written more than 30 days ago. Calibrated to typical sprint cycles.

Is a high rework percentage always bad?

Not always. Some rework is normal in any agile team. The signal is in the trend. Rework climbing over multiple sprints usually points to unstable requirements or quality gaps. Maintenance climbing usually points to growing technical debt.

Can we use this data to justify a tech debt sprint?

Yes. Filter to the repos or teams with the highest maintenance percentage and show the trend over time. That data makes the case that engineering capacity is being consumed by debt rather than feature delivery, in terms product or finance stakeholders understand.

Trusted by 1000+ Engineering Teams

Vaibhav Bansal
V.P. Engineering
"Hivel has been phenomenal in helping us present our progress to leadership. Its insights into leading indicators have empowered our team leads to enhance review efficiency and ship features faster. Now, we are able to show the impact of our process changes, clearly identify areas of opportunity, and bring in a data-driven culture without spending time pulling manual reports."
Murali Swaminathan
Chief Technology Officer
"We were looking for a unique solution to understand engineering productivity and efficiency, with a single tool that could give leaders complete visibility. We evaluated other comparable tools, but none were comprehensive enough. When we came across Hivel, it checked all the boxes for measuring developer productivity across both AI and non-AI workflows."
Derek Mackie
Director of Engineering
"Using Hivel shone a light on the non-standard aspects of our work, emphasizing the need for crucial adjustments. The insights from Hivel helped us recognize areas for improvement, particularly in managing cycle times and streamlining development workflows. This guidance has been instrumental in our efforts to enhance operational efficiency and productivity."
Leonardo Pinheiro Ferrari
Chief Technology Officer
"Thanks to Hivel, we've seen a staggering 157% improvement in our deployment frequency. By identifying and addressing inefficiencies, and adopting best practices, we've significantly accelerated our progress. Hivel has been instrumental in our journey to operational excellence."
Chris Callander
Senior Engineering Manager
"Hivel has been instrumental in identifying areas for enhancement and guiding our strategic improvements. It has significantly contributed to our journey toward greater operational efficiency. The Activity and Dev360 features in Hivel have been particularly valuable for providing feedback to engineers during 1-1's, enhancing our communication and development practices."
Shiro Theuri
Chief Technology Officer
"Before Hivel, understanding our engineering team's dynamics was a game of guesswork. Now, with Hivel's clear dashboards and insights, our leaders have the clarity and time-saving tools they need to excel. It's been transformative in streamlining our operations."
Koti Reddy
Chief Technology Officer
"Incorporating Hivel into our daily operations has been a game-changer. It's not just a tool; it's a part of our strategic decision-making process, trusted by our leaders at every level. The impact on our engineering efficiency is undeniable and deeply valued."
Manoj Awasthi
Chief Technology Officer
"It has been great to partner with Hivel to get access to insights that help leaders at all levels gain visibility into bottlenecks and challenges that the teams face, build actionable plan to resolve them and track the progress over time. And thanks for the fantastic support!"
Ameen M
Engineering Manager
"Hivel has made a huge difference to how I manage my teams. Before every one-on-one or appraisal, I rely on it to dive into developer metrics and drive truly meaningful conversations. It helps me spot rework patterns, reward high performers, and benchmark our teams even against our US counterparts. The dashboards are intuitive, insightful, and honestly far more actionable than anything we get from Jira."
Paras Sood
Associate Director
"Hivel's insights have been pivotal in refining our engineering processes, elevating both efficiency and the developer experience. We're now making smarter decisions, faster, thanks to Hivel."
Vaibhav Bansal
V.P. Engineering
"Hivel has been phenomenal in helping us present our progress to leadership. Its insights into leading indicators have empowered our team leads to enhance review efficiency and ship features faster. Now, we are able to show the impact of our process changes, clearly identify areas of opportunity, and bring in a data-driven culture without spending time pulling manual reports."
Murali Swaminathan
Chief Technology Officer
“We were looking for a unique solution to understand engineering productivity and efficiency, with a single tool that could give leaders complete visibility. We evaluated other comparable tools, but none were comprehensive enough. When we came across Hivel, it checked all the boxes for measuring developer productivity across both AI and non-AI workflows.”
Vaibhav Bansal
V.P. Engineering
"Hivel has been phenomenal in helping us present our progress to leadership. Its insights into leading indicators have empowered our team leads to enhance review efficiency and ship features faster. Now, we are able to show the impact of our process changes, clearly identify areas of opportunity, and bring in a data-driven culture without spending time pulling manual reports."
Derek Mackie
Director of Engineering
"Using Hivel shone a light on the non-standard aspects of our work, emphasizing the need for crucial adjustments. The insights from Hivel helped us recognize areas for improvement, particularly in managing cycle times and streamlining development workflows. This guidance has been instrumental in our efforts to enhance operational efficiency and productivity."
Leonardo Pinheiro Ferrari
Chief Technology Officer
"Thanks to Hivel, we've seen a staggering 157% improvement in our deployment frequency. By identifying and addressing inefficiencies, and adopting best practices, we've significantly accelerated our progress. Hivel has been instrumental in our journey to operational excellence."

"The only tool our entire leadership team actually trusts"