Book a demo
We'll show you exactly how AI is impacting your speed and code quality.
4.7/5


We'll show you exactly how AI is impacting your speed and code quality.
Hivel gives platform engineering teams one view of developer productivity outcomes, platform delivery health, AI tool adoption, and infrastructure investment impact. Prove the platform is moving dev velocity, not just shipping internal tools.
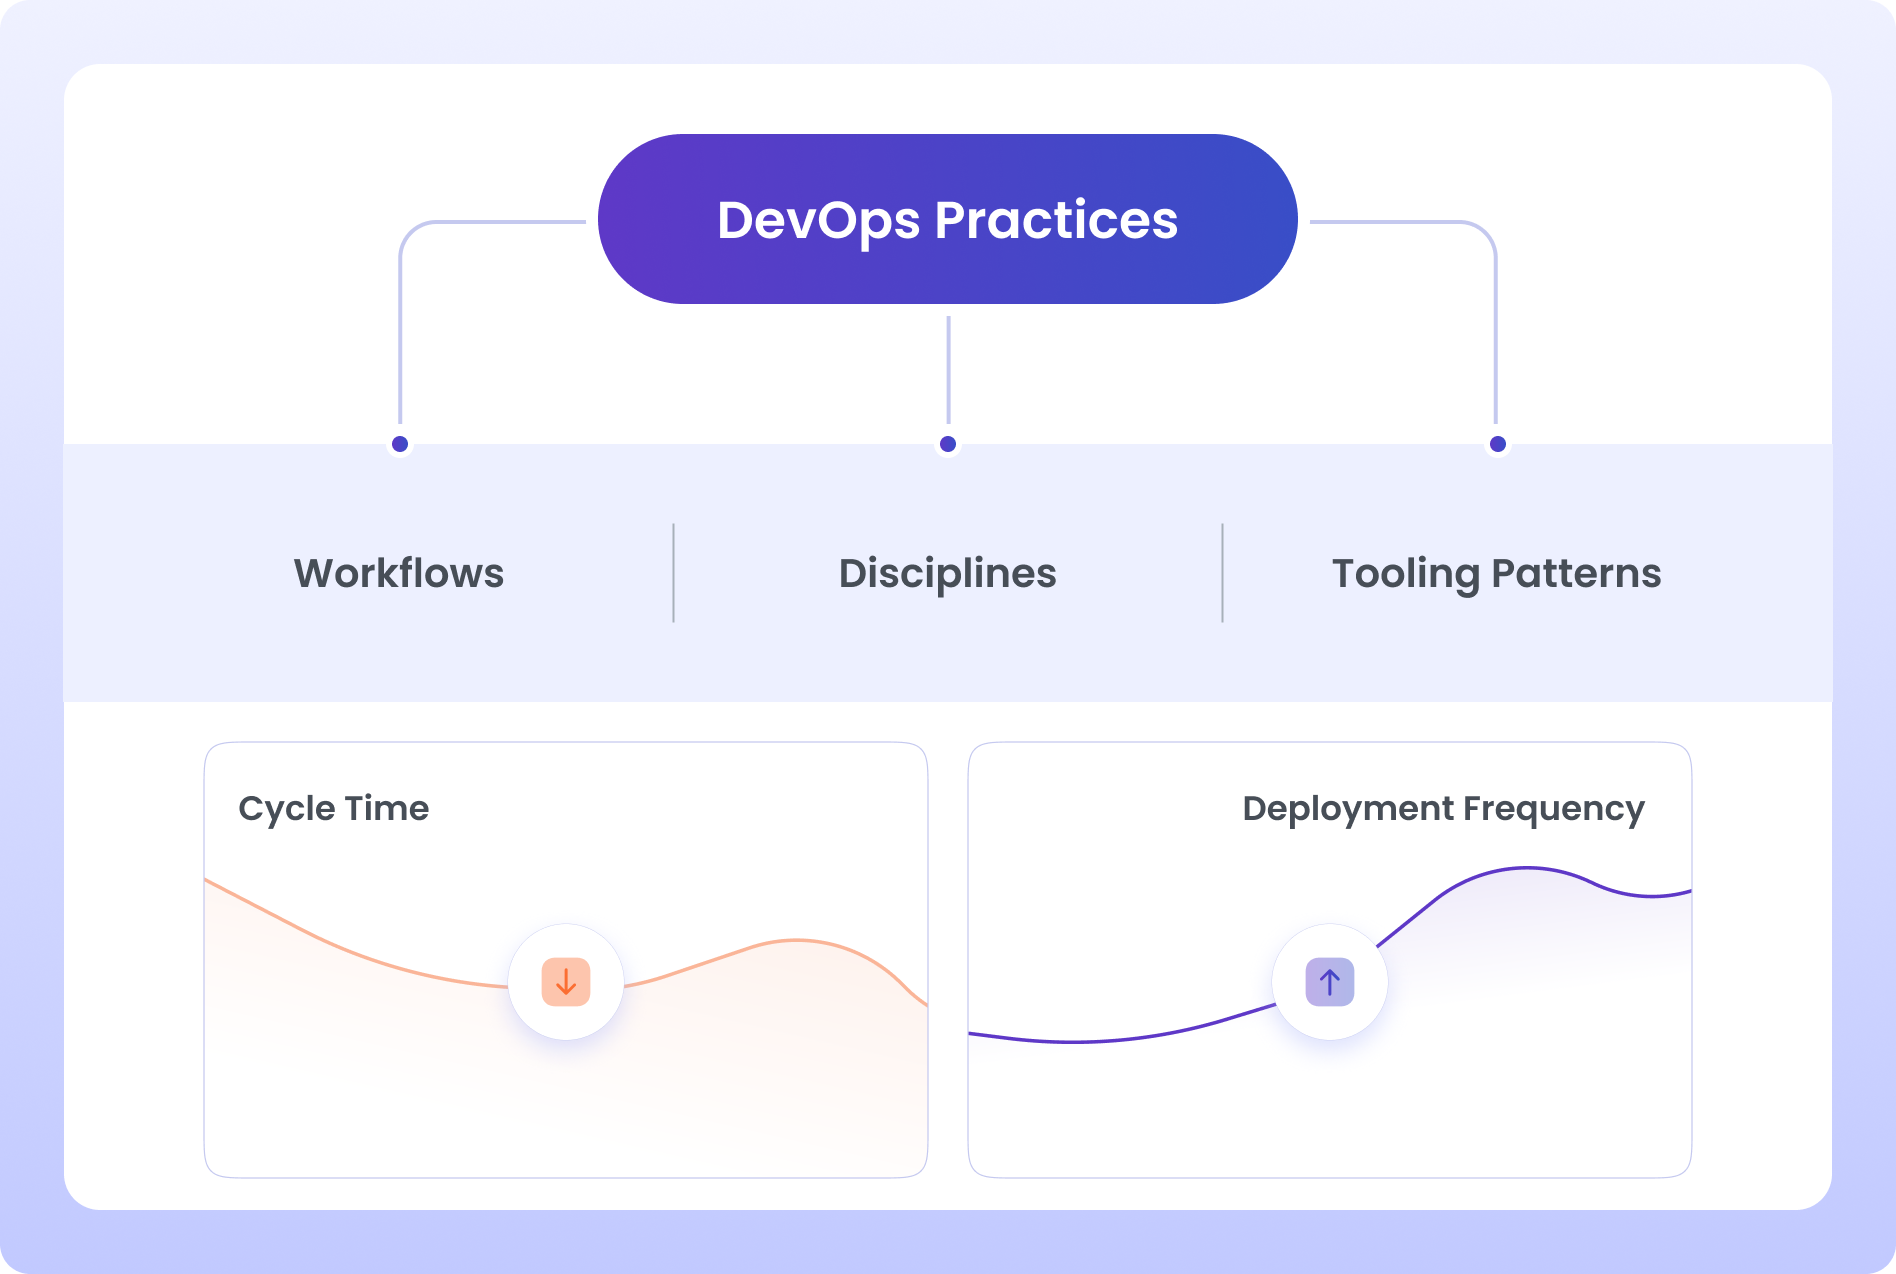
You build internal tools, golden paths, and developer infrastructure. The teams who adopt them ship faster. The teams who don't keep raising tickets. The data showing which is which sits across five different systems.
Developer satisfaction surveys run twice a year and tell you sentiment, not outcomes. Whether your platform actually moved cycle time and deployment frequency stays unmeasured.
A new internal tool launches. Three teams pilot. Six months later, nobody can tell you who's on the golden path and who's still on legacy.
Infrastructure cost is a line item. Whether that investment translated into faster delivery, fewer incidents, or better developer experience is a question Finance keeps asking and platform can't answer.
Compare delivery metrics across product teams to see where golden path adoption correlates with faster cycle time, higher deployment frequency, and lower rework. Replace twice-a-year sentiment surveys with continuous outcome data the platform team can act on every sprint.
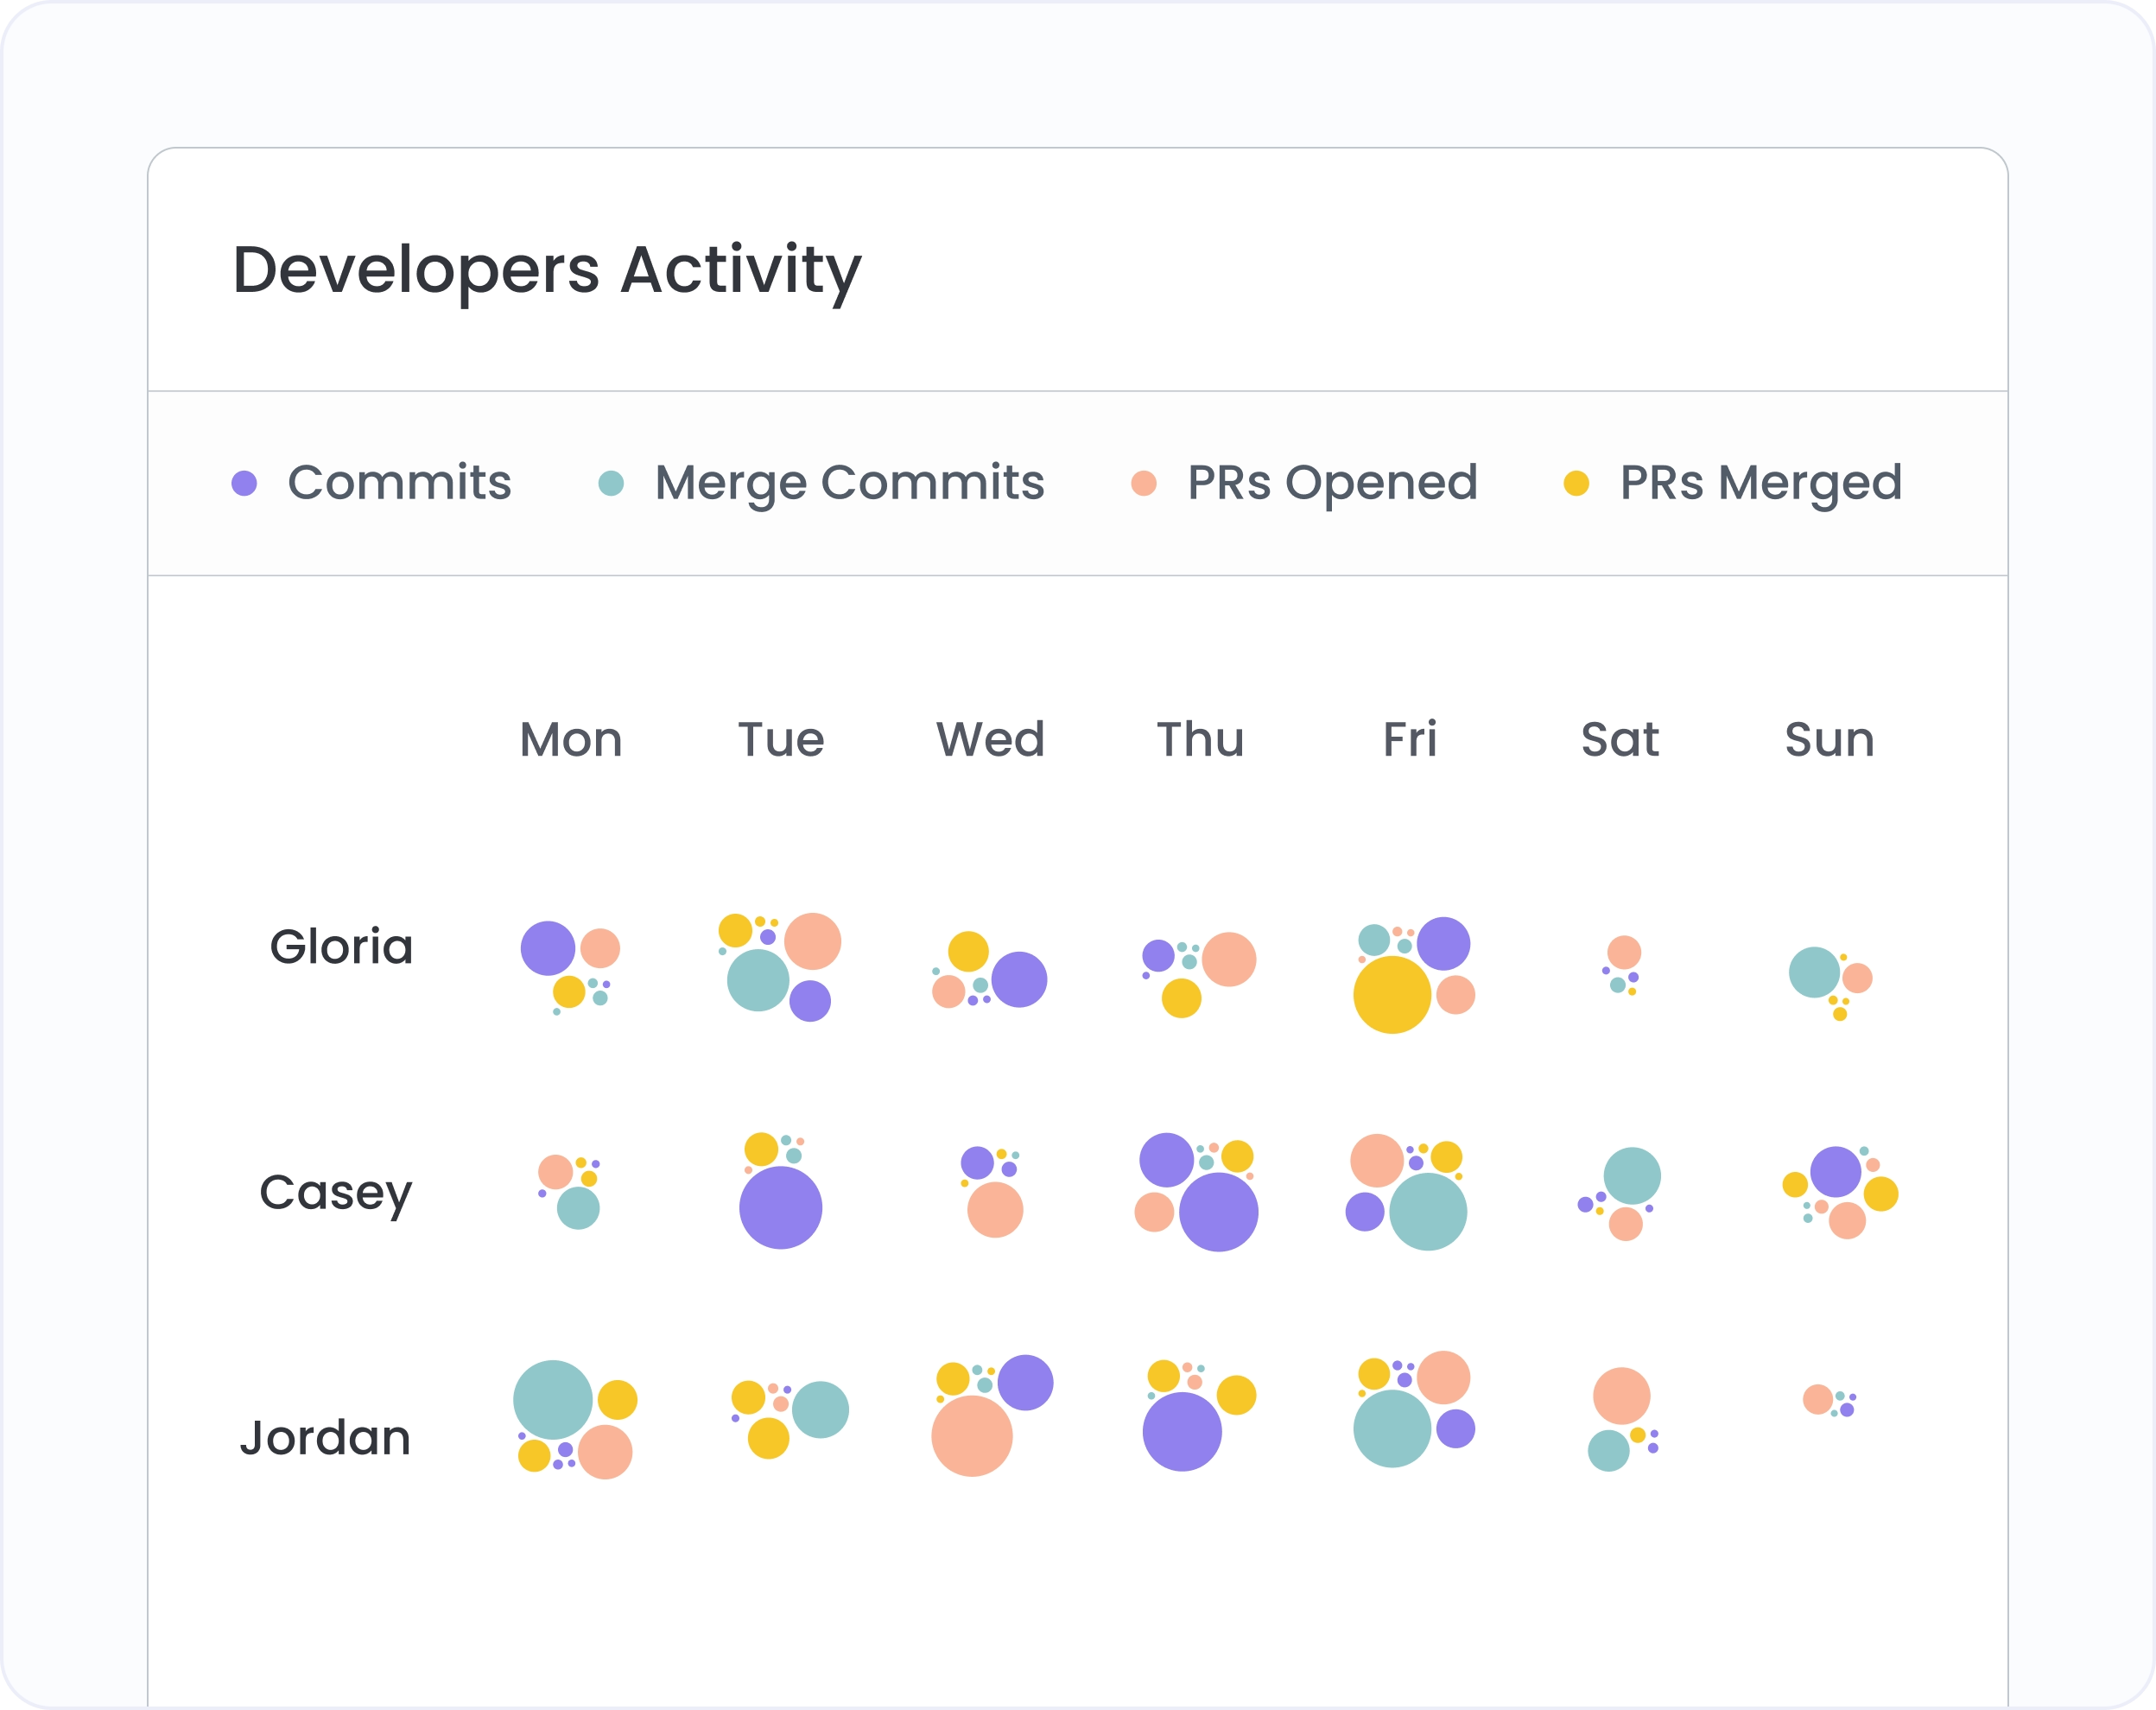
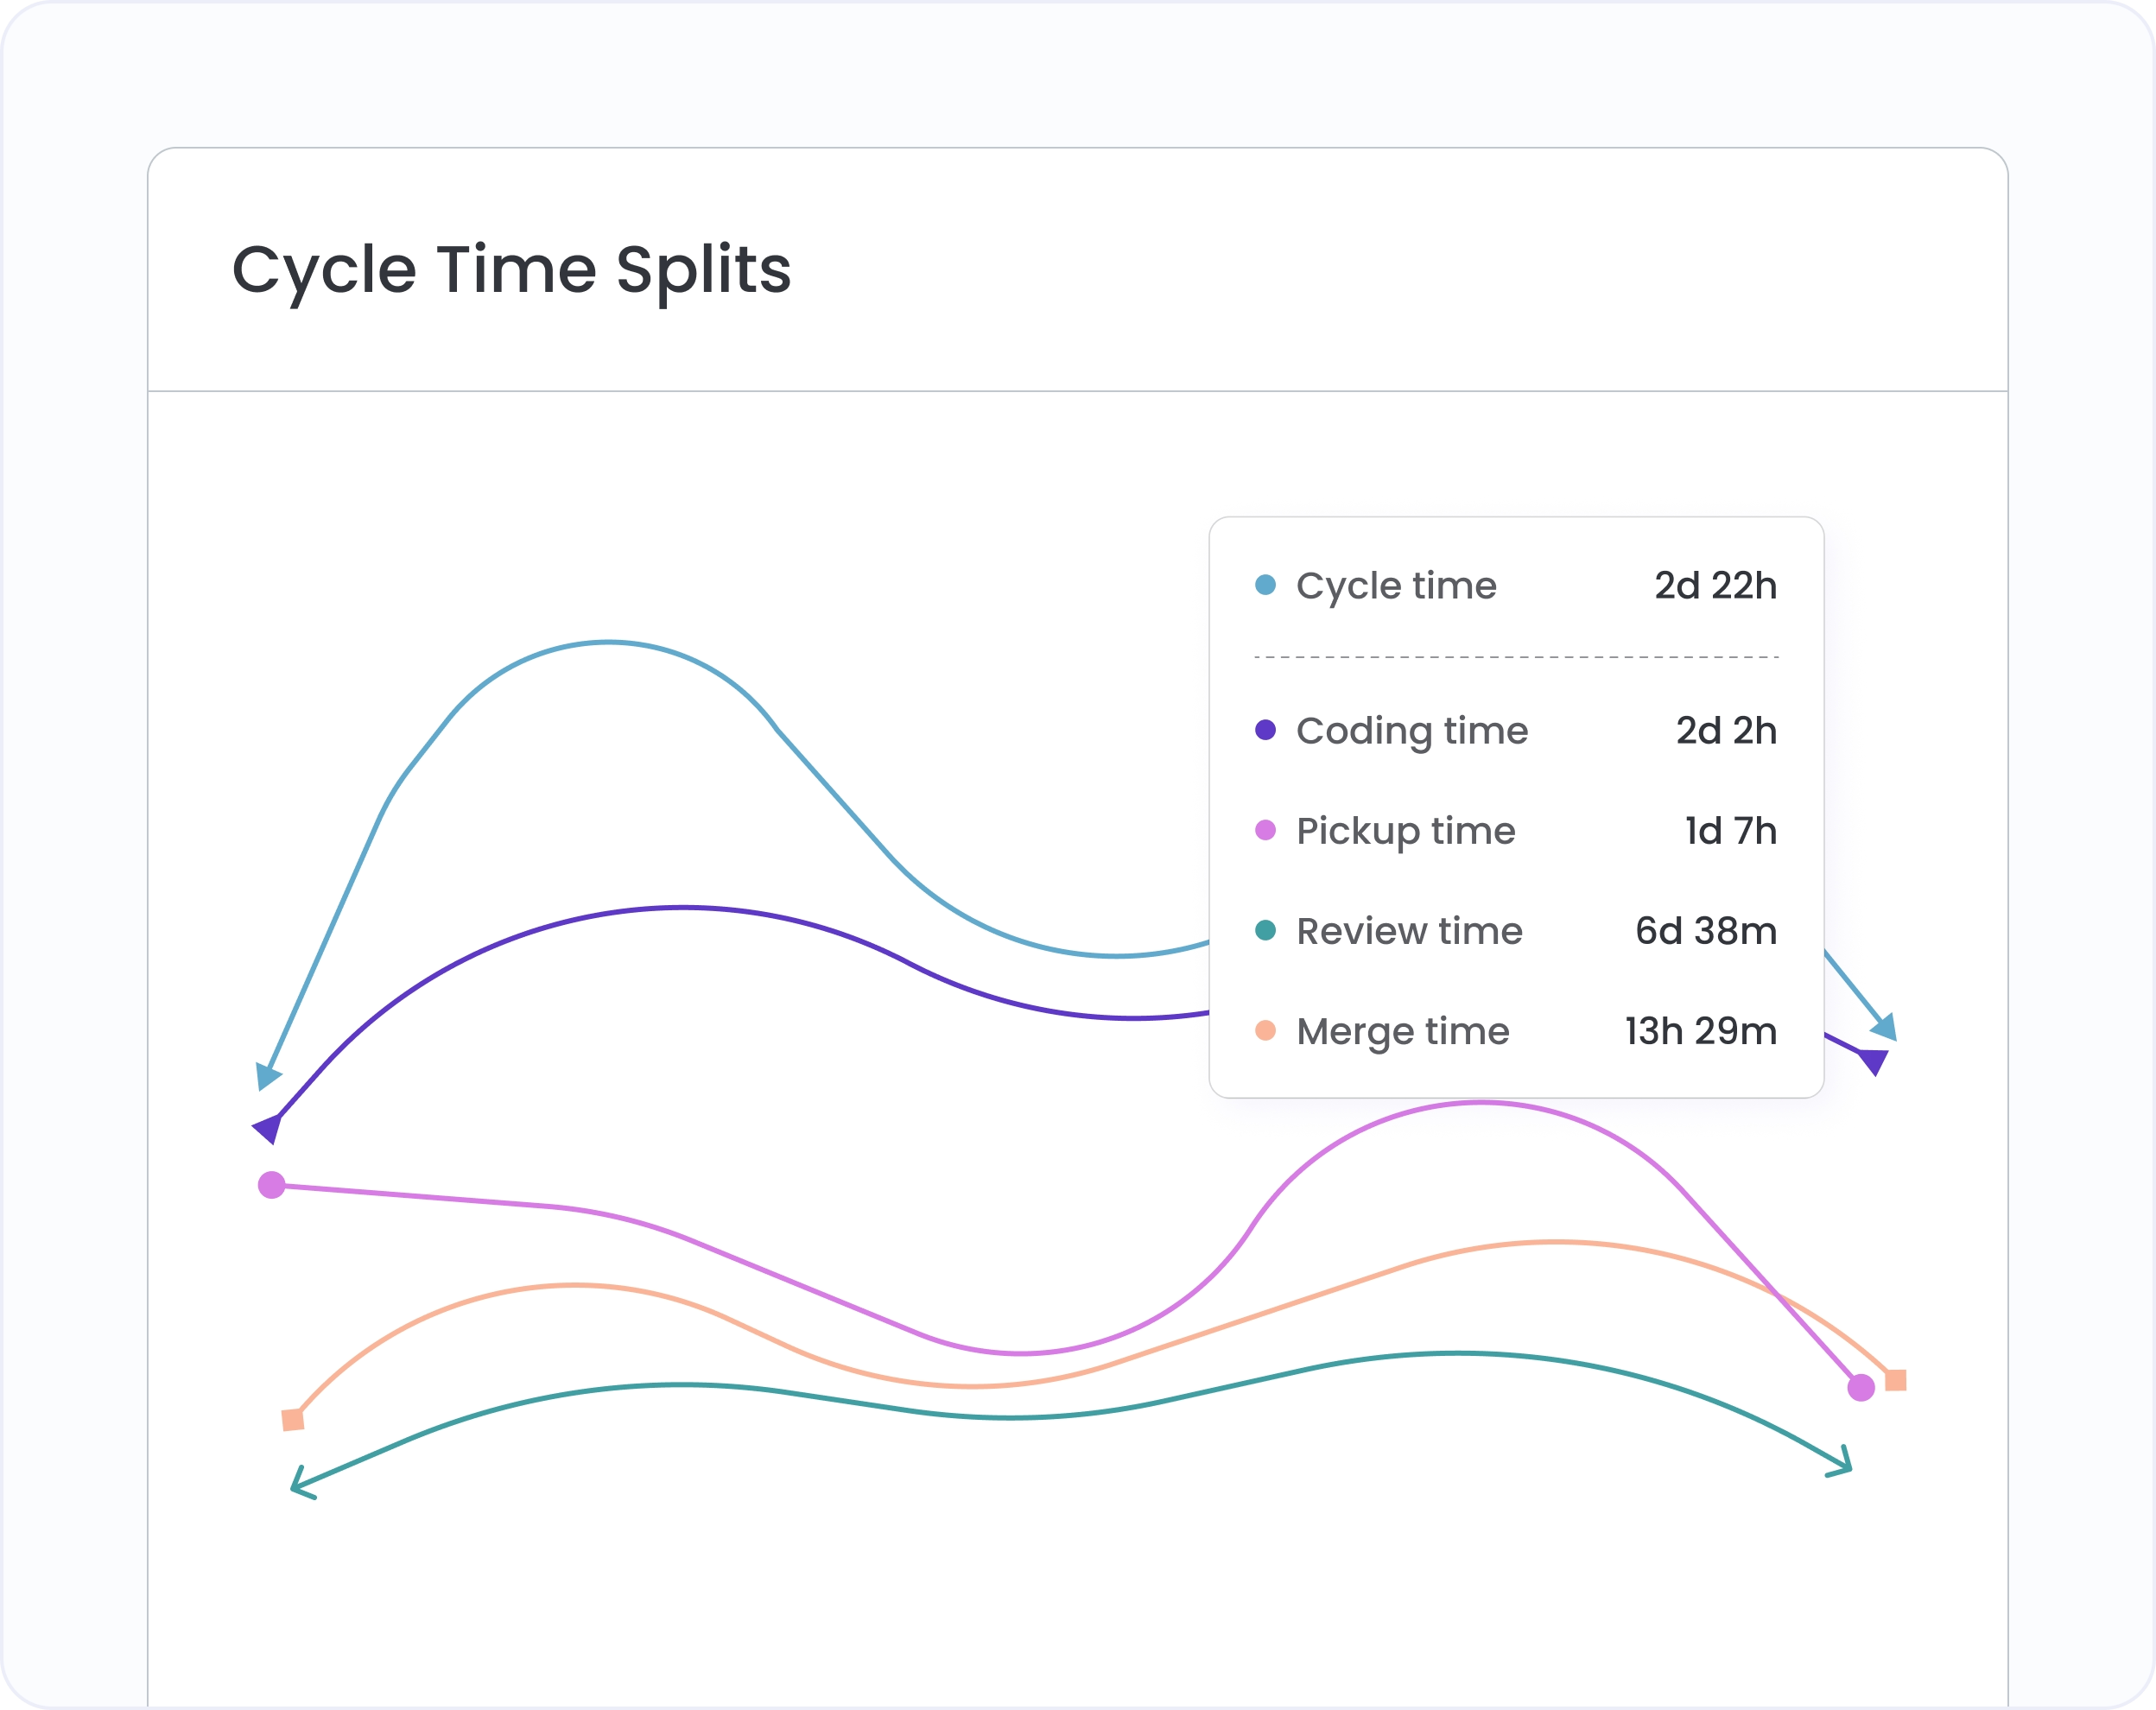
Run the same delivery dashboards on the platform team that product teams use. Cycle time, review coverage, sprint completion, rework percentage. The internal tool builder gets held to the same standards as the teams it serves.
See AI tool adoption depth across every team your platform supports. Identify power users, surface laggard teams, and target enablement where it lands. Make the rollout decision with data instead of assuming uniform adoption from a license purchase.
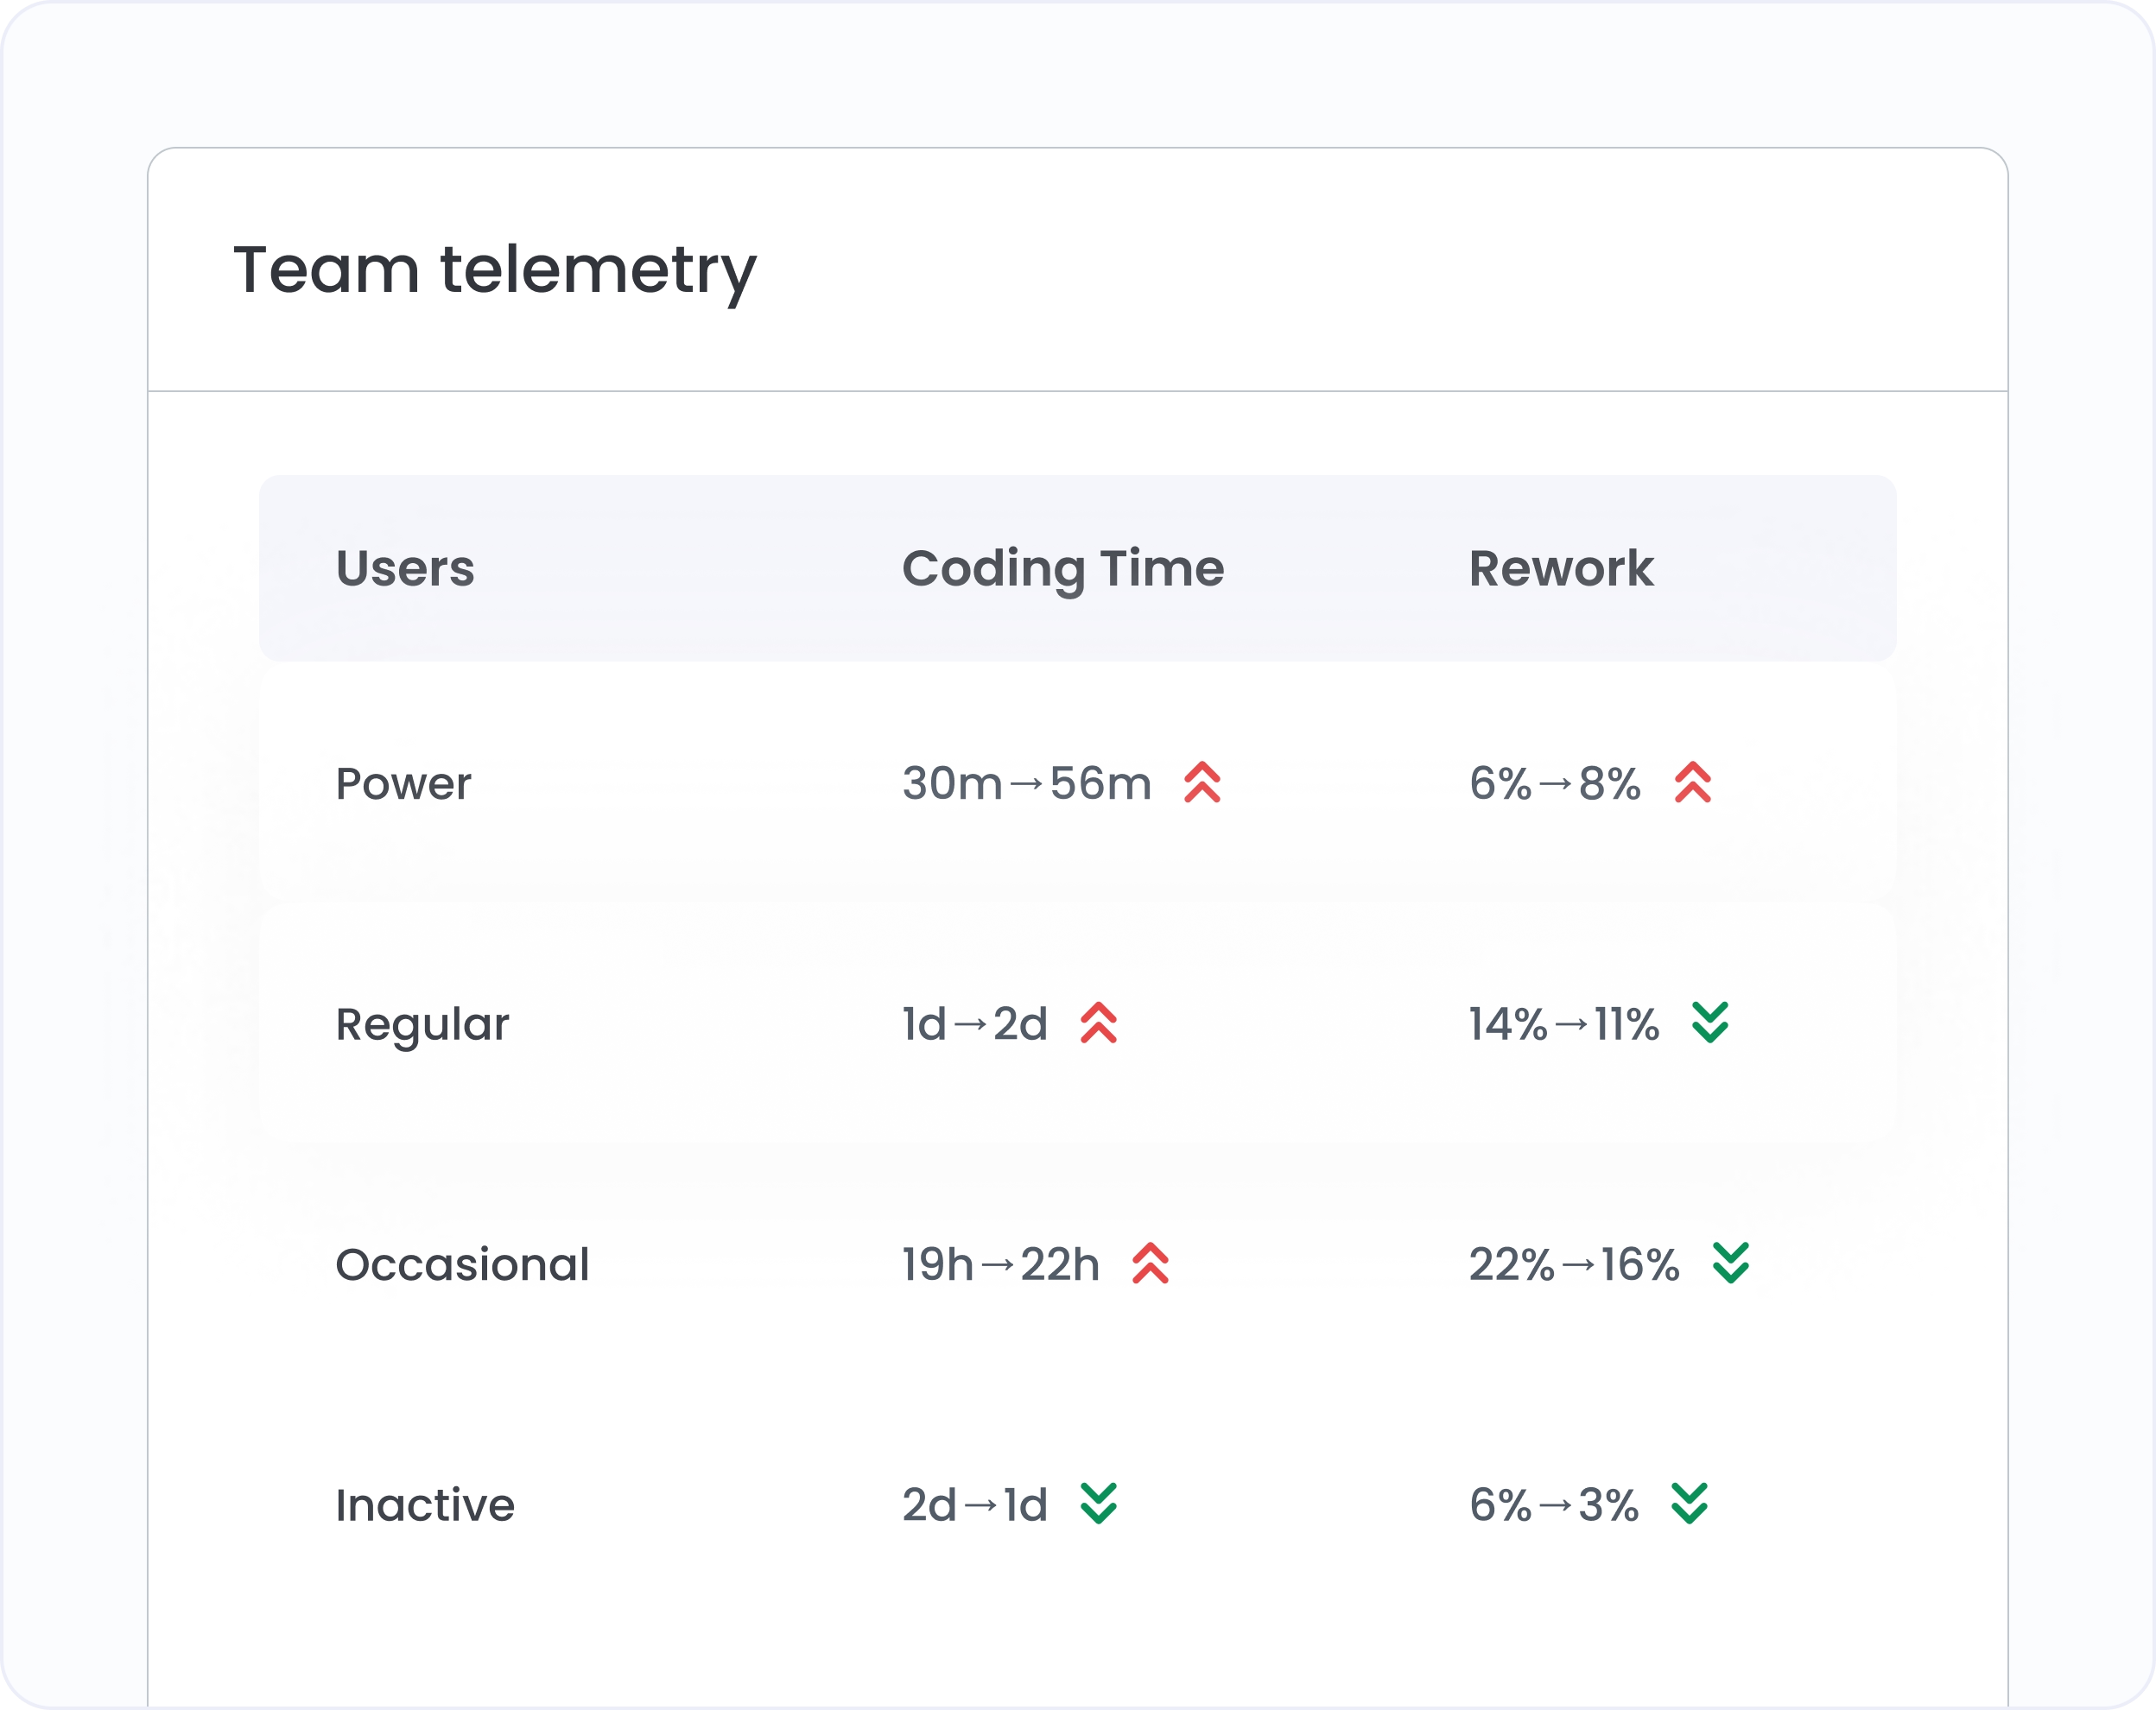
Compare infrastructure spend trends against delivery outcomes quarter over quarter. When cycle time dropped and deployment frequency climbed, the data shows whether platform investment caused it. The answer Finance keeps asking for, calculated continuously.
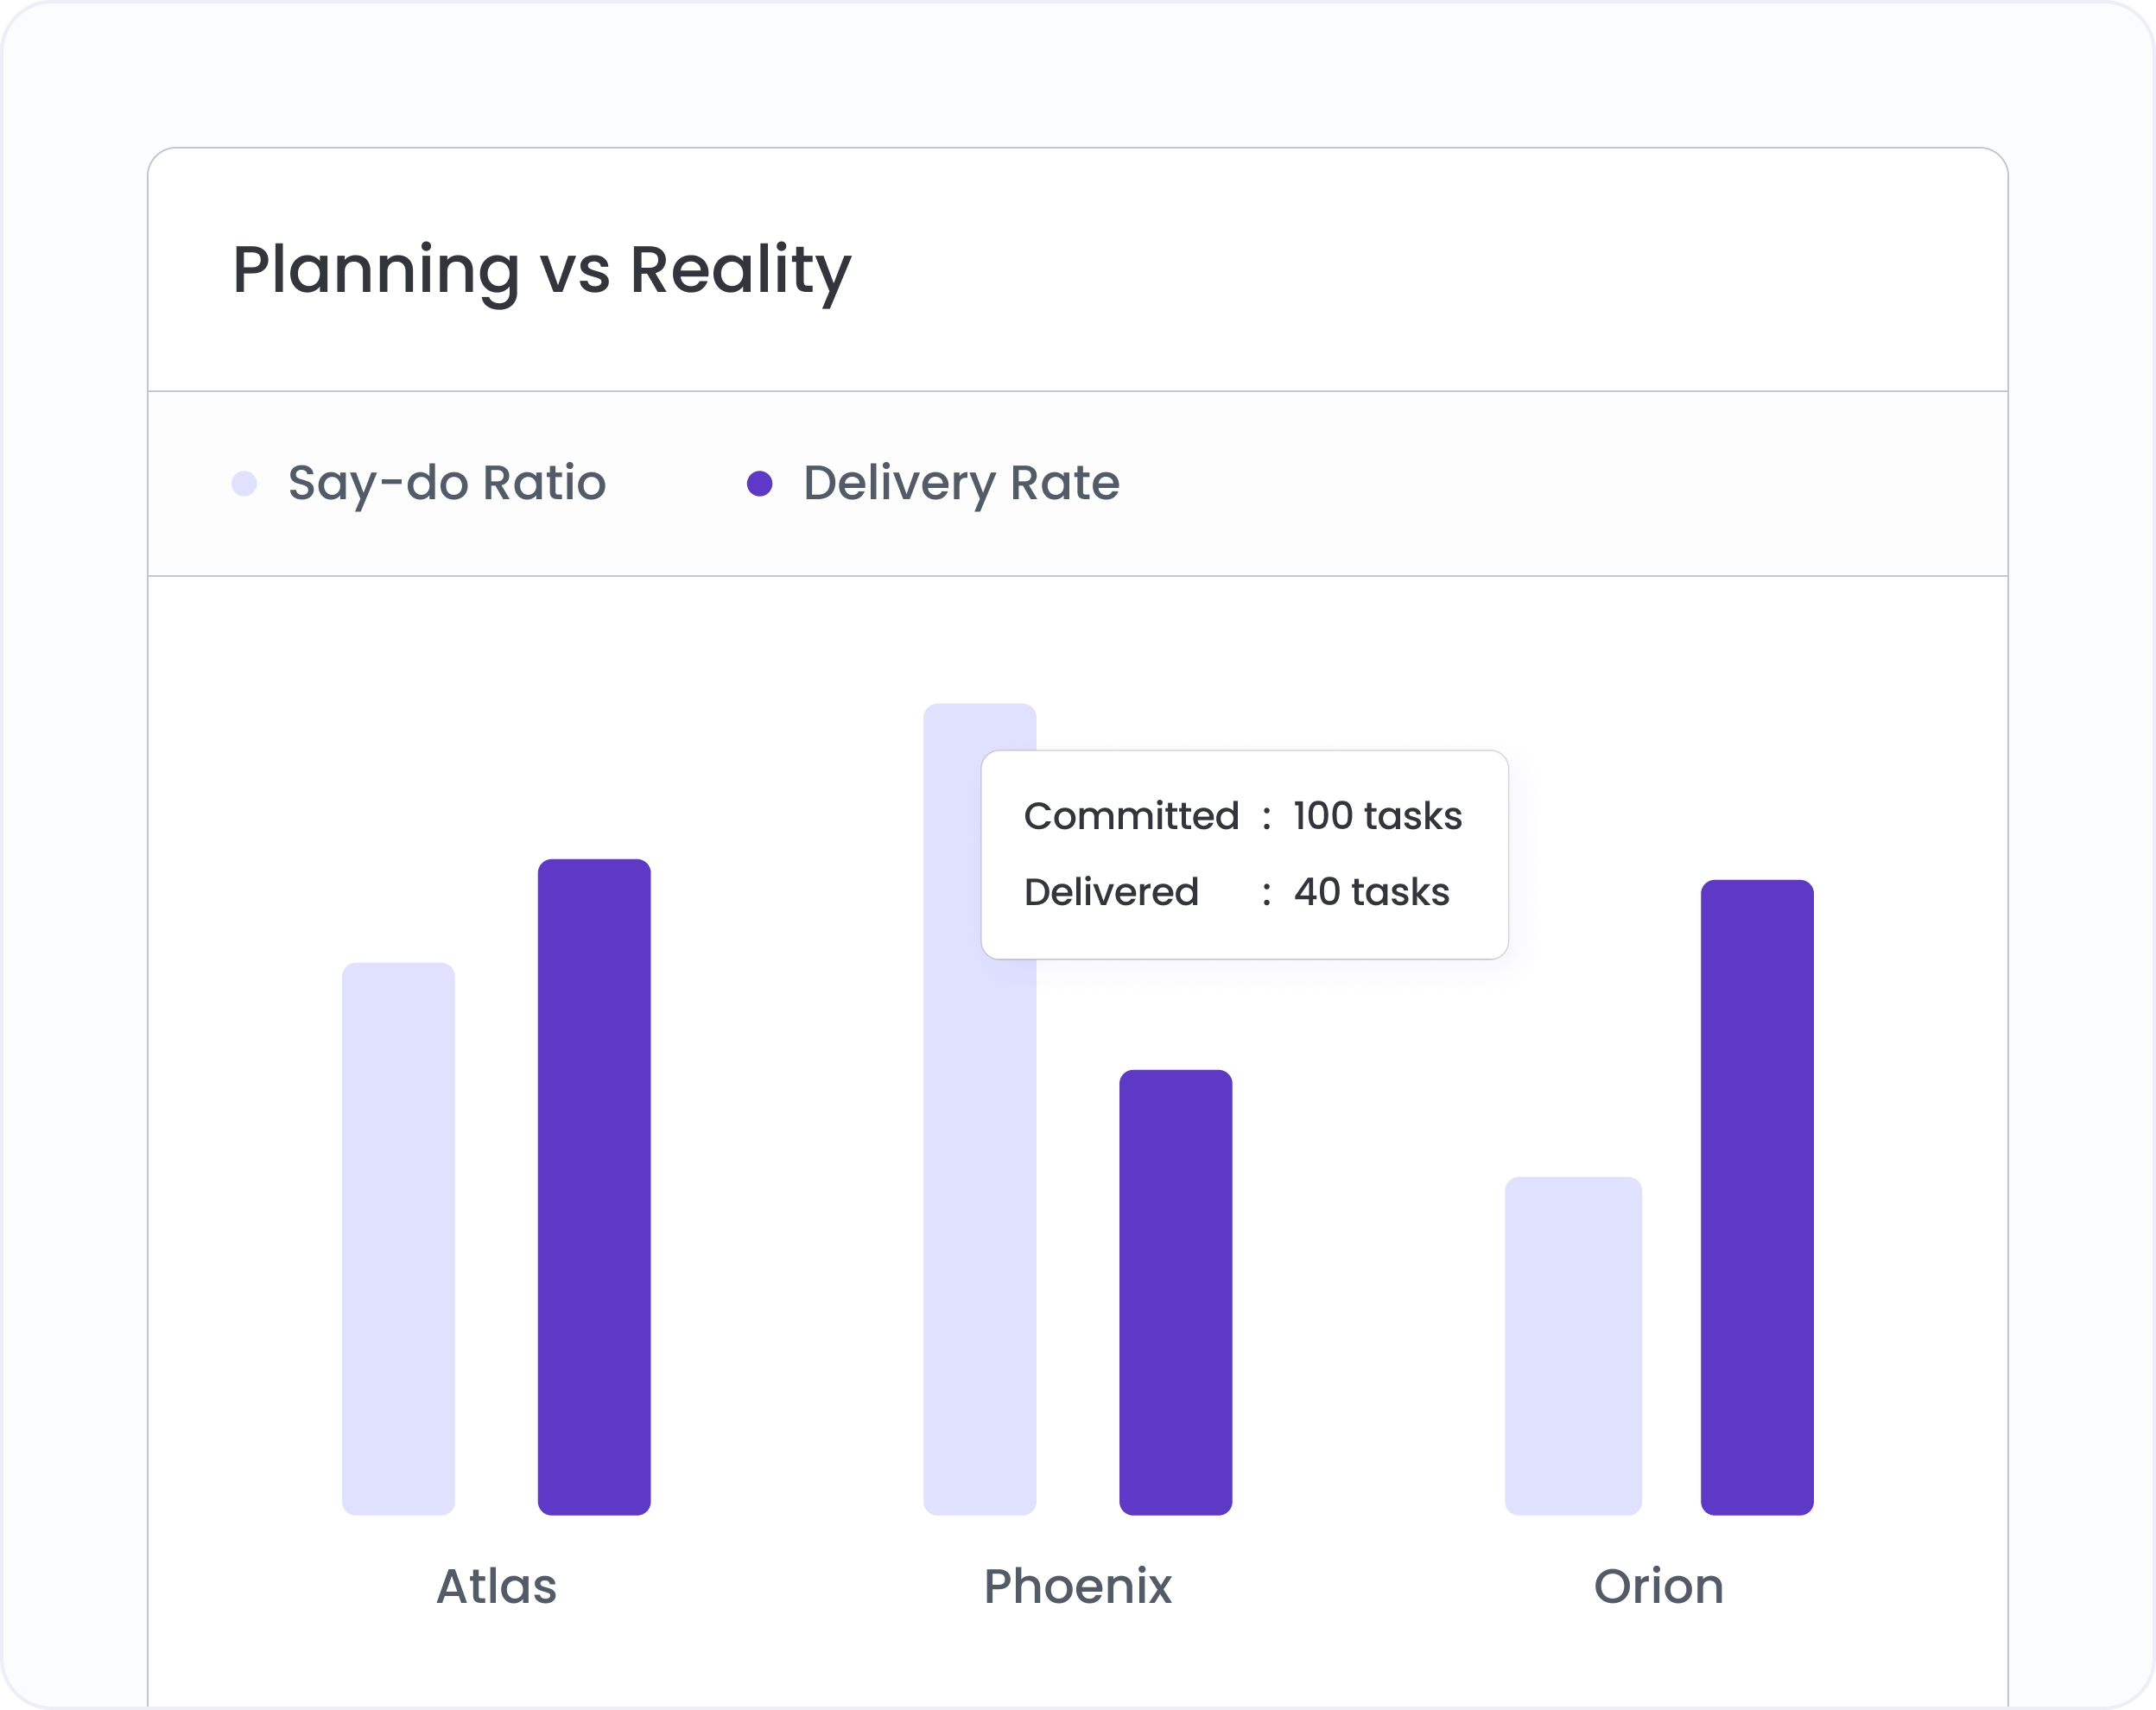

Tag teams or repos with custom labels (golden path, legacy, hybrid) using Hivel's team configuration. Compare delivery metrics across labeled cohorts to see where adoption correlates with cycle time, deployment frequency, and rework improvements.
Both. Every dashboard supports team-level scoping, so the platform team gets the same delivery health view as product teams. Useful for measuring the platform team's own throughput, review coverage, and sprint accuracy.
Yes. The AI Impact view supports per-tool breakdowns. See adoption depth, AI code percentage, and delivery metrics for each tool side by side. Useful when running AI tool pilots across different teams or evaluating renewal decisions.


.svg)
.png)