We'll show you exactly how AI is impacting your speed and code quality.


Copilot and Cursor are doubling merge rates. Hivel's DORA metrics show whether that speed is improving delivery health or quietly raising your failure rate. All four metrics, standardized, in one view.
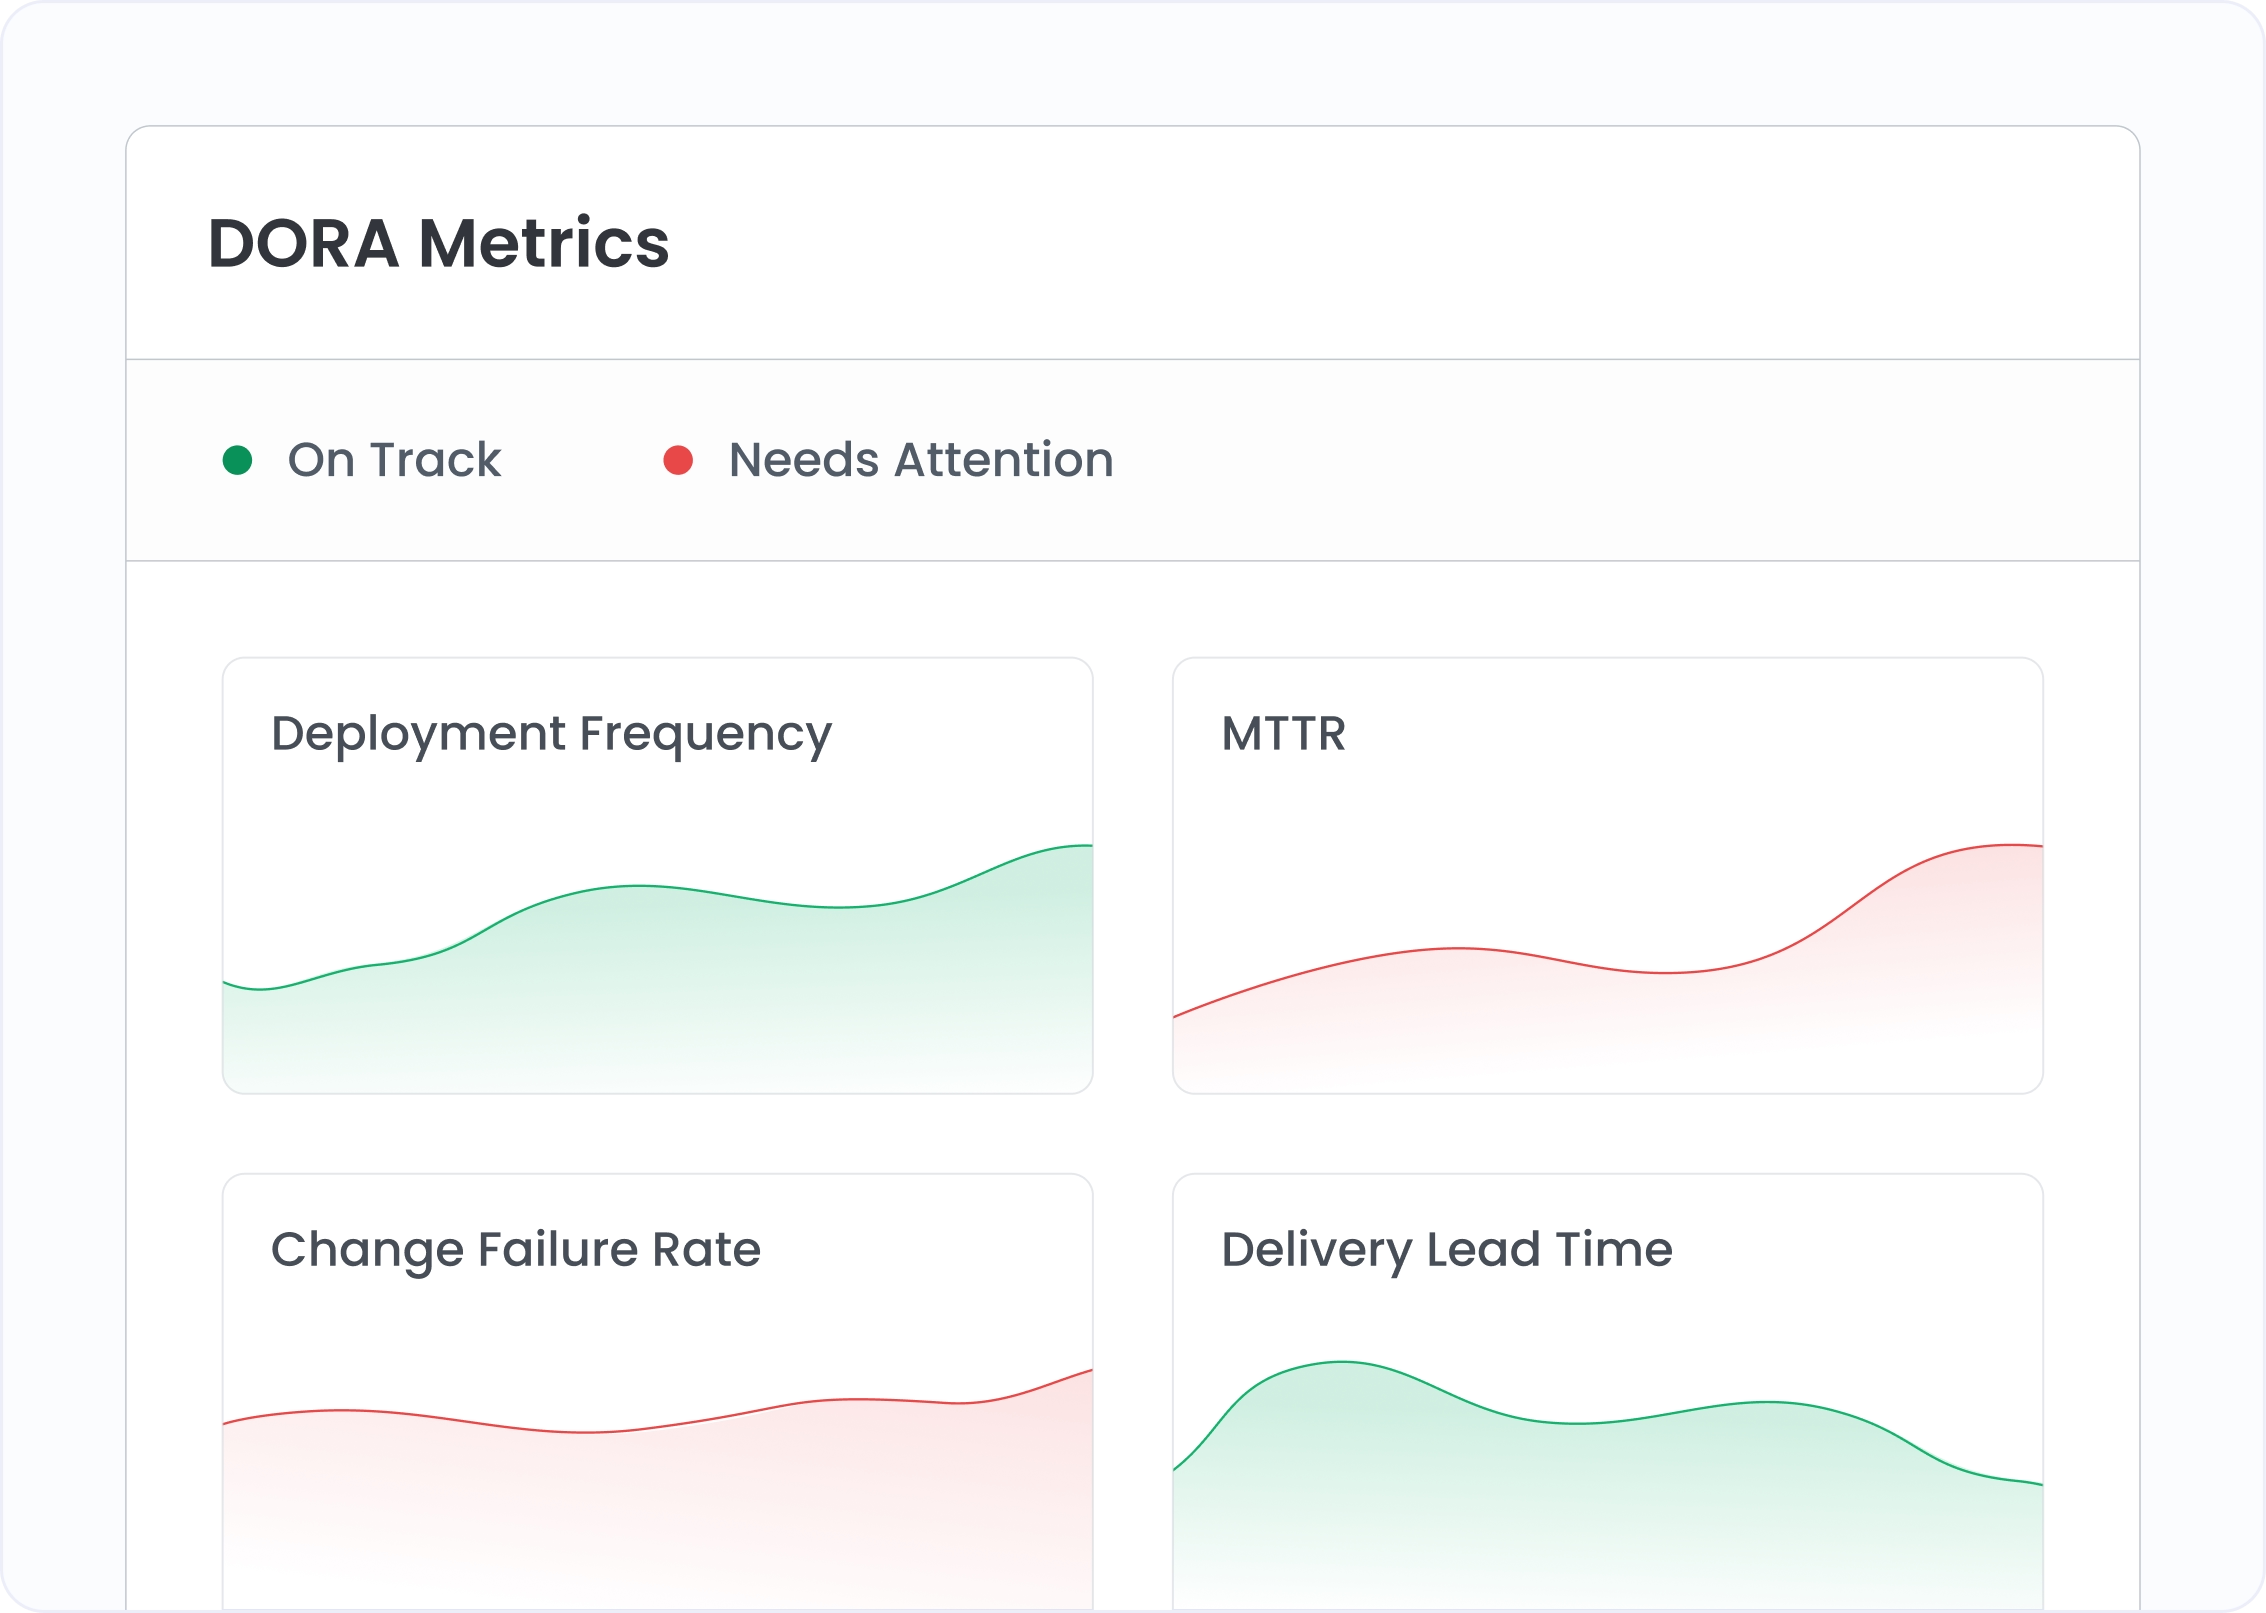
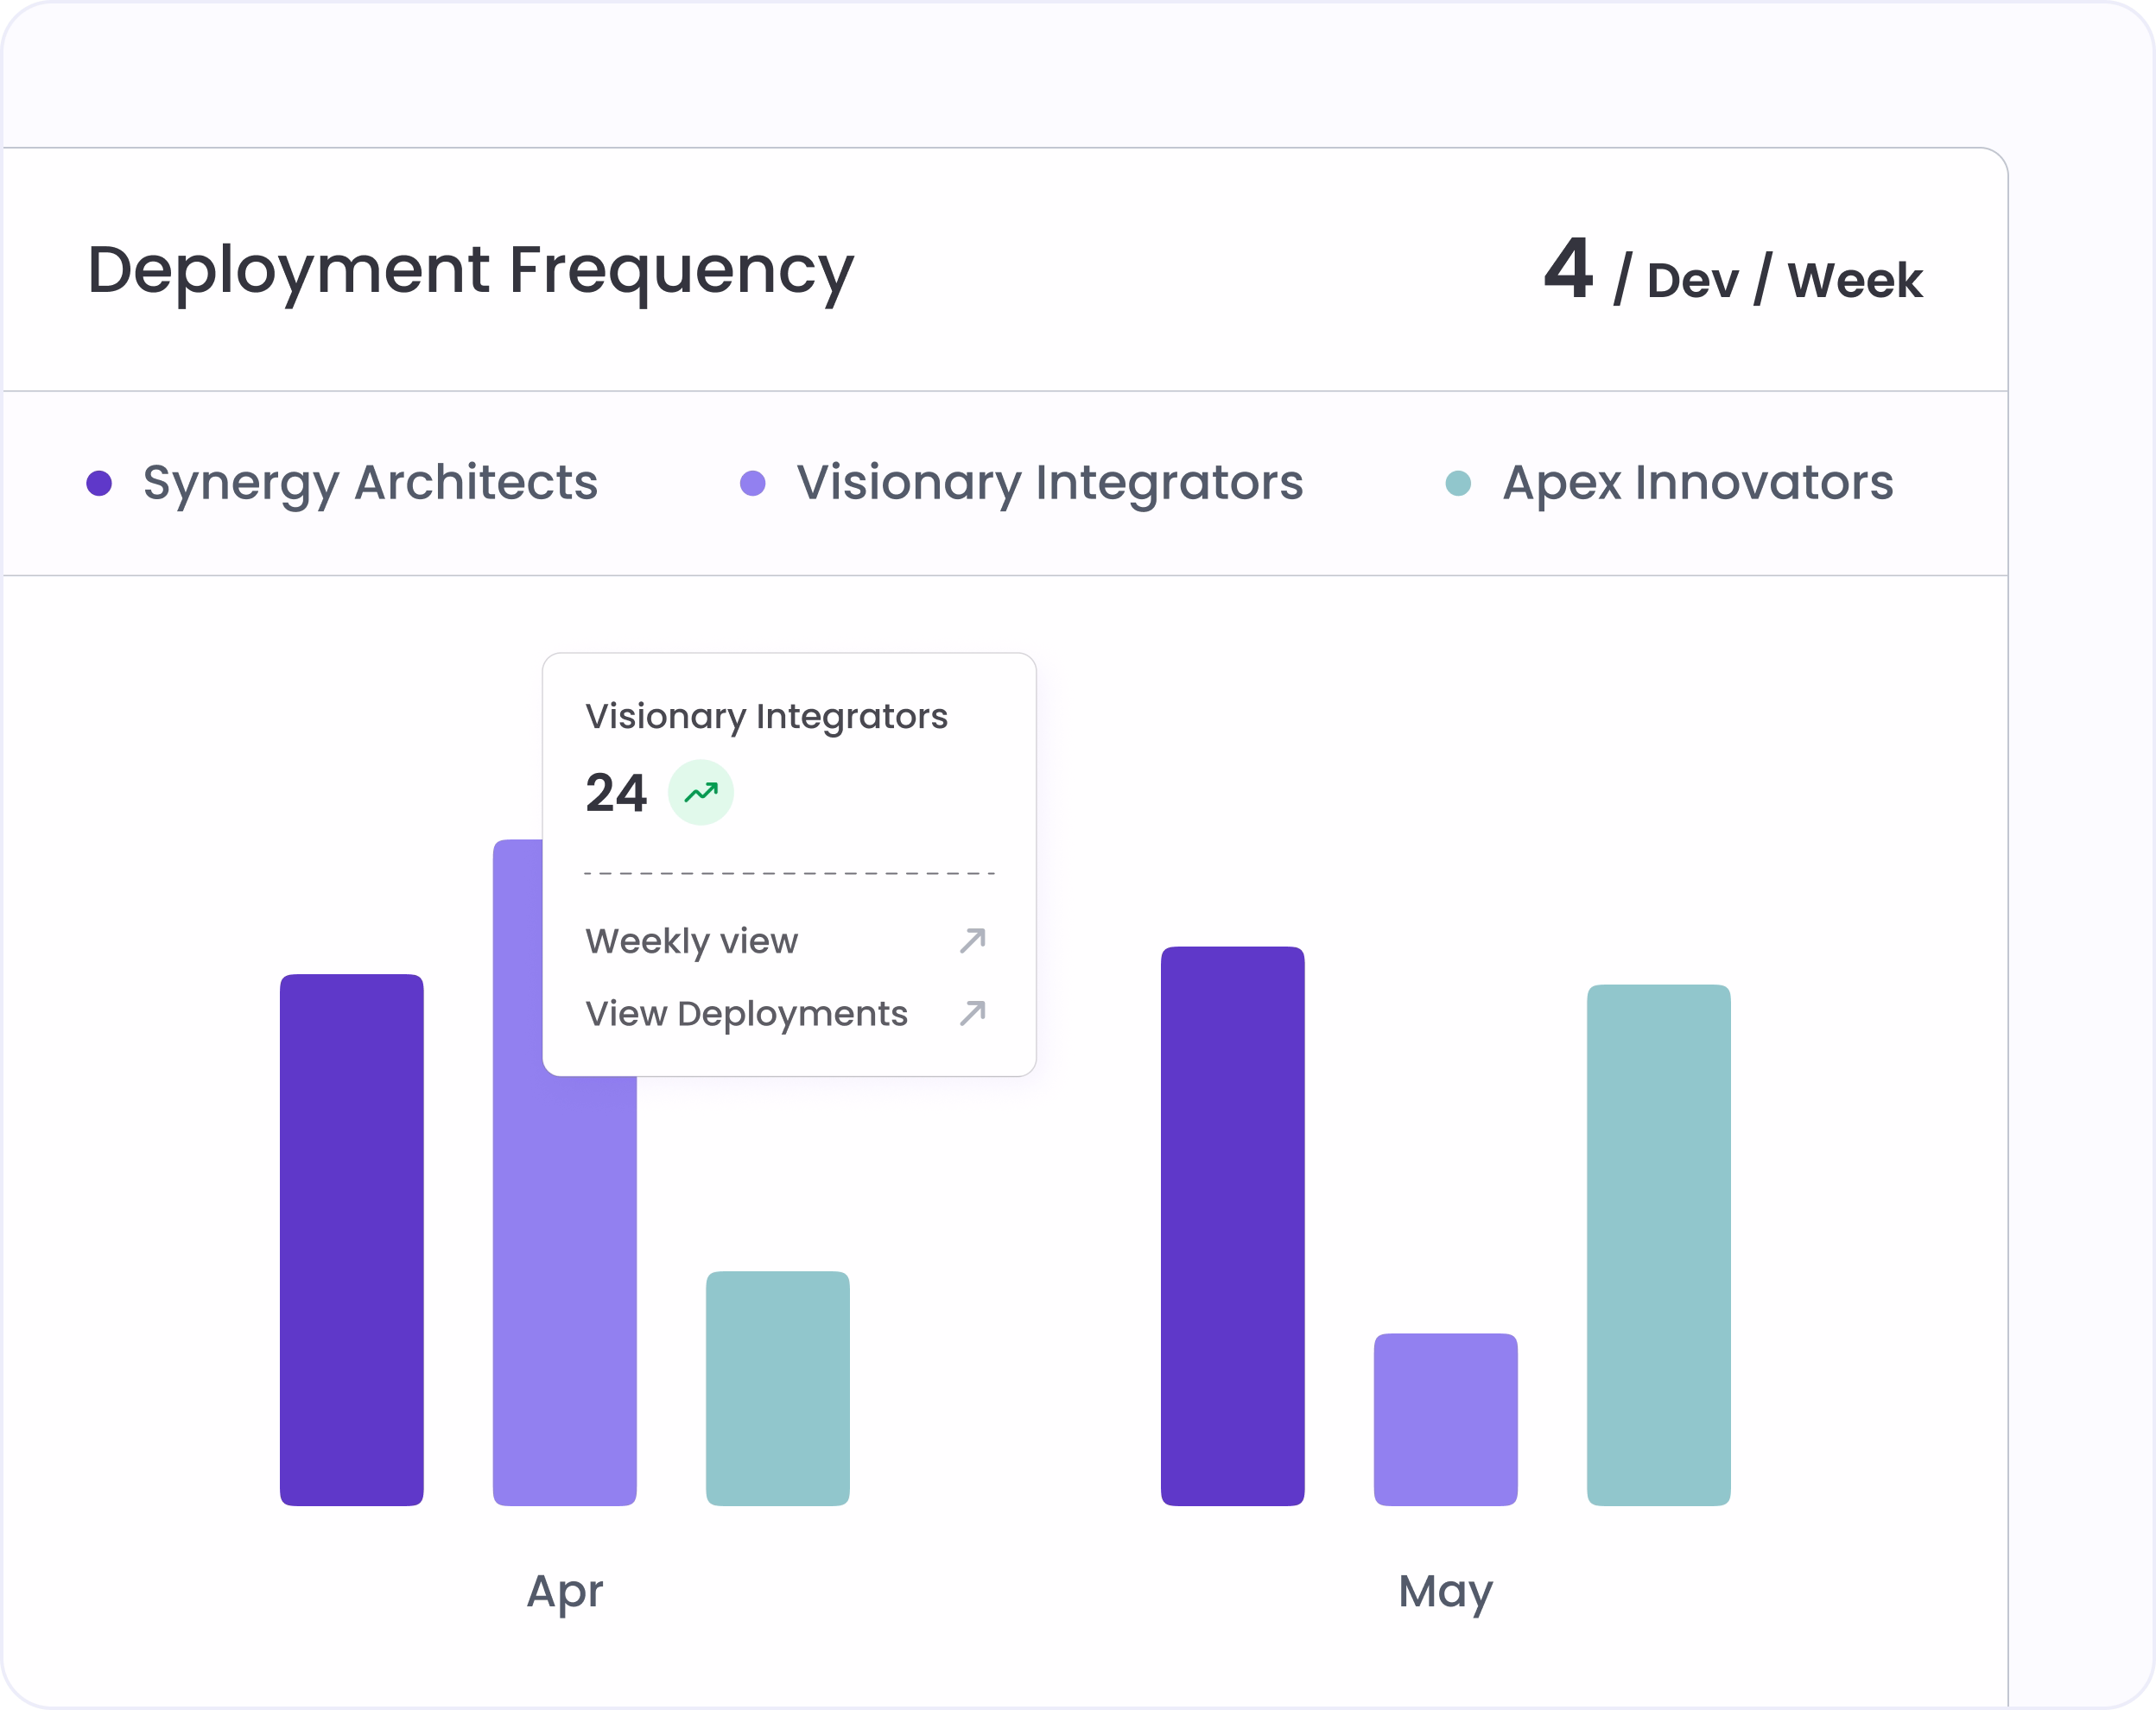
High deployment frequency is only good news if change failure rate isn't climbing with it. Hivel shows both in one view so you catch the pattern before fast-and-breaking becomes normal.
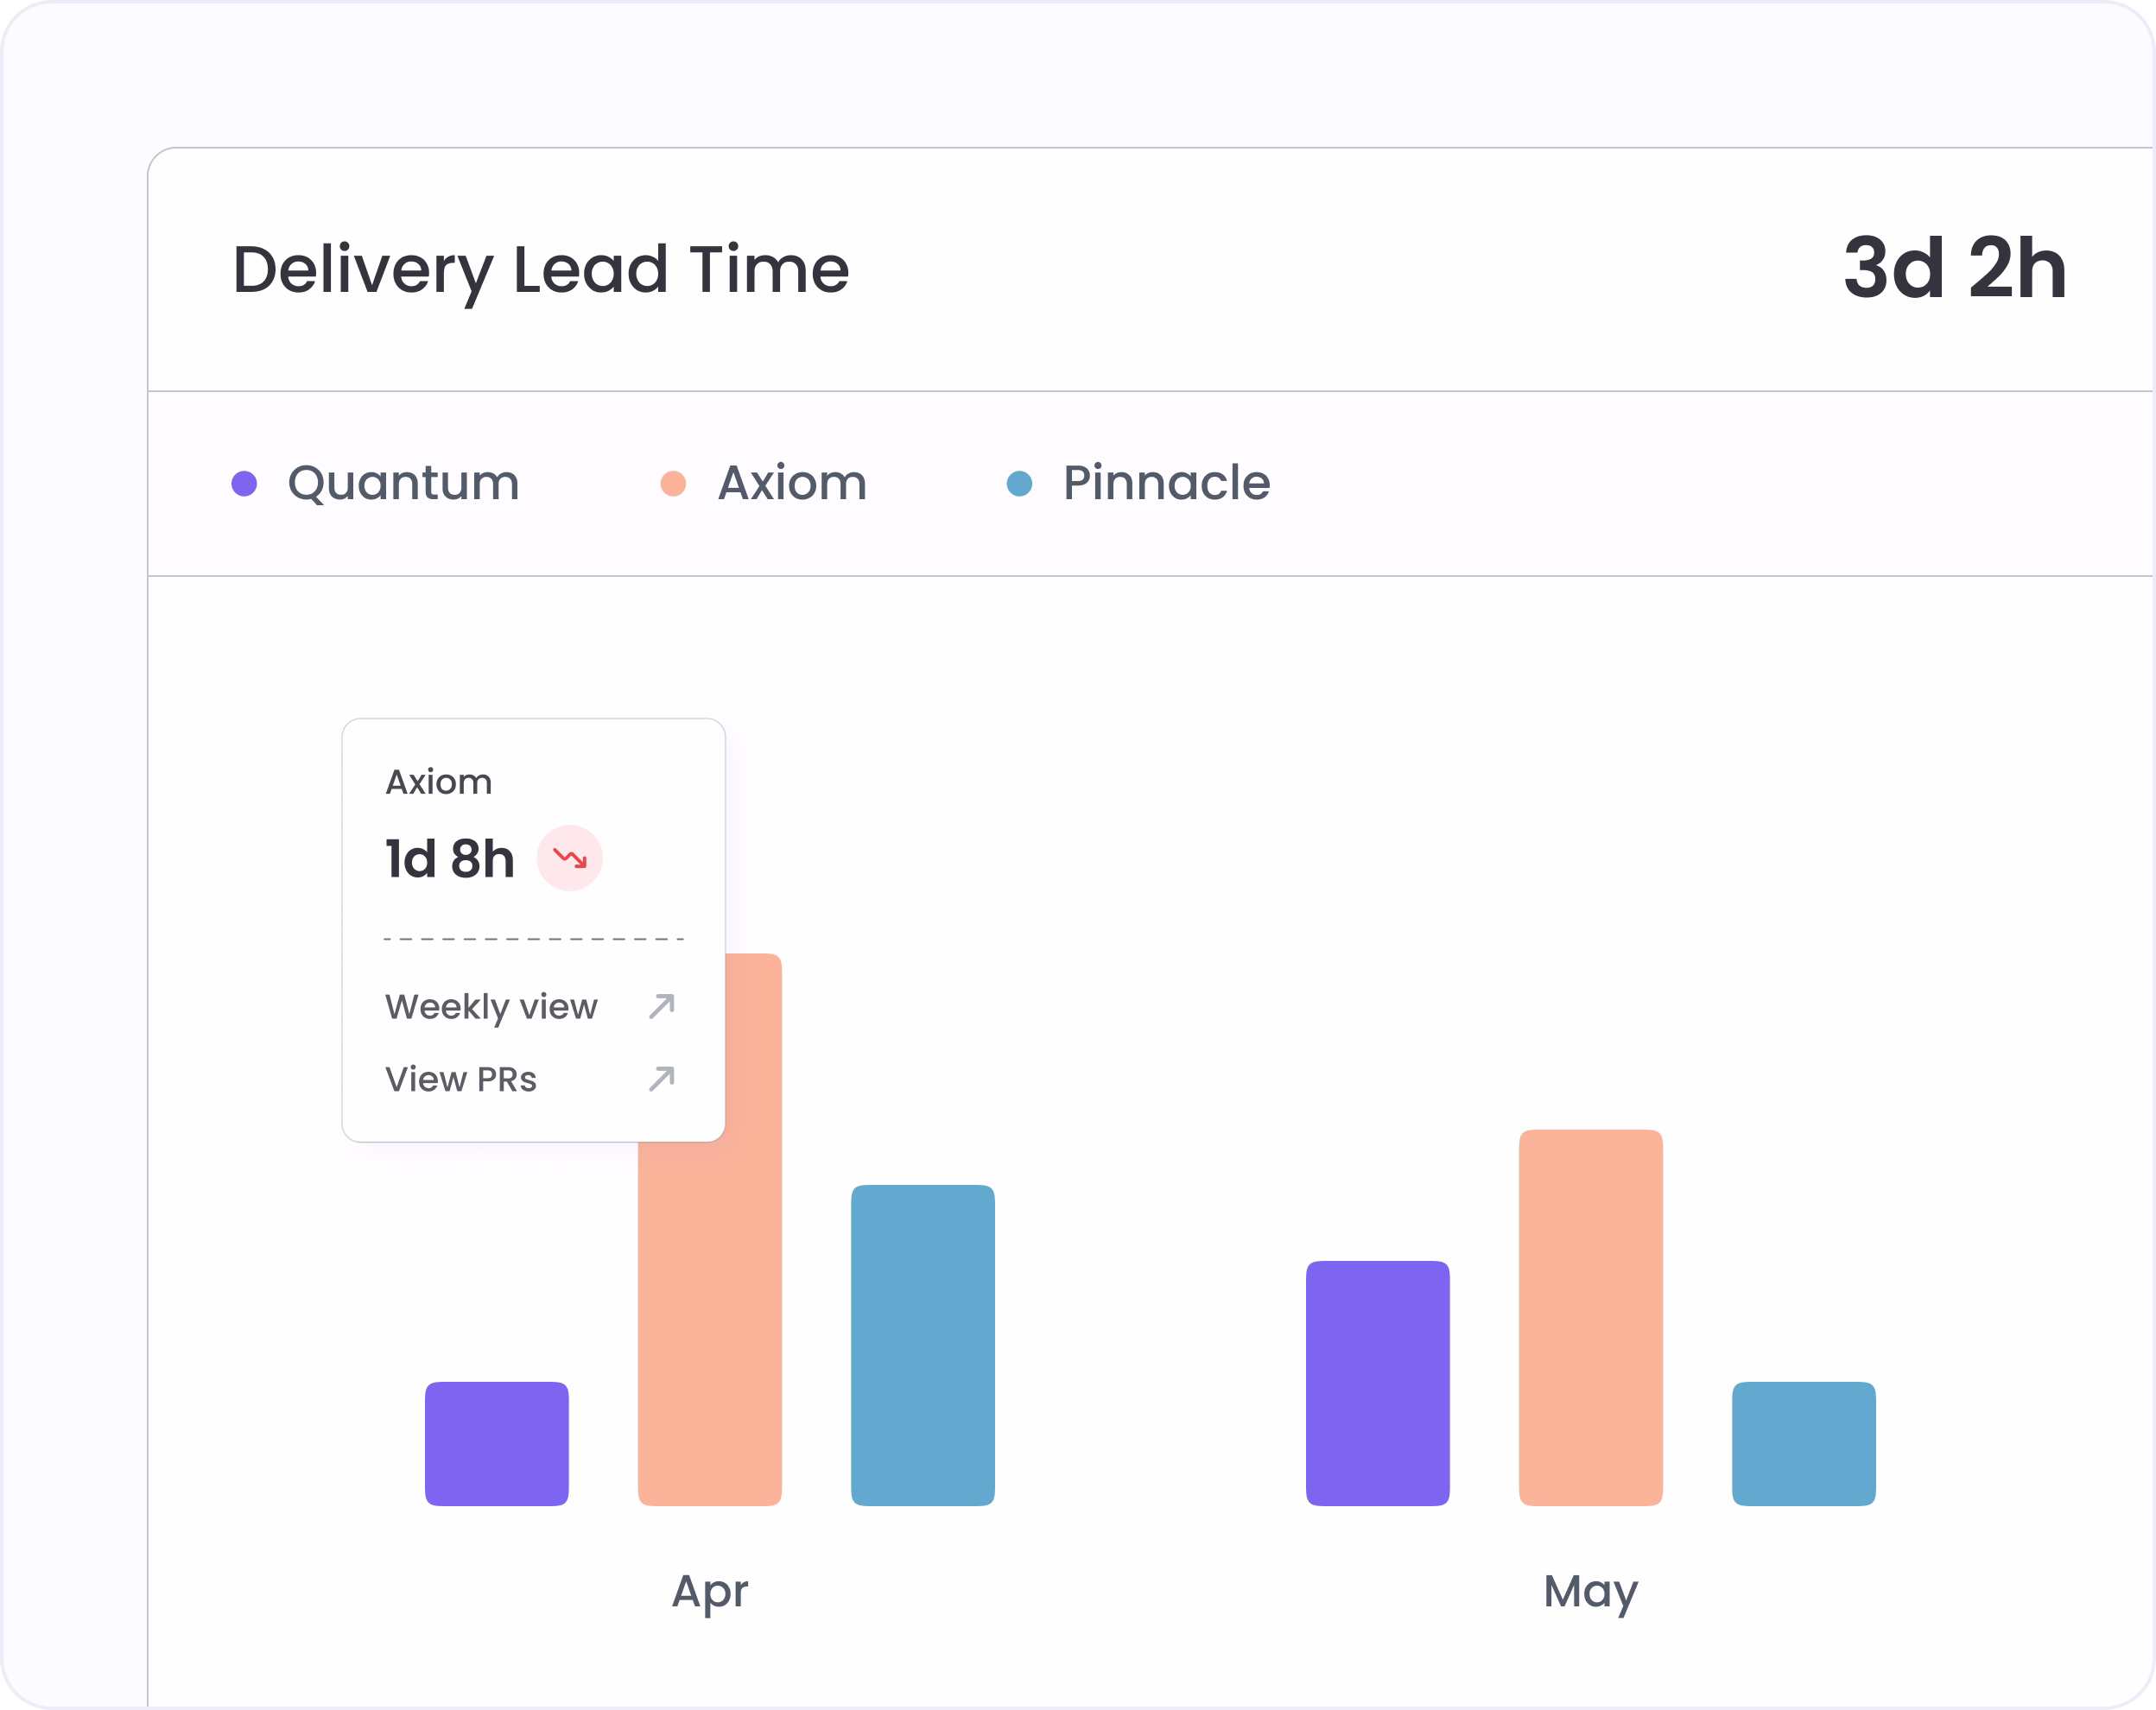
Lead time exposes what engineers feel but leadership rarely measures. Long lead times point to review queues, staging bottlenecks, or manual deployment steps that erode the speed AI tools were meant to deliver.
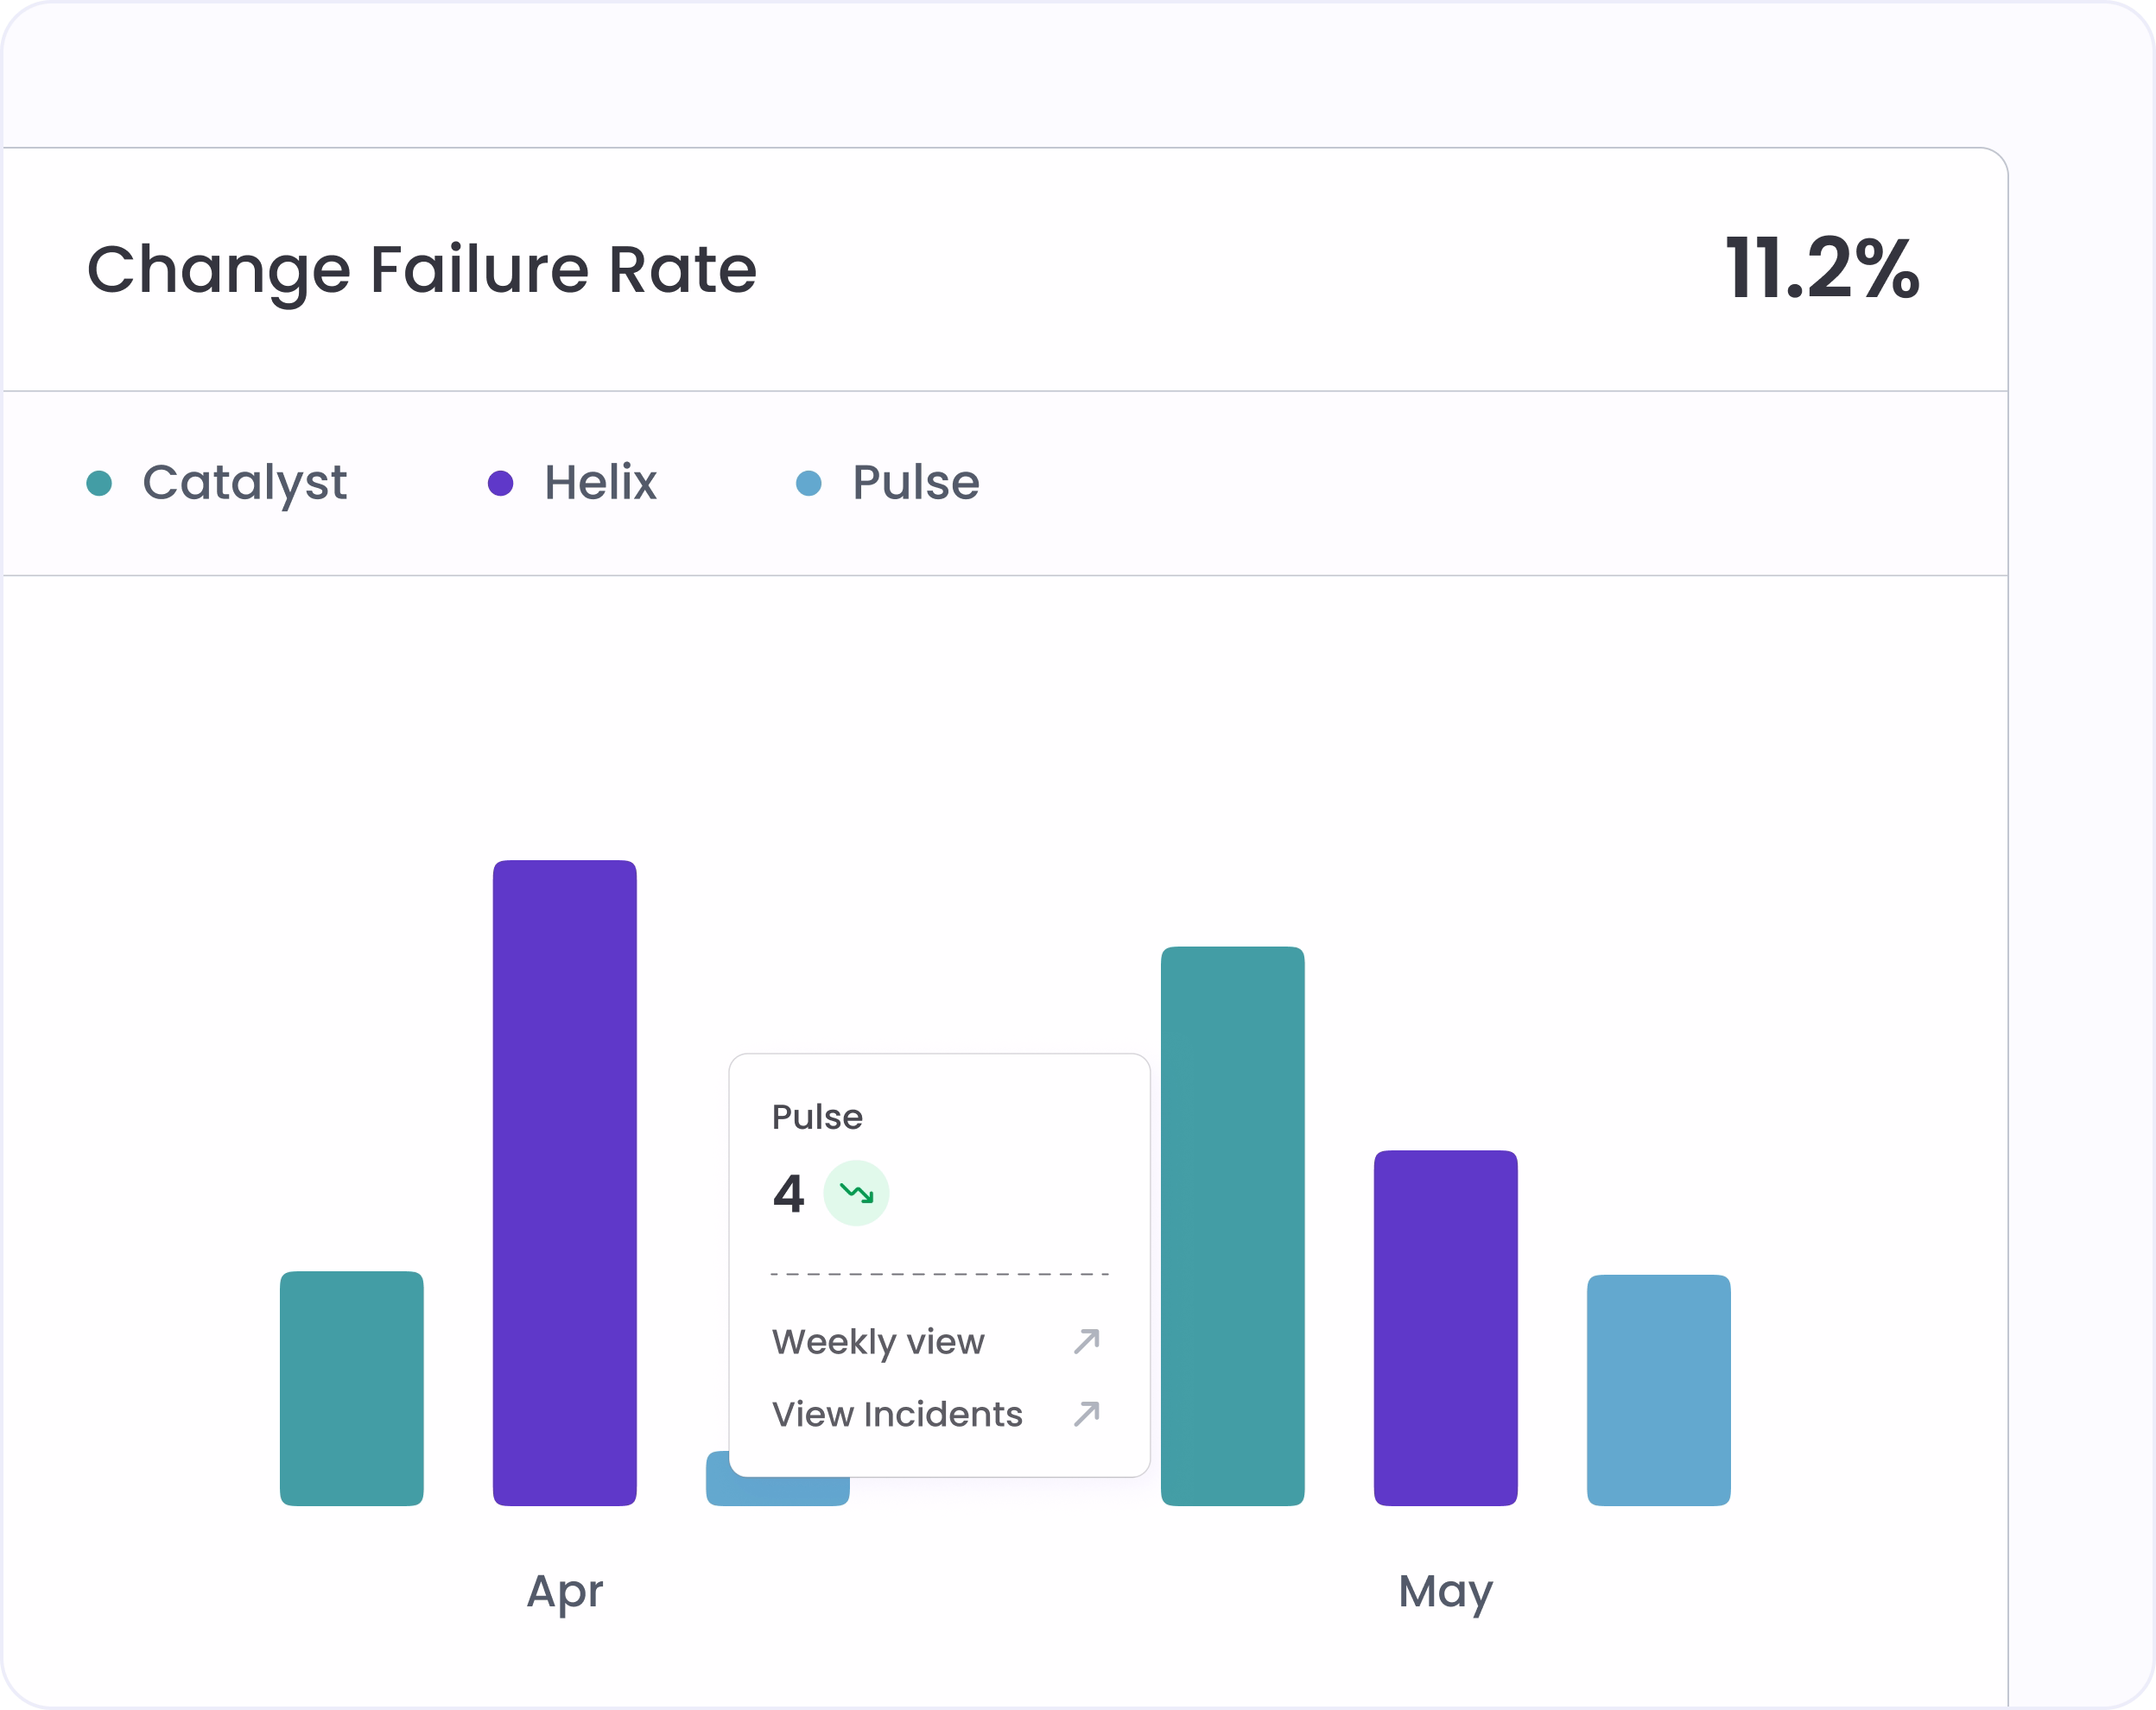
This metric tells you whether AI speed is producing faster features or just more production fires. Only incidents linked to commits or PRs count, so the number reflects code-caused failures, not every alert.
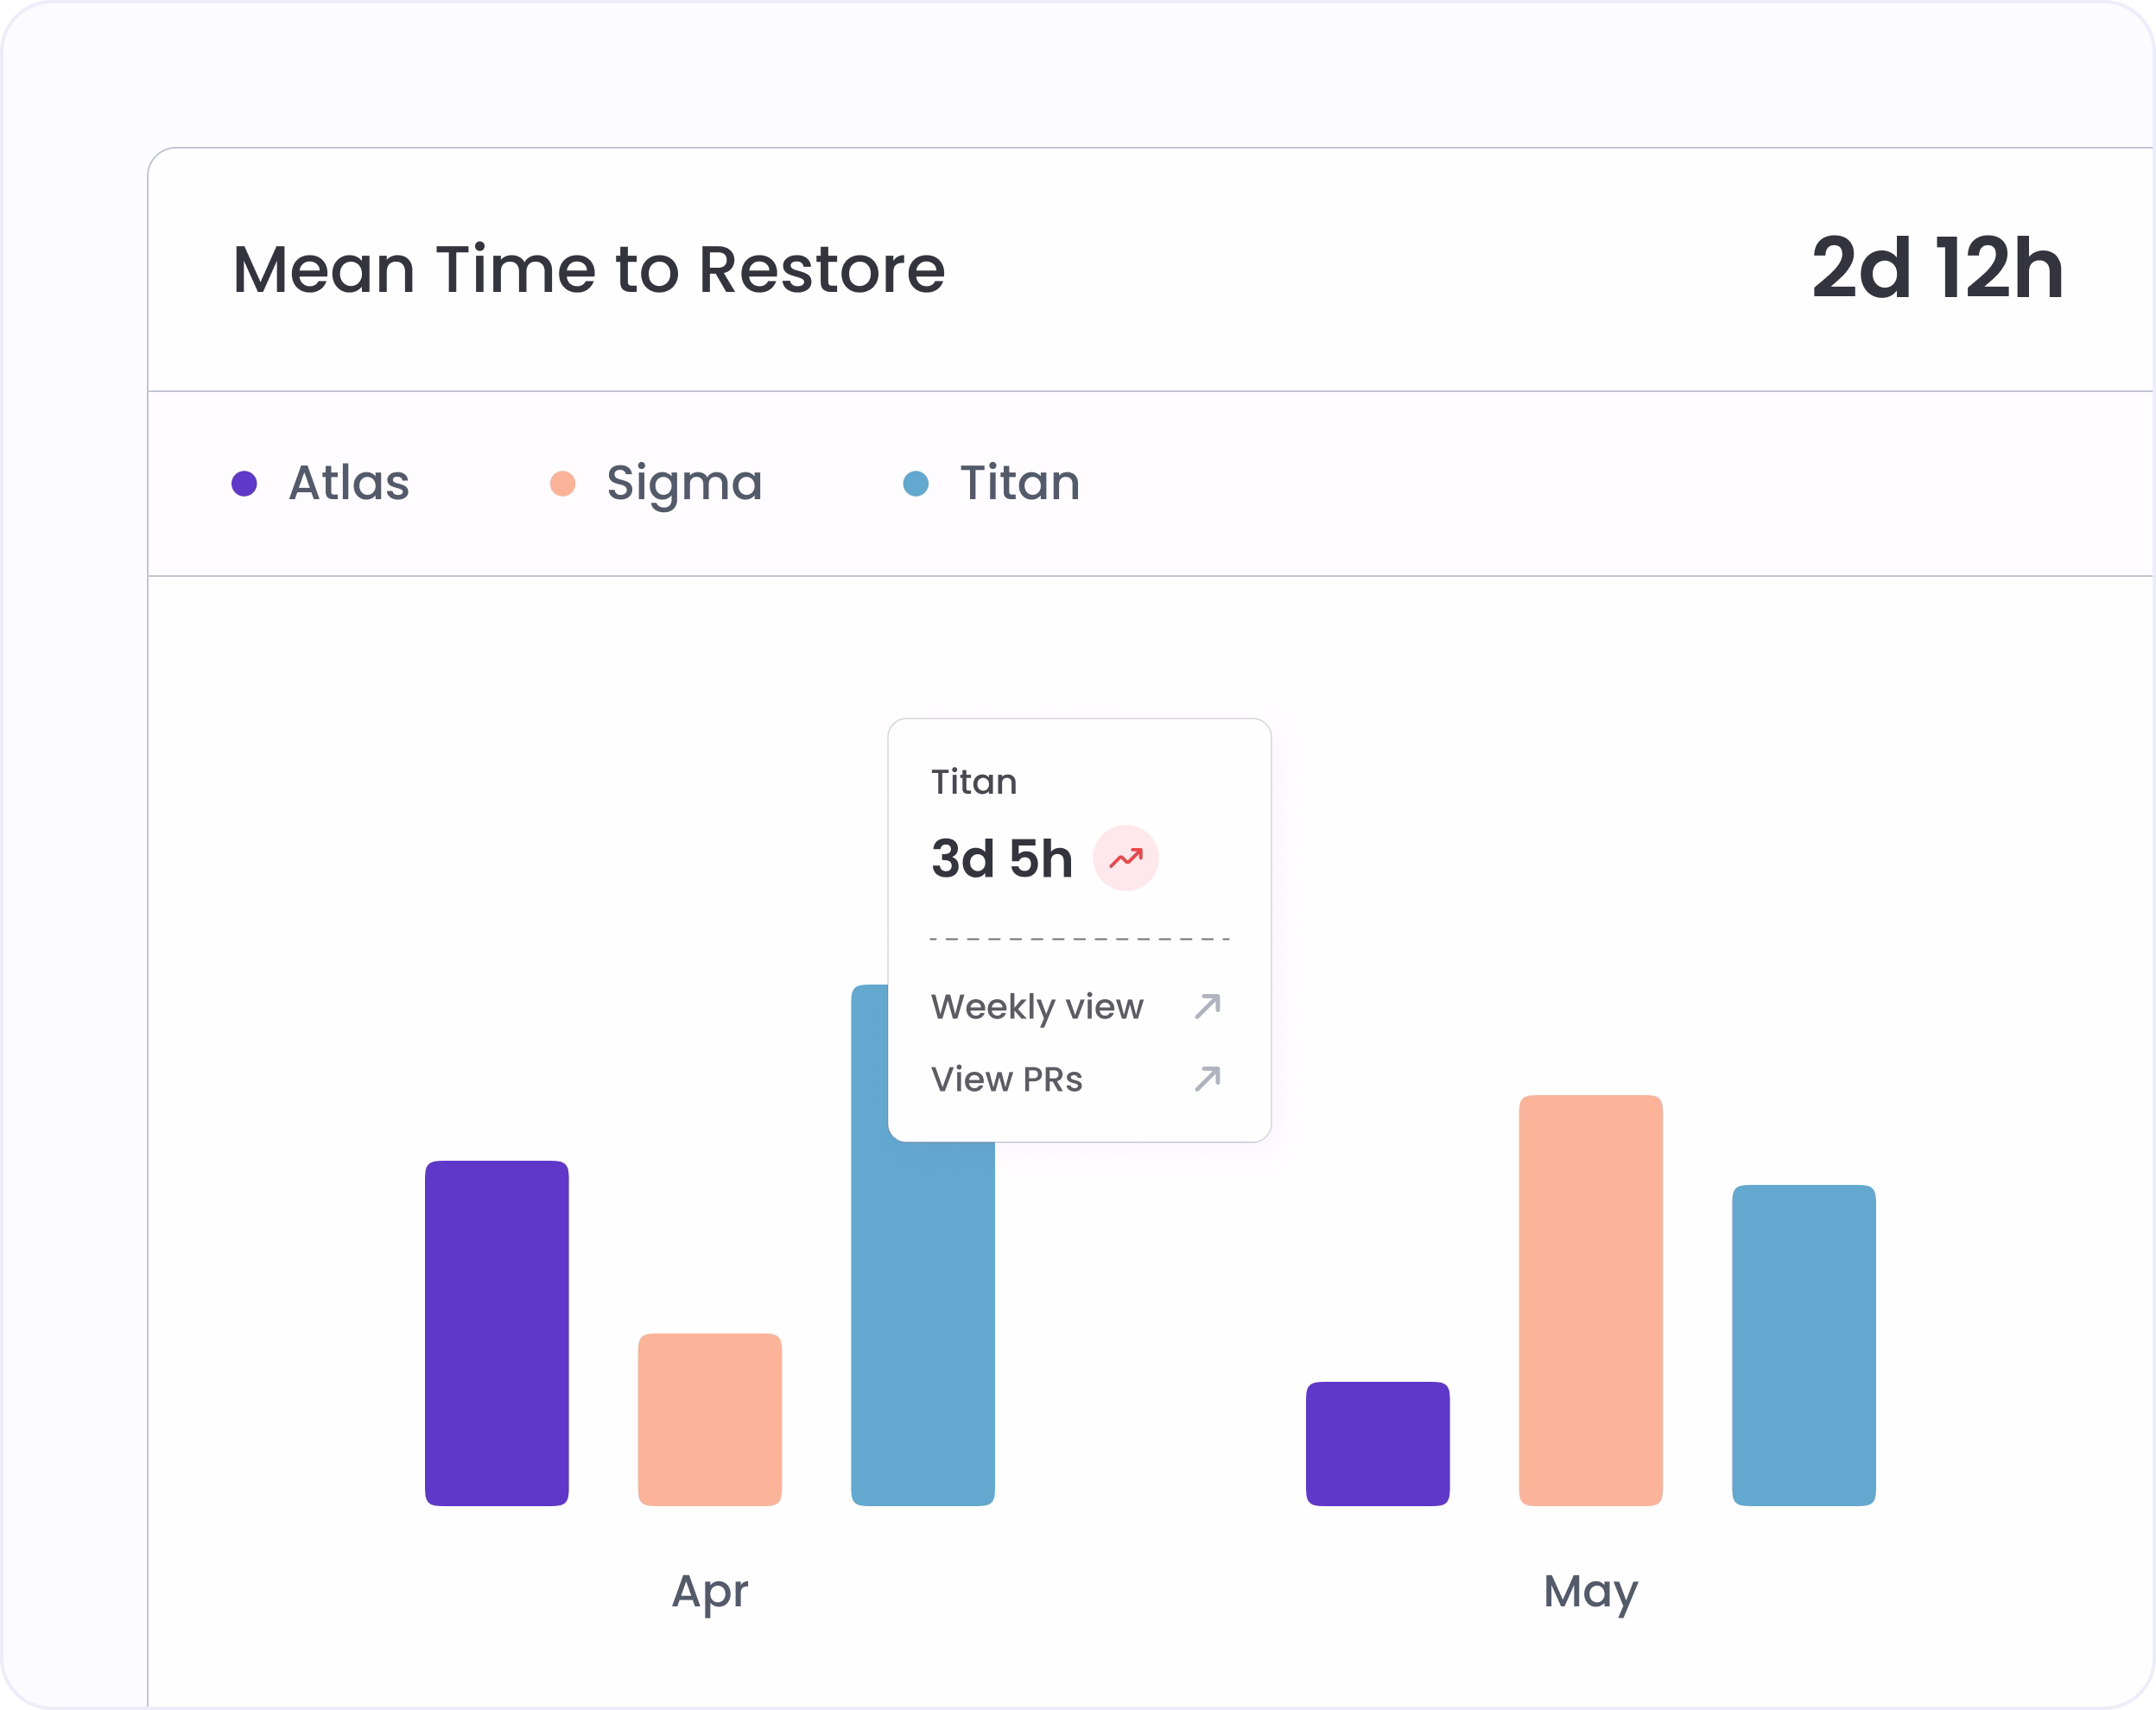
MTTR tells you whether response capacity is keeping pace with deployment volume. As deploy frequency grows, especially with AI in the loop, recovery time signals whether systems are getting more resilient or more fragile.
Hivel benchmarks each metric against DORA's Elite, High, Medium, and Low bands. You see where you stand against the standard.
Filter by team or repo to compare delivery health side by side. Identify Elite teams and laggards in one view.
Every metric carries a 90-day trend from day one. Spot whether AI tooling changes moved delivery health in the wrong direction.
Any anomalous metric drills to the deployments or incidents behind it. CFR spike? See exactly which PRs caused it.
Partially. Deployment Frequency and Delivery Lead Time are live as soon as your CI/CD tool is connected. Change Failure Rate and Mean Time to Restore require your incident management tool to be integrated too.
Incidents requiring code changes (hotfixes, rollbacks, outages) divided by total deployments in the period. Hivel only counts incidents linked to a commit or pull request, so the number reflects actual code-caused failures, not every ticket in your incident tracker.
Most CI/CD tools report deployment frequency and lead time but don't connect to incident data. Change Failure Rate and Mean Time to Restore are missing or manual. Hivel pulls all four from the right sources and shows them alongside your other engineering metrics.


.svg)
.png)