What happened?

Most engineering teams are equipped with dashboards full of numbers and charts, yet only a small portion of those signals are real software development KPIs.
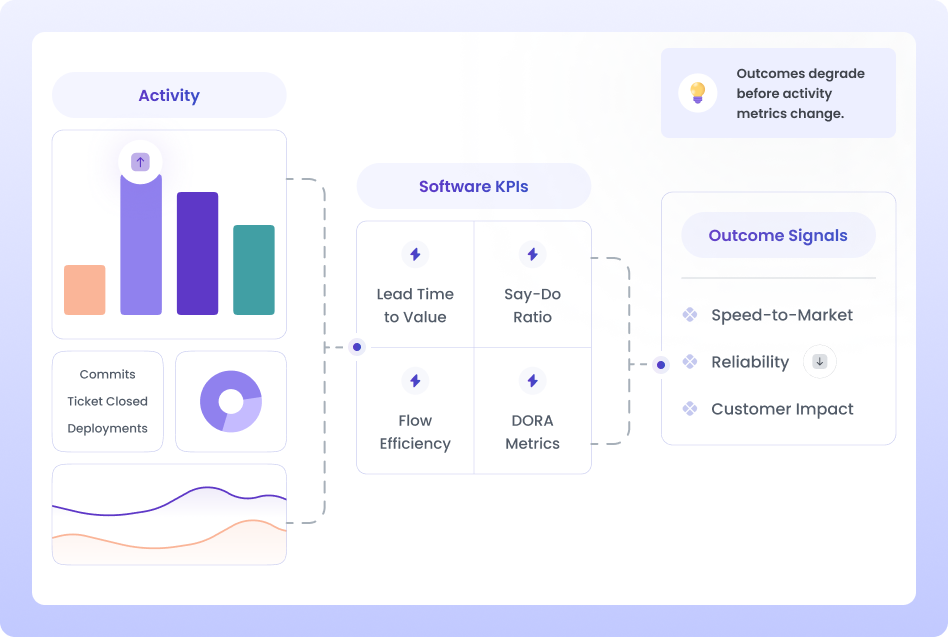
Software development KPIs are outcome-focused signals that explain how the engineering system behaves over time and how that behavior connects to business results like speed-to-market, reliability, and customer impact.
When leaders ask simple questions like:
Traditional dashboards go quiet.
This gap exists because most teams don’t lack data. They lack decision-grade indicators.
Software development KPIs exist to fill that gap.
This guide is designed to help engineering leaders move from reporting metrics to using KPIs as decision tools. If your dashboards look healthy but delivery still feels fragile, slow, or unpredictable, this guide will help you understand why.
Software teams measure a lot. But very few of what they measure deserved to be called KPIs.
Software development KPIs are outcome-focused indicators that show how your engineering system performs as a whole. They tell you whether delivery, quality, stability, and reliability are improving over time.
Activity metrics like LOC are just noise. What leaders really need are signals that capture business value.
A simple way to separate these two is -
Metrics talk about motion, and KPIs describe direction. For example, commits per week is a metric. And lead time reducing over three months is a KPI.
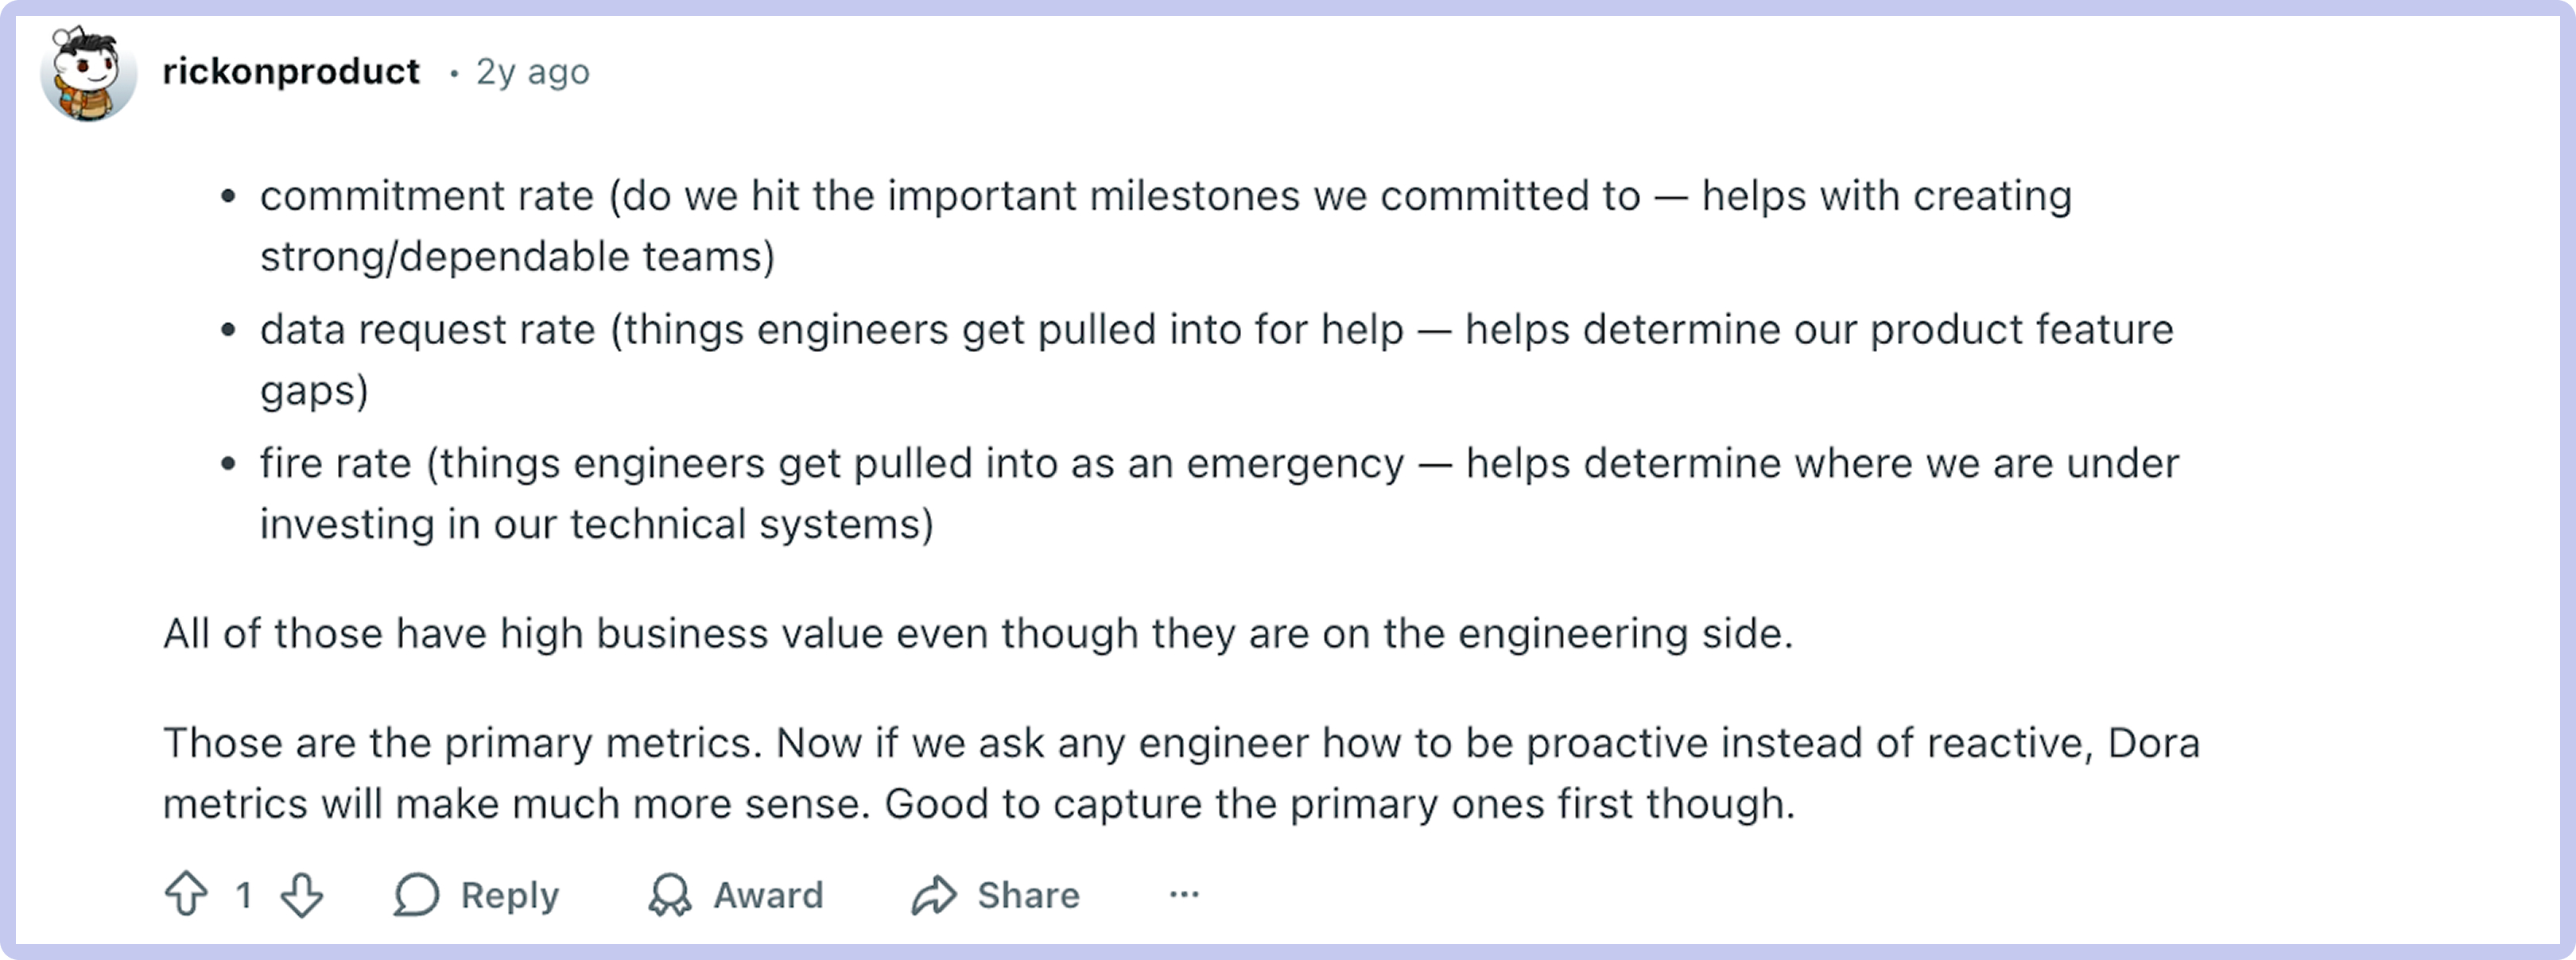
Another interesting way to comprehend KPIs and metrics is - All KPIs are metrics. But not all metrics are KPIs. (One of the examples is this Reddit thread where developers discussed how most productivity KPIs get gamed or create busywork, and metrics like task counts or PRs rarely reflect real progress.)
KPIs are widely misunderstood. They are not tracking numbers. They provide data-backed evidence that helps leaders make informed decisions.

When the team grows, intuition becomes unreliable, not because leaders are disconnected, but because the system itself becomes harder to observe.
KPIs replace guesswork, not judgment.
They help leaders answer questions like:
AI-assisted development has fundamentally changed software delivery.
But speed without visibility creates instability.
That’s why modern engineering teams need KPIs that reveal flow, risk, and outcomes, not just activity.
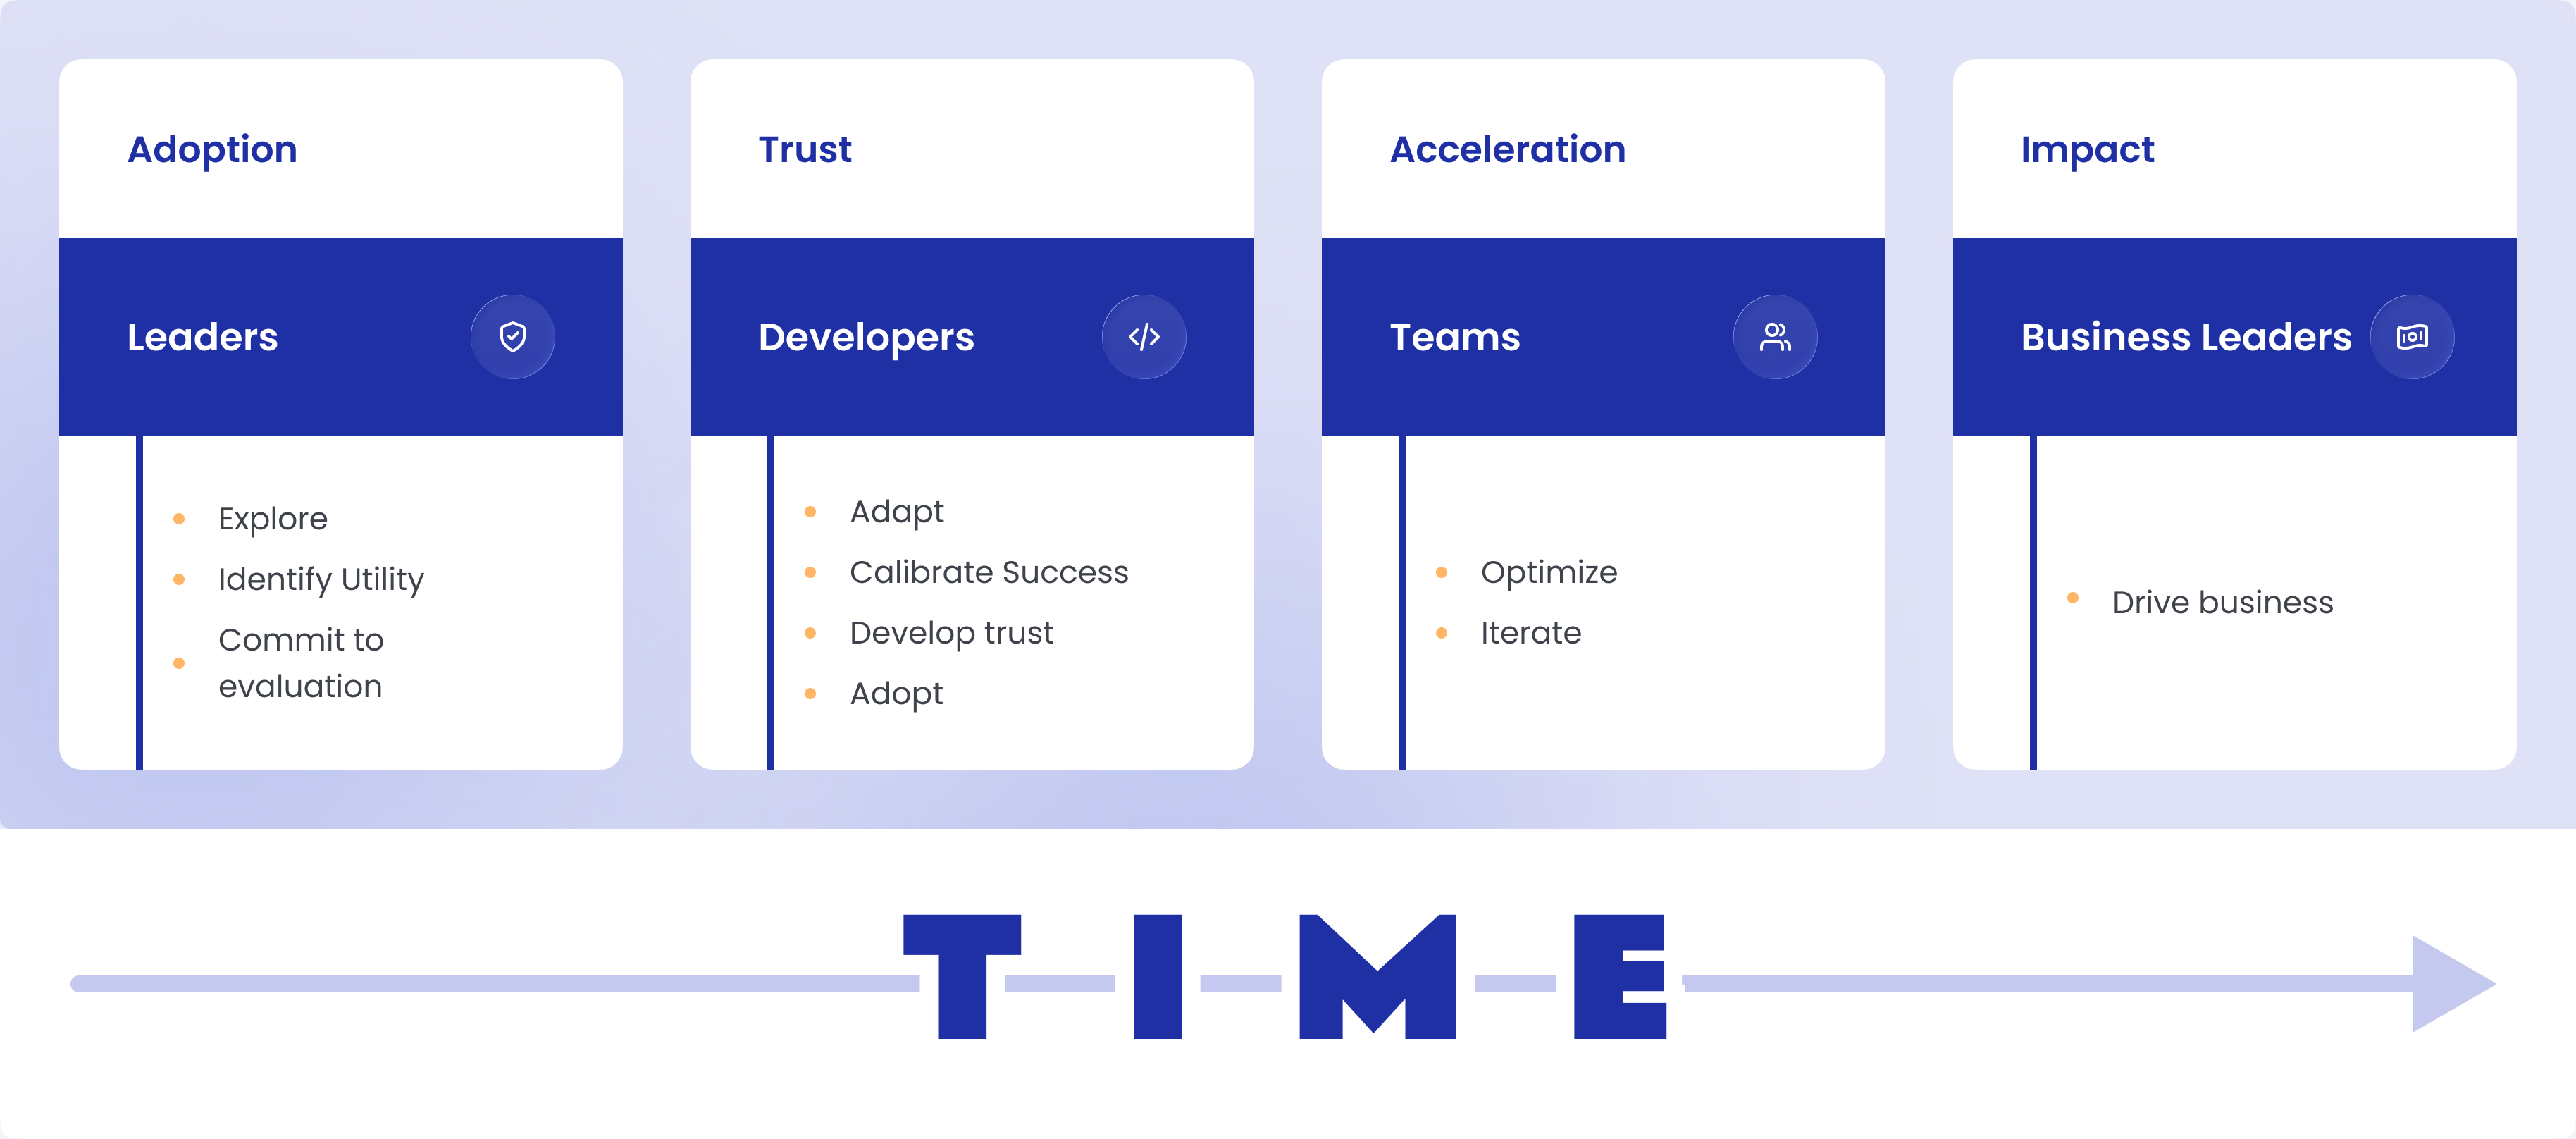
The following is a 4-step framework to adopt an AI code assistant, presented by Nathen Harvey, DORA Lead, in his resource.
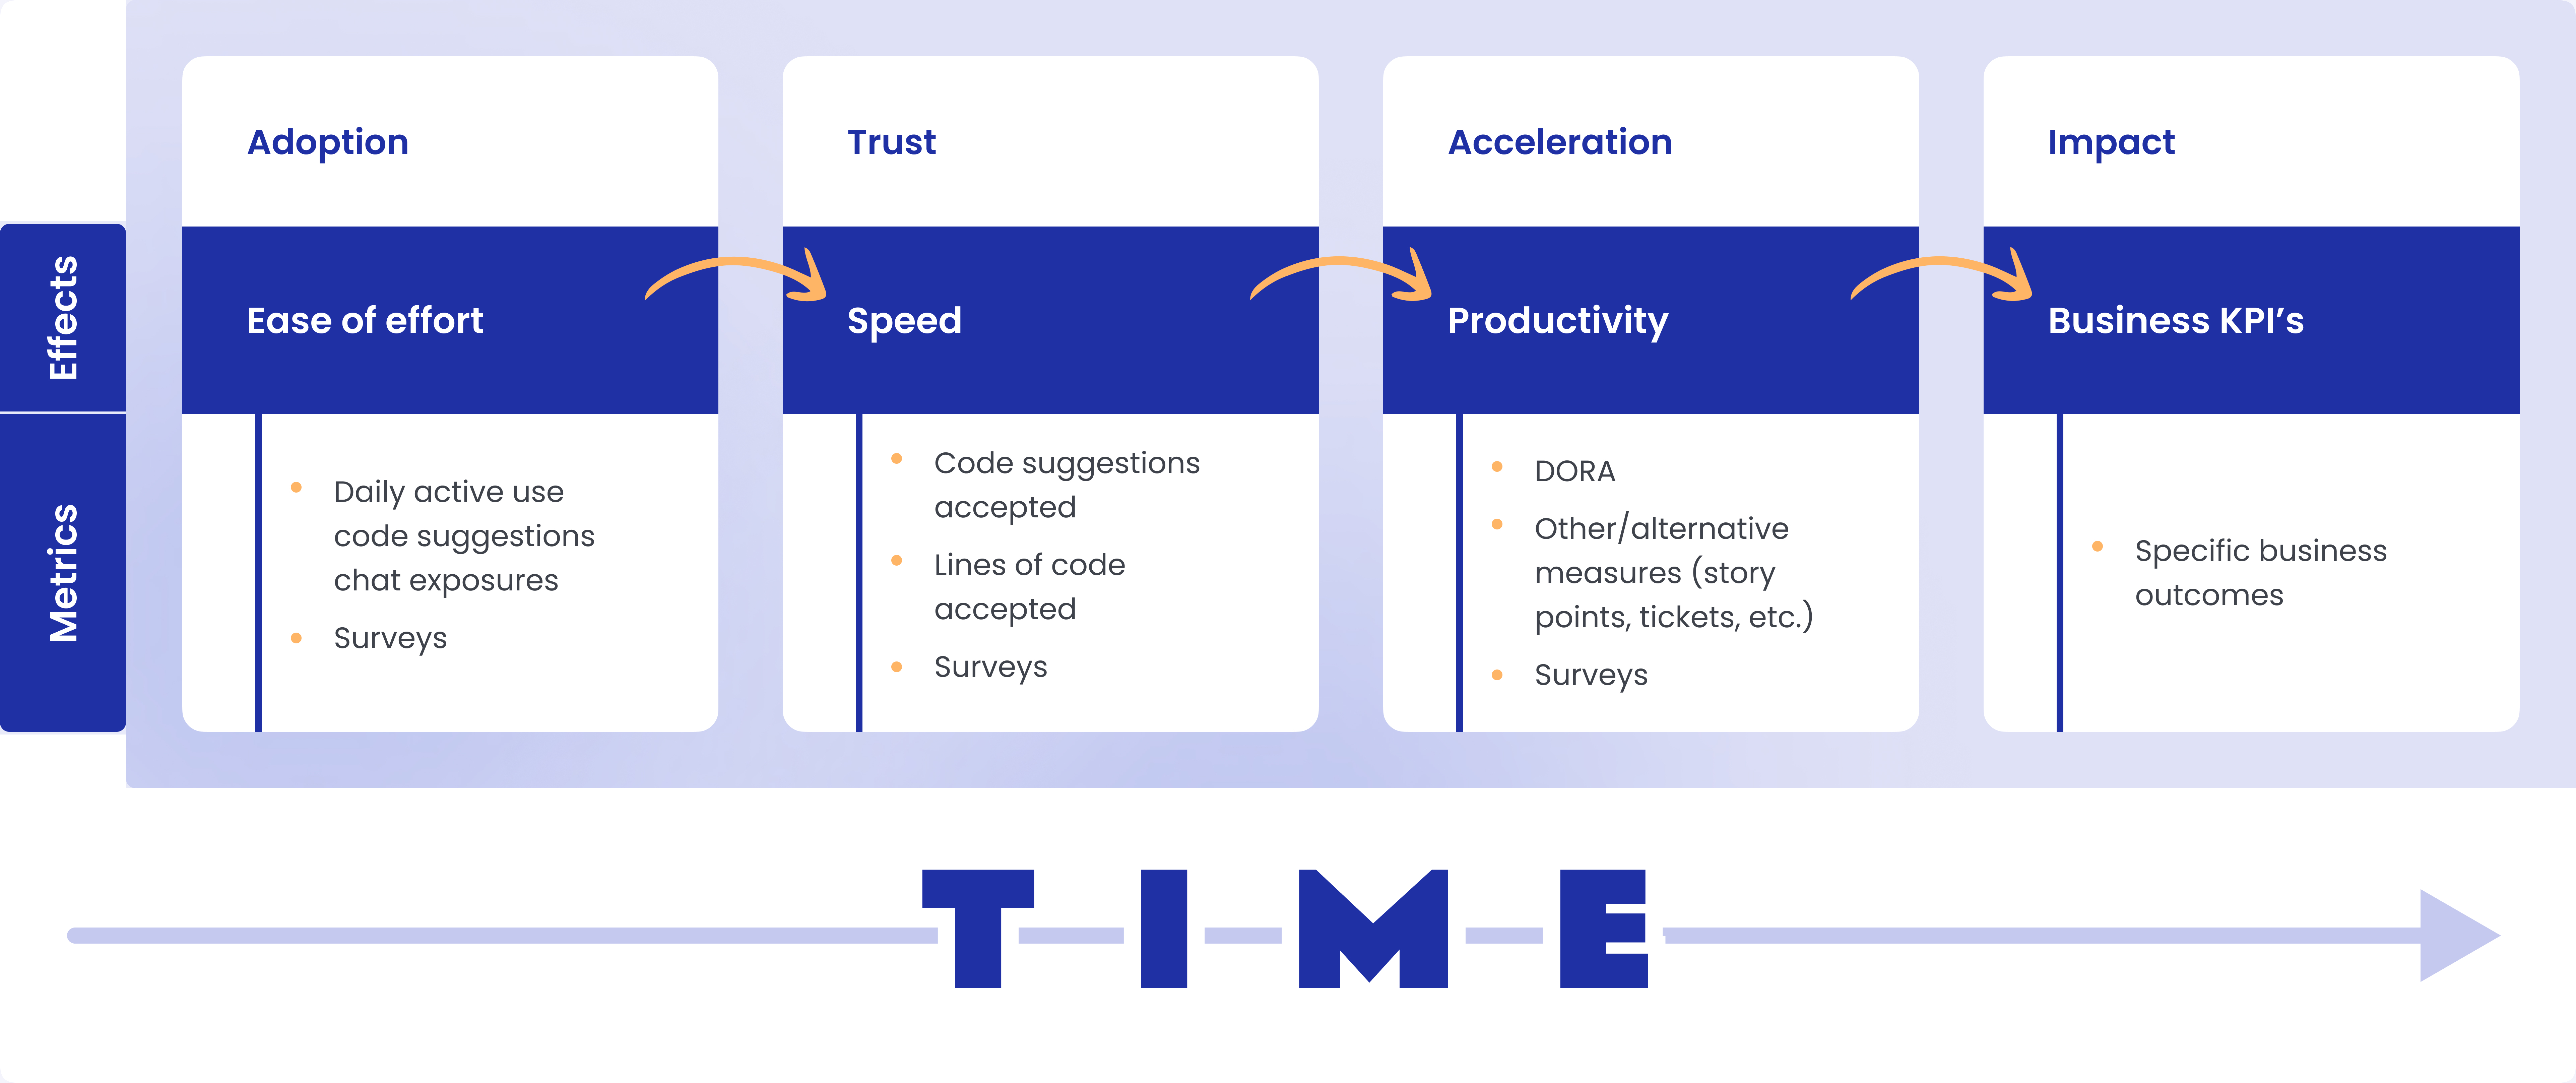
Here, he clearly depicts that new tool adoption is beyond the single-step journey of measuring the percentage of developers using it.
In fact, he did not even mention that. What he mentioned - code suggestions accepted, lines of code accepted, measured productivity increase, and its associated business outcomes.
Though not applicable in all cases, when the team is small, leaders don’t need dashboards. They feel problems before they even show up on dashboards.
As organizations grow, that signal disappears, and intuition keeps going away from reality. Because on-ground engineering reality itself becomes more volatile.
What replaces it should not be more data, more descriptive dashboards, or more intense intuition, but better indicators.
And that’s where software engineering KPIs become those indicators.
In small teams…
But at scale…
That leads leaders to start asking (but never get true answers)…
Software engineering KPIs surface this system behaviour that humans can’t see and sense directly at scale. Here, KPIs support the decisions and judgment, rather than replacing them.
The irony is, more leadership dashboards consider all three as one. But that’s a mistake.
So, it’s needless to say that software development KPIs connect outcome to impact.
They help leaders get answers to…
The big red flag here is - without KPIs, output gets mistaken for progress!
Velocity and story points are meant to support local planning and not for executive decision-making.
They work perfectly when used only in certain scenarios, like…
So, in this context, both velocity and story points are just coordination tools and nothing more. At scale, velocity breaks down because teams start using it to…
The most dangerous effect of velocity and story points is that they create false confidence problems. Leaders often see velocity remaining steady, sprint commitments being met, and no notable red flags. But underneath…
Beyond velocity and storypoints, there are plenty of other ways leaders can get easily misguided with half-cooked data or vanity metrics. For example,
Most leaders see “what changed last week?” on their dashboard, but that dashboard rarely answers the key questions…
However, the silver lining is - good software performance indicators pair speed with stability, show trend over time (not weekly spikes), and make cost & risk visible alongside output.
Such context-rich dashboards with embedded software performance indicators answer strategic questions like…
The core identity of context-rich dashboards is - it reveals the trade-offs before they become failures!
Metric gaming in software engineering happens when a team starts pursuing numbers and not the outcome. In other words, instead of improving software quality and delivery, teams learn how to look good on dashboards. And this is inevitable when software development KPIs are missing from your engineering culture, mindset, and dashboards.
Common examples of metric gaming include…
The outcome of this kind of metric gaming is - you see each metric in green, but the business impact remains flat and can at any time take a nosedive.
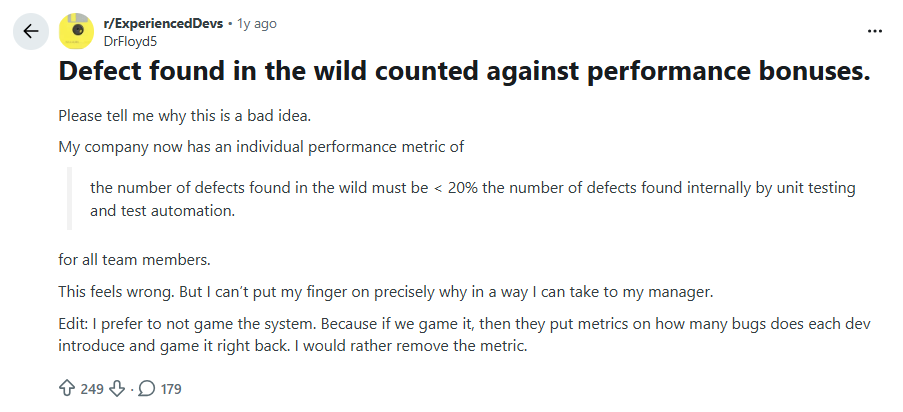
One thing worth discussing here is - metrics don’t fail. It's an incentive tied to those metrics that fail.

Goodhart's Law states, "When a measure becomes a target, it ceases to be a good measure."
And this is pretty much evident in software development. In one of the Reddit threads, they discussed how iIncentives tied to metrics cause metric gaming! Developers argued that when bonuses depend on defect metrics, teams start hiding or gaming bugs just to protect their numbers.
The question is, how can an engineering team defeat Goodhart's Law? Well, during the Tech Leads Summit at Booking.com, the 2 simple steps were presented.
Before picking KPIs, teams need a mental model. That helps different team members (by their role) to look at the same KPI dashboard from different angles.
That’s the mental model behind KPI categories.
Activity metrics can be gamed. Outcome metrics cannot.
If you build a system around activity metrics, people will naturally optimize for activity. They’ll increase commits, split pull requests into smaller chunks, inflate story points, stretch hours in the office, or simply stay visibly “busy.” And on paper, everything will look impressive. Dashboards will glow green. Productivity will appear high. But revenue won’t necessarily move. Customer satisfaction won’t automatically improve. Market position won’t strengthen just because PR volume increased.
That’s the trap.
Activity metrics measure motion. And motion feels productive. But motion is not impact.
When leaders anchor KPIs around activity, they unknowingly reward busyness. And busyness scales complexity without necessarily scaling value.
Now contrast that with outcome metrics.
The question you should be asking is which is much harder to game and which creates some value for your business:
“What changed because of the work we did?” and will help you how you can answer for those questions.
What it measures: The ratio of the total completed work items to the total planned work items within a single cycle or sprint.
Why it matters: It is the ultimate indicator of delivery reliability. For leaders, a consistent Say-Do Ratio means the engineering team is predictable, allowing the business to plan product launches and marketing campaigns with confidence. It helps identify exactly where commitments fall short and whether "unplanned work" is hijacking your roadmap.
When it breaks down:
Common misuse:
What it measures: The percentage of engineering hours/effort spent across different categories: New Features, Technical Debt, Maintenance/Support, and Infrastructure.
Why it matters: This is the #1 KPI for VPs to align engineering with the CEO's goals. If the business wants "Innovation" but 70% of effort is trapped in "Maintenance," you have a roadmap-killing bottleneck.
When it breaks down: When Jira labels are inaccurate or "Tech Debt" is hidden inside "Feature" tickets.
Common misuse:
Trying to reach 0% Maintenance. A healthy system always requires a "tax" of maintenance (usually 20–30%).
What it measures: The total time from when a feature is defined/requested (not just committed) to when it is live for users.
Why it matters: DORA's "Lead Time for Changes" only measures the technical pipeline (Commit → Prod). This KPI measures the business pipeline. It reveals if your "Slow" delivery is actually a product-spec or design bottleneck rather than a coding one.
When it breaks down: When "Idea" start dates are poorly defined.
What it measures: The ratio of "Active Work Time" to "Total Lead Time." (Active Time / Total Time).
Why it matters: In most orgs, work spends 80% of its time waiting (waiting for review, waiting for requirements, waiting for a build). Flow Efficiency identifies systemic waste.
When it breaks down: If developers don't track "Idle" status correctly in Jira/Linear.
What it measures:
Total revenue generated divided by total engineering headcount.
Why it matters:
For founders and CEOs, this becomes a capital-efficiency signal. It answers:
Is engineering output translating into monetizable value?
Are we scaling revenue faster than we are scaling headcount?
A rising Revenue per Developer suggests the system is compounding, better architecture, stronger product-market fit, improved execution.
A flat or declining ratio signals dilution - more hiring without proportional business lift.
Important nuance: This is not an individual productivity metric. It is a system-level leverage metric. It reflects product clarity, execution quality, go-to-market alignment, and architectural decisions, not how “hard” developers are working.
As organizations grow, delivery slows not because developers are slower — but because coordination increases.
What it measures:
The average number of cross-team dependencies per initiative.
Why it matters:
Every dependency adds waiting time, context switching, and communication overhead.
Even when collaboration is healthy, excessive handoffs reduce flow efficiency.
Leaders often try to solve slow delivery by hiring more engineers.
But if dependency load remains high, throughput doesn’t increase, complexity does.
Reducing dependency load often improves speed more than adding headcount.
What it measures:
How many times work changes ownership across roles before reaching production (e.g., PM → Design → FE → BE → QA → Ops).
Why it matters:
Each handoff introduces:
Organizations that combine or tightly integrate roles (e.g., full-stack ownership, embedded design, product-engineering pods) often see measurable reductions in lead time, without increasing effort.
Fewer handoffs = lower collaboration overhead = faster validated delivery.
What it measures:
Time spent coordinating (meetings, clarifications, approvals, reviews across teams) relative to active build time.
Why it matters:
In small teams, collaboration is lightweight and fast.
At scale, it becomes structural drag.
If collaboration overhead grows faster than team size, velocity plateaus — even if DORA metrics look stable.
This KPI surfaces a hard truth:
Delivery speed is often constrained by communication architecture, not coding speed.
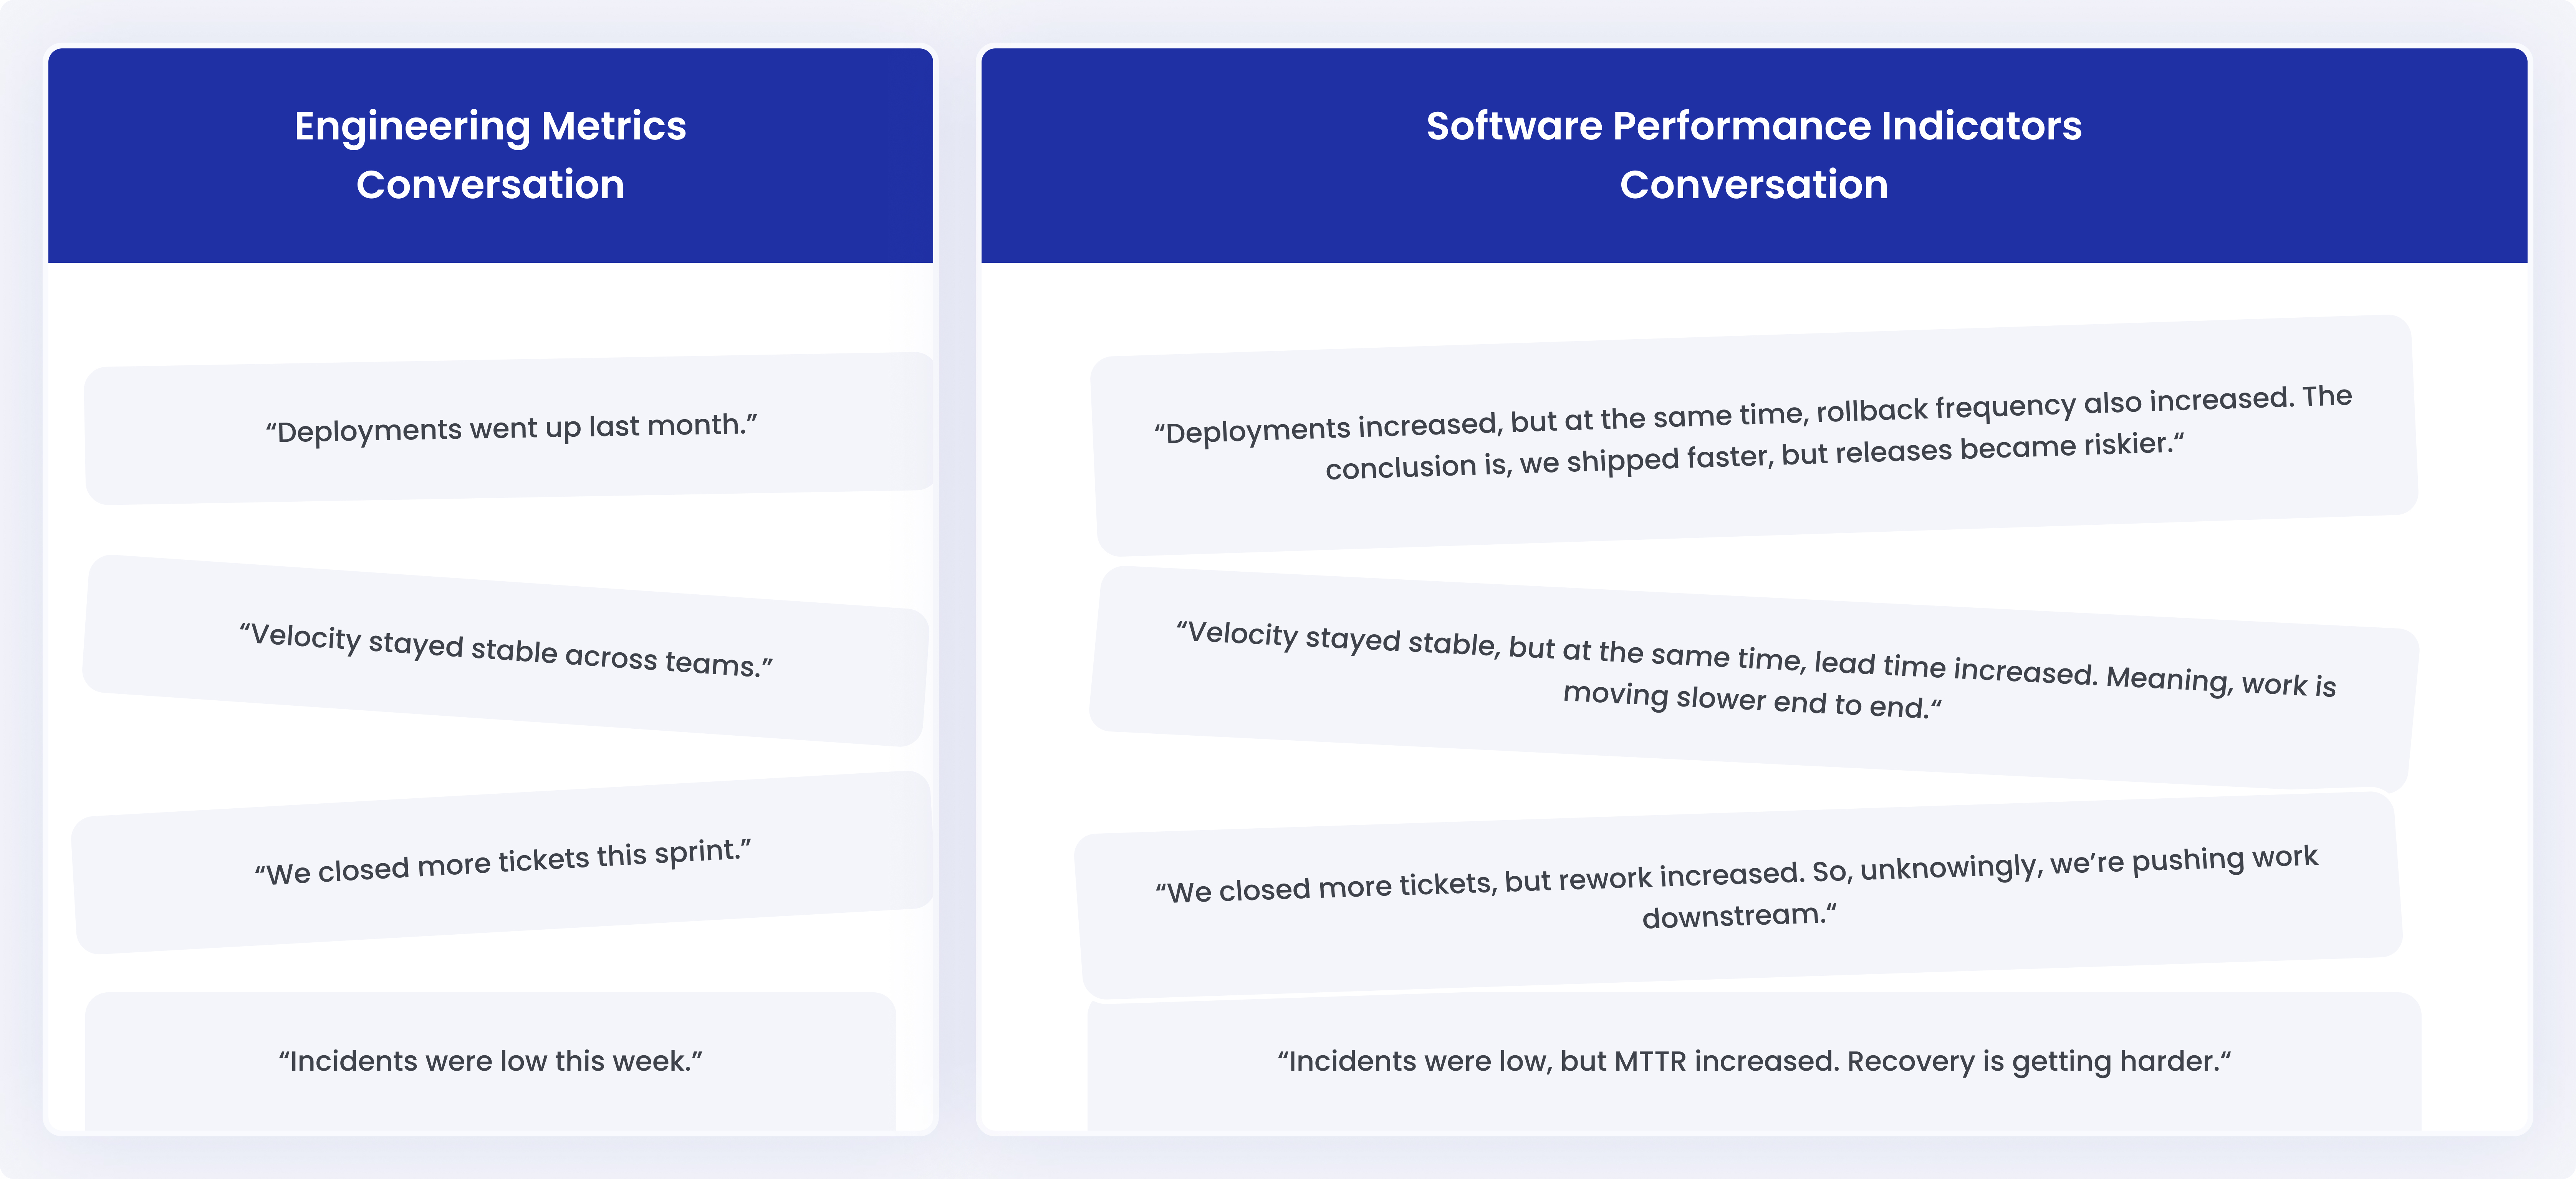
Engineering teams look at metrics and see activity. Whereas leaders look at the same metrics and comprehend them as software performance indicators.
This gap is where confusion starts. Because metrics ≠ performance.
Metrics are descriptive, whereas software performance indicators are interpretive.
The following are a few examples of metric conversation vs software performance indicators conversation from the meeting room.
Even though there are notable differences, most leaders misread dashboards. The top three reasons are…
DORA metrics are now everywhere. They’re quoted in board decks, sales pitches, and engineering reviews. Even in AI-assistant coding, they are still very relevant.
That popularity is both their strength and their weakness.
DORA is a starting point, not a finish line. Because these metrics can lose precision as organizations scale or adopt AI, we’ve developed a specialized framework for evolved DORA tracking. If you're ready to look past the surface-level numbers and see how high-performing teams correlate speed with system health, explore our deep dive: DORA Metrics in the Age of AI.
Last year, Hivel’s CEO, Sudheer, had a very insightful DORA webinar session with Benjamin Good, Tech Lead at Google, DORA contributor. In that webinar, Benjamin pointed out very different approaches to seeing DORA metrics. Sharing a few of them here.
“You can have strong delivery metrics and still experience friction, rework, or instability if you don’t look beyond the core indicators.”
“AI amplifies whatever system you already have. If your delivery practices are weak, AI will amplify those weaknesses too.”
“DORA metrics are meant to help teams learn how their systems behave. When they’re treated as targets or rankings, they stop reflecting reality.”
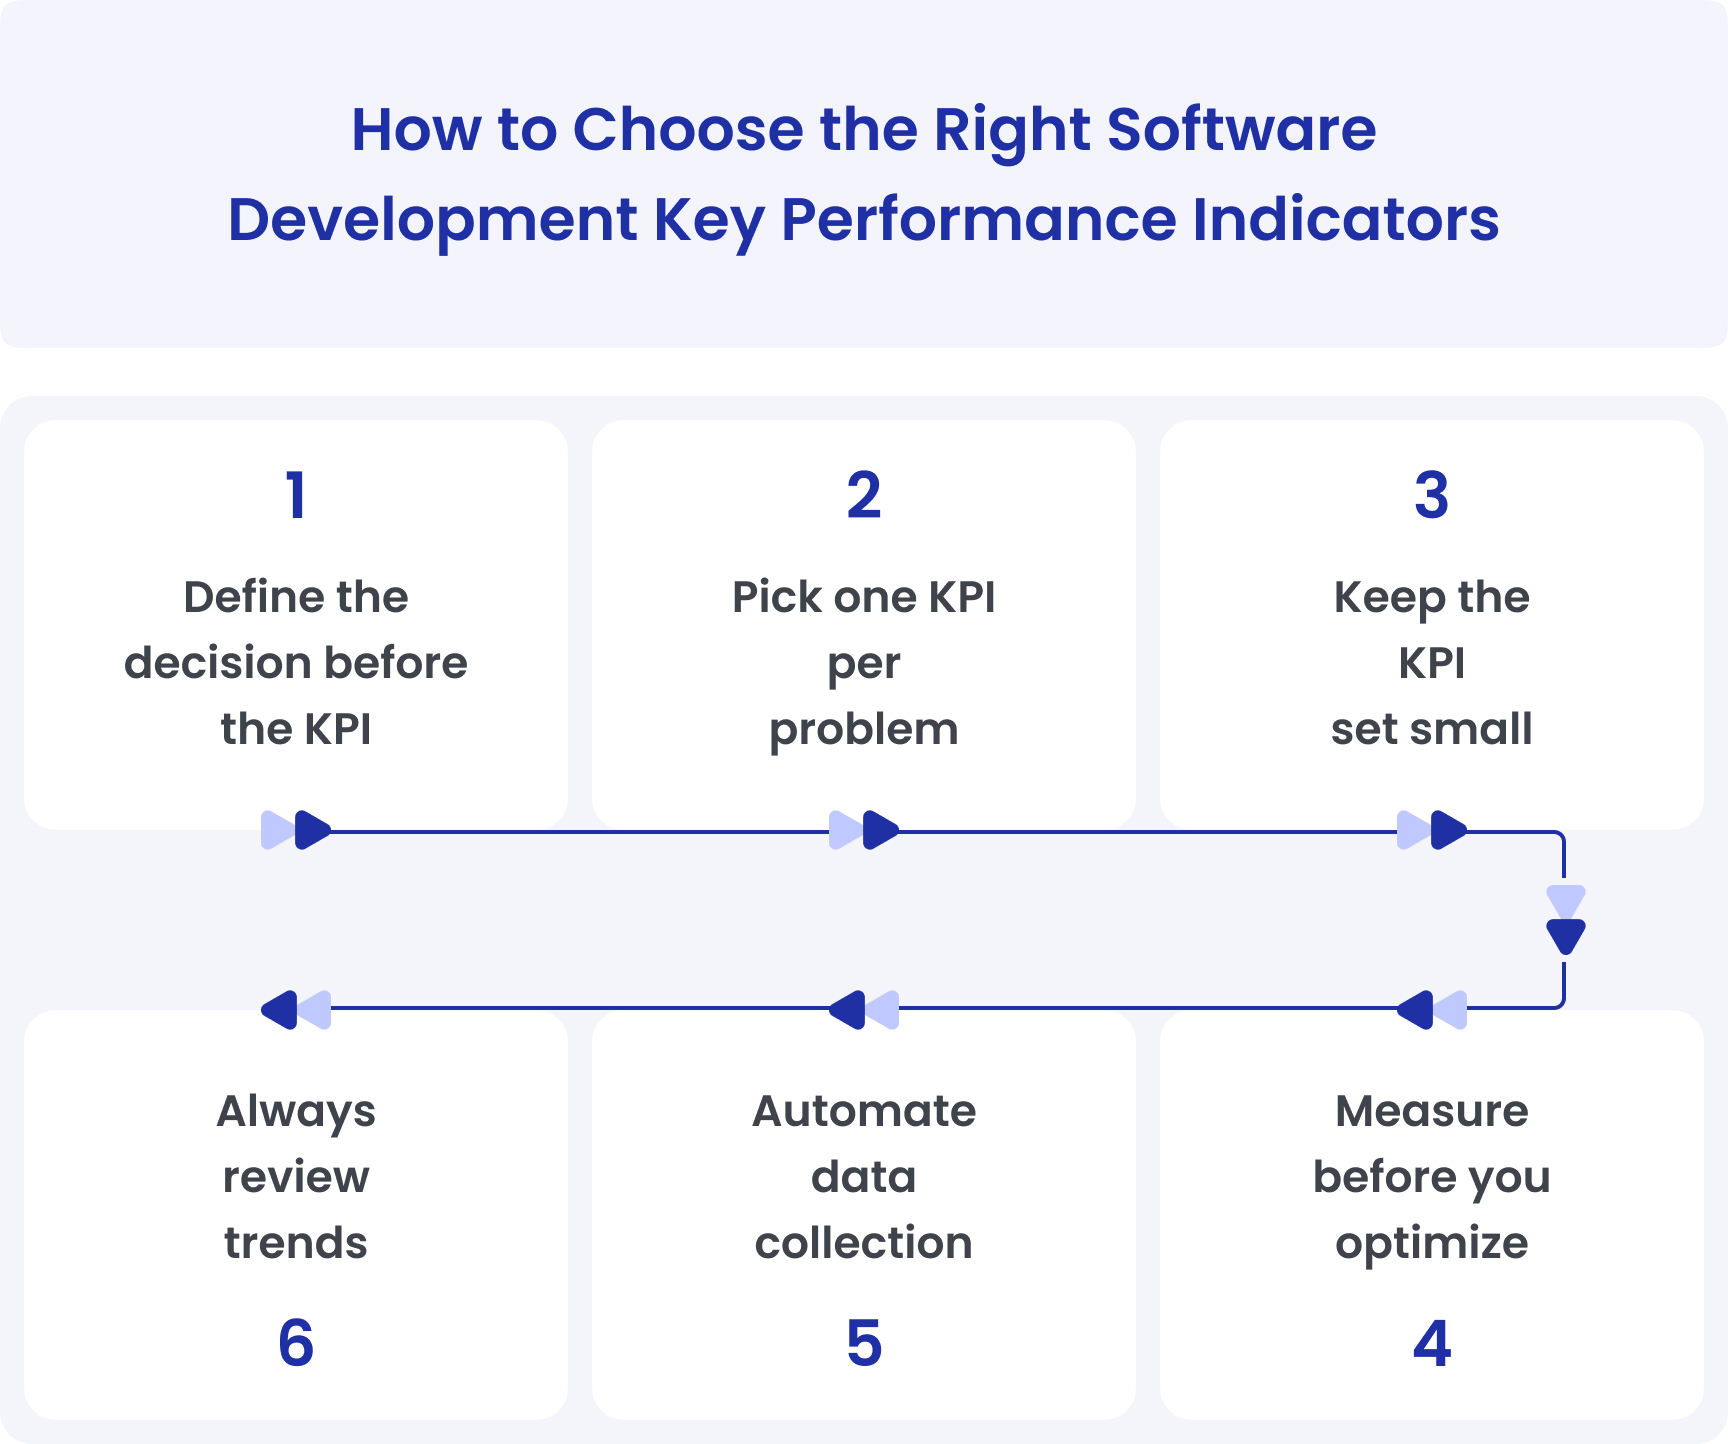
Different roles own different outcomes. So they need different KPIs.
Choosing KPIs is not a tooling exercise. But rather, it’s a decision-design exercise. The goal is not to track everything, but to track just enough to make critical decisions.
Before choosing the right KPI, answer one question: “What decision should this number help us make?”
Common decision goals:
If a KPI doesn’t support a clear decision, don’t track it.
One problem. One KPI.
Examples:
Multiple KPIs for the same problem usually create confusion.
More KPIs don’t create clarity. A good rule of thumb is:
Never fix what you haven’t observed. Before changing anything:
This creates a baseline. Without a baseline, improvements become guesswork, and setbacks are misread.
Manual KPIs don’t scale. They create lag, inconsistency, and debate, exactly the opposite of what KPIs are meant to solve.
Good setups:
If teams spend time updating KPIs, the system is broken. This is where Software Engineering Intelligence (SEI) tools help to automatically collect, normalize, and correlate data across code, delivery, reliability, and planning systems.
KPIs are directional. Never react to:
Always look at:
Most KPI failures don’t come from bad intent and bad KPI selection. But they come from small tracking mistakes that scale badly.
Tracking software development KPIs works only if the system behind it is solid. It must connect to multiple data points, work on real engineering logic, correlate multiple values, infuse intelligence, and, at last, show context-rich KPIs to teams.
It is needless to say that spreadsheets don’t make any sense here. Manual updates, inconsistent definitions, and lagging data cause endless trouble. So, the question is, what do modern engineering KPI tracking tools look like?
At minimum, it should…
It must also integrate with core data sources for reliable inputs. At a minimum, software engineering KPI tools should connect to:
Beyond these tools, modern software KPI tools should also consider AI-era signals
The goal is not to track AI usage as a vanity metric. It is to understand the impact.

However, most KPI tools were built for a pre-AI world. They assume humans write most of the code, commit reflects efforts, and activity equals progress.
But this assumption no longer holds because, as per the Stack Overflow survey 2025, 84% of respondents are using or planning to use AI tools in their development process.
Modern KPI software needs to reflect that reality.
Hivel - leading AI-native Software Engineering Intelligence Platform - is built around this exact shift. Instead of treating AI as a side KPI, Hivel…
Global engineering teams using Hivel experience 3 outcomes straightaway - context-rich, AI-ready KPIs tracking, end-to-end visibility across your engineering systems, and early identification of both bottlenecks and what’s working.
AvidXchange, the North Carolina-based AP automation leader serving 8500+ businesses and 1.35M+ suppliers, is a great example of what happens when engineering teams fix the foundational problem - scattered, incomplete engineering data. By partnering with Hivel, AvidXchange, Inc. unified all engineering signals into a single source of truth. The result wasn’t just clarity, it was momentum. Watch the full case study.
The 40-20-40 rule in software engineering takes about where engineering time goes.
40% on new feature work
20% on rework (fixes, refactors, regressions)
40% on maintenance and operational work
This rule helps leaders identify hidden drag in the system.
Common quality indicators include:
Change failure rate
Escaped defects
Mean time to recovery (MTTR)
Rework rate
Customer-impacting incidents
A good rule for how many KPIs a software development team should track is
3–5 KPIs per role
Each KPI answers a different question
Every KPI must support a decision
Yes, but not fully. DORA metrics are:
Lead time
Deployment frequency
Change failure rate
MTTR
They are strong delivery KPIs, but they don’t measure:
Rework
Planning reliability
Team load
Business impact
DORA works best paired with other KPIs.
Leading KPIs predict problems early. Examples: PR cycle time, WIP, review delays. Lagging KPIs show outcomes after the fact. Examples: incidents, customer issues, outagesHealthy teams track both.
In the SDLC, KPIs measure how work flows across stages: Build, Test, Release, Operate. Examples:
Time spent waiting between stages
Failure rates after release
Recovery time after incidents
They show where the lifecycle slows down.
A common way to view software quality includes:
Functional correctness
Reliability and stability
Performance and efficiency
Maintainability
User impact
The best KPI software:
Pulls data automatically
Measures systems, not people
Shows trends, not snapshots
Works in an AI-assisted development world
Tools like Hivel focus on system behaviour and not vanity metrics. With this, the team learns how code moves through the system. There is no perfect tool for everyone. But what matters more is choosing between reporting tools and decision tools.

Uncover hidden productivity bottlenecks in your development workflow
Streamline code review processes to improve efficiency and reduce cycle times


We'll show you exactly how AI is impacting your speed and code quality.


