
Your team ships fast. Tickets close. Sprints complete on time. But every new feature takes 20% longer than the last one. Junior engineers keep asking why a certain module works the way it does, and no one has a good answer. Your best engineers are spending three hours debugging a change that should have taken thirty minutes.
That slowdown has a name. It is technical debt, and it is costing your organization more than most engineering leaders have ever quantified.
According to research by CAST Software, companies worldwide carry enough accumulated technical debt that it would take 61 billion workdays of software development time to pay it off. The annual cost to US organizations alone is estimated at $1.52 trillion. According to Stripe's Developer Coefficient Study, developers waste approximately 33% of their working time dealing with technical debt instead of building new features.
And if your team uses AI coding tools, debt may be accumulating faster than you realize. A peer-reviewed randomized controlled trial by METR found that experienced developers using AI coding tools were 19% slower on real tasks, even though they believed they were 20% faster. That perception gap is where invisible technical debt accumulates.
This guide covers what technical debt actually is, how it accumulates, what it costs, and how to reduce it without stopping feature delivery. More importantly: which tools work in practice, which migration paths succeed, and how to make the business case to leadership with numbers they will act on.
Quick stat: A McKinsey CIO study found that one company went from spending 75% of engineering time on technical debt "tax" to just 25% after actively managing their debt backlog. The reclaimed capacity was redirected to product features.
Most engineering leaders already understand what technical debt is at a code level. What gets missed is the business impact, which is why debt conversations rarely make it to the right decision-makers until the damage is already done.
Here is the pattern that plays out in most organizations: technical debt accumulates quietly for 10 to 14 weeks. Engineers mention it in retros. It gets added to the backlog, deprioritized in favor of feature work, and forgotten. Then one of three things happens: a senior engineer quits because they are tired of working in a codebase they do not respect, a security incident exposes a vulnerability that existed for years, or a critical new feature takes six months instead of six weeks because the foundation underneath it is rotten.
At that point, debt has become a board conversation. And engineering leaders who never quantified it have no data to work with.
When engineers talk about technical debt in code terms, leadership hears jargon: legacy systems, missing test coverage, outdated dependencies. It is opaque to everyone outside the engineering team. CFOs and CEOs cannot act on "our test coverage is at 40%." They can act on "we are spending $1.2M in engineering salaries annually on maintenance work that produces no new product value."
Atlassian's 2025 State of Teams research found that information discovery has surpassed technical debt as engineers' number one friction point, with 50% of teams losing 10 or more hours per week to searching for context. That number is not separate from technical debt. It is a symptom of it. Poorly-documented, poorly-structured codebases create knowledge debt that multiplies the cost of every other debt category.
Ward Cunningham coined the technical debt metaphor in 1992 to describe exactly this compounding dynamic. The analogy is precise: just as financial debt accrues interest, technical debt accrues "interest" in the form of extra work required every time you touch the affected code.
A shortcut taken in 2021 to hit a launch deadline costs a few days of extra work when you first revisit that module. By 2024, that same shortcut might be entangled with five other systems, undocumented, and known only to the engineer who wrote it (who has since left). Now it costs weeks.
The interest rate is not constant. Debt that sits in frequently-touched, high-complexity code compounds exponentially. Debt in rarely-accessed legacy systems compounds slowly. The prioritization question is always about the interest rate, not just the debt principal.
Technical debt is the accumulated cost of taking shortcuts in code, architecture, or the engineering process that trade short-term speed for long-term slowdown. Every shortcut creates a "debt principal" that must eventually be repaid through refactoring, rewrites, or extended development time. The longer repayment is deferred, the more "interest" accrues in the form of slower delivery, higher defect rates, and increased developer frustration.
The term was coined by Ward Cunningham in 1992. His original framing was nuanced and often misquoted: debt does not just come from negligent coding. It also comes from writing code before you fully understand the problem domain. As that understanding grows, the original code becomes increasingly misaligned with reality, even if it was well-written at the time.
Gartner research projects that by 2026, 80% of all technical debt will be architectural rather than code-level. That shift matters for remediation: you can refactor bad code incrementally, but you cannot refactor a monolithic architecture into microservices in a two-week sprint.
Understanding which kind of debt you have determines how you address it. Martin Fowler's Technical Debt Quadrant, extended from Cunningham's original work, identifies four categories:
Based on Martin Fowler's Technical Debt Quadrant
Most engineering leaders inherit a mix of all four. The immediate priority is always Deliberate + Reckless debt because it indicates a process breakdown, not just a code issue. That debt will keep accumulating until the process changes.
Technical debt is the umbrella term covering any accumulated engineering shortcuts that slow future work. Code debt is a subset: specific poorly-written, undocumented, or untested code. Architectural debt is a separate and often more serious category: structural decisions about how systems connect that make the entire codebase harder to change, regardless of individual code quality.
Architectural debt is the most expensive kind. Given Gartner's projection that 80% of debt will be architectural by 2026, the measurement approach you choose matters. Static analysis tools catch code debt. Behavioral metrics catch architectural debt through its effects: rising rework rate, increasing cycle time in specific modules, growing change failure rate in interdependent services.
This section is here deliberately, before the cost data and the reduction strategies, because most engineering leaders have not updated their debt model to account for what happened in 2023 and 2024.
A peer-reviewed randomized controlled trial by METR tested experienced software engineers on real-world tasks with and without AI coding assistance. The result: developers using AI tools were 19% slower than developers working without them, even though they reported feeling 20% faster.
That 39-point perception gap is where technical debt hides. Engineers feel productive. Code gets written fast. But the code being written has characteristics that compound into debt faster than human-written code: less contextual coherence, more copy-paste patterns, and subtle architectural misalignments that slip through code review.
GitClear analyzed 211 million lines of code written in 2024 and found that, for the first time in recorded software history, the volume of copy-pasted code exceeded the volume of refactored code. Engineers were generating more than they were improving. That ratio is a debt accumulation metric dressed as a productivity metric.
CodeRabbit's analysis of AI-generated code found that it contains 2.74x more security vulnerabilities than human-written code. Security vulnerabilities are a specific form of technical debt: they are correct code in the sense that it works, but structurally unsound in ways that create future liability. Security debt compounds especially fast because each vulnerability expands the blast radius of every other one.
This is not an argument against AI coding tools. It is an argument for code review discipline proportional to the volume of AI-generated code entering your codebase.
The same tools that create debt can reduce it, with the right workflow:
Debt rarely arrives in obvious chunks. It builds gradually, in ways that feel reasonable in the moment, until the accumulated weight becomes impossible to ignore.
Each path produces a different kind of debt, which requires a different response. Deadline-pressure debt is addressable through process changes (dedicated cleanup sprints, the 20% rule). Knowledge-gap debt is addressable through documentation, architecture review, and onboarding improvements. Bit rot is addressable through dependency management tooling and regular maintenance cycles.
Technical debt's most measurable behavioral signature is the rework cycle: code that is written, reviewed, sent back, rewritten, re-reviewed, and sometimes abandoned and restarted. Every cycle through that loop is time spent not shipping new value.
Across Hivel's analysis of 750+ engineering organizations, rework cycles account for 20 to 40% of total development time. This data is drawn from anonymized aggregate analysis of teams ranging from 30 to 3,000+ developers across software, fintech, logistics, and SaaS. The median rework rate is 22%, with high-debt codebases consistently clustering above 32% and well-maintained codebases below 15%.
In high-debt codebases, rework pushes toward the top of that range. The mechanism is direct: poorly-structured code is harder to review correctly, harder to test adequately, and more likely to require revision after the first attempt.
Rework rate is one of the most reliable leading indicators of technical debt accumulation in a codebase. It is also one of the metrics most teams never measure.
Before you can make a case for debt reduction investment, you need to quantify what debt is actually costing your organization. The research makes this easier than most leaders expect.
The retention number is the one that surprises most leaders. Technical debt is treated as a code problem when it is also a talent problem. A senior engineer earning $200K who spends 33% of their time on maintenance work they find unrewarding is a meaningful flight risk. Multiply that across a 50-person engineering team and the annual attrition cost from debt-related frustration becomes significant.
You do not need precise numbers. You need plausible ranges.
Take two data points from your own engineering data:
If sprint delivery is consistently at 65% of planned and rework accounts for 25% of development time, you have a direct argument: eliminating half the rework restores roughly 12% of engineering capacity. At fully-loaded engineering cost, that is measurable. Most boards respond to "we are spending X per quarter on work that produces no new product value" in a way they never respond to "our test coverage is low."
Debt's impact on talent retention is systematically underweighted in most technical debt conversations.
Gartner's 2024 research found that teams with high-quality developer experiences are 20% more likely to retain their talent. Technical debt is one of the primary drivers of poor developer experience. Engineers working in high-debt codebases face slower feedback loops, more frustrating debugging cycles, less confidence in their changes, and less opportunity to do work they are proud of.
"Engineers don't leave for money. They leave because you waste their time. Broken processes, unnecessary meetings, rework cycles. Pay $300K. They still quit." (Sudheer Bandaru, CEO, Hivel)
The replacement cost for a senior software engineer ranges from $50,000 to $100,000 when you account for recruiting, onboarding, and productivity ramp-up. For a 50-person engineering team experiencing high-debt attrition, that is $250,000 to $500,000 in annual turnover costs attributable, at least in part, to a debt problem that could have been addressed for a fraction of that cost.
Most technical debt reduction efforts fail for the same reason: teams start fixing before they understand what they have. The result is unfocused effort that reduces debt in low-impact areas while the high-interest debt keeps compounding.
The fundamental challenge: most engineering analytics tools do not surface technical debt as a measurable entity. They track commits, PRs, and deployment frequency. None of those tell you where the debt is or how quickly it is compounding.
You need two types of measurement to see debt clearly.
Static analysis tells you where the code is bad. Behavioral metrics tell you which bad code is actually hurting you. The combination shows you where to invest first.
Tactical Tool Selection Guide:

You do not need to wait for a crisis to see debt building. These signals appear in your engineering data 60 to 90 days before debt becomes a delivery problem:
The most common objection to debt reduction: "We cannot stop shipping features to work on the codebase." This is the wrong frame. Nobody is asking you to stop shipping. The question is how to create structured, sustainable capacity for debt reduction alongside feature work.
The most practical and widely-adopted approach is simple: protect 20% of each sprint for debt reduction work. This is not refactoring time tagged onto feature tickets. It is a dedicated, tracked, prioritized capacity allocation.
Step-by-Step Implementation:
The common failure mode: the 20% gets sacrificed to feature urgency the moment any sprint runs behind. To prevent this, debt work needs its own sprint items, its own velocity tracking, and leadership visibility. Not buried in "misc" or "tech cleanup." A labeled, tracked, reviewed investment.
Not all debt is equally urgent. Prioritize based on three factors:
Highest priority: high severity + wide blast radius + high touch frequency. This is the debt that is actively costing you delivery speed every single sprint.
For significant architectural debt, two approaches dominate:
The Strangler Fig Pattern incrementally replaces a legacy system by routing new functionality through a new implementation while the old system continues running. The old code is "strangled" gradually as each piece is replaced. Slower but carries far less risk: the system remains operational throughout, and each increment can be validated independently.
The Big Rewrite replaces a legacy system all at once. Faster on paper, cleaner result in theory. In practice, it almost always takes longer than estimated, accumulates new technical debt as the team rushes to hit the rewrite deadline, and creates a window of instability when the old system is decommissioned before the new one is fully proven.
Unless the existing system is completely beyond incremental repair (which is rarer than teams think), the strangler fig pattern is the safer choice. The bias toward big rewrites is usually emotional, not technical: engineers want a clean slate.
This pattern is universally applicable. It gives your team confidence that behavior is preserved, and it gives you a rollback condition (tests fail = do not cut over).
Example: Monolith to Microservices Migration
You inherited a monolith that works but is painful. New features take 2 to 3x longer than they should. Your best engineers are frustrated. You need a practical path forward without stopping delivery.
The intersection of high rework rate + high complexity score + engineer complaints is your attack surface.
You built a product fast to reach product-market fit. It works. But the code is getting messy. Teams are colliding in the codebase. New features are starting to slow down. You are at the inflection point: fix the foundation now, or pay exponentially later. After 30 to 40 engineers, this is 3x harder.
Fresh products usually have different debt characteristics than legacy systems:
MoveInSync is a B2B SaaS company with 200+ engineers that provides mobility management software for enterprise clients. By 2022, their engineering team was experiencing a pattern that will sound familiar: new features in one particular microservice were taking significantly longer than estimated, PR sizes in that module were ballooning, and senior engineers were spending hours reviewing changes that should have taken minutes.
Hivel's analysis identified the root cause: large PR sizes in the mobility-management microservice were the primary driver of their rework cycle. PRs averaging 800 to 1,200 lines were being reviewed by engineers who lacked full context on the module, leading to surface-level reviews, missed architectural issues, and repeat revision cycles. The rework rate in that module had climbed from 11% to 28% over three quarters.
The intervention was precise: MoveInSync implemented a 400-line PR size limit for that microservice, paired it with dedicated refactoring capacity of 20% per sprint (targeting the highest-complexity functions first), and used Hivel's Investment Profile to track whether engineering time was actually shifting from maintenance to net-new work.
Within two quarters, the results were measurable. Overall development cycle time dropped 60%. Code review time dropped 37%. Large PRs (800+ lines) in that module dropped 28%. The engineers who had been spending Friday afternoons debugging rework were instead shipping features.
The broader lesson: MoveInSync did not stop shipping to fix their debt. They identified the specific module, specific metric, and specific intervention (PR size limit + refactoring allocation), then measured the outcome. That precision is what made the investment defensible to leadership.
This is the conversation most engineering leaders dread. The board is asking for quarterly roadmap commitments. You are looking at a codebase that will make every one of those commitments harder than it looks on the slide. How do you communicate the constraint without sounding like you are making excuses?
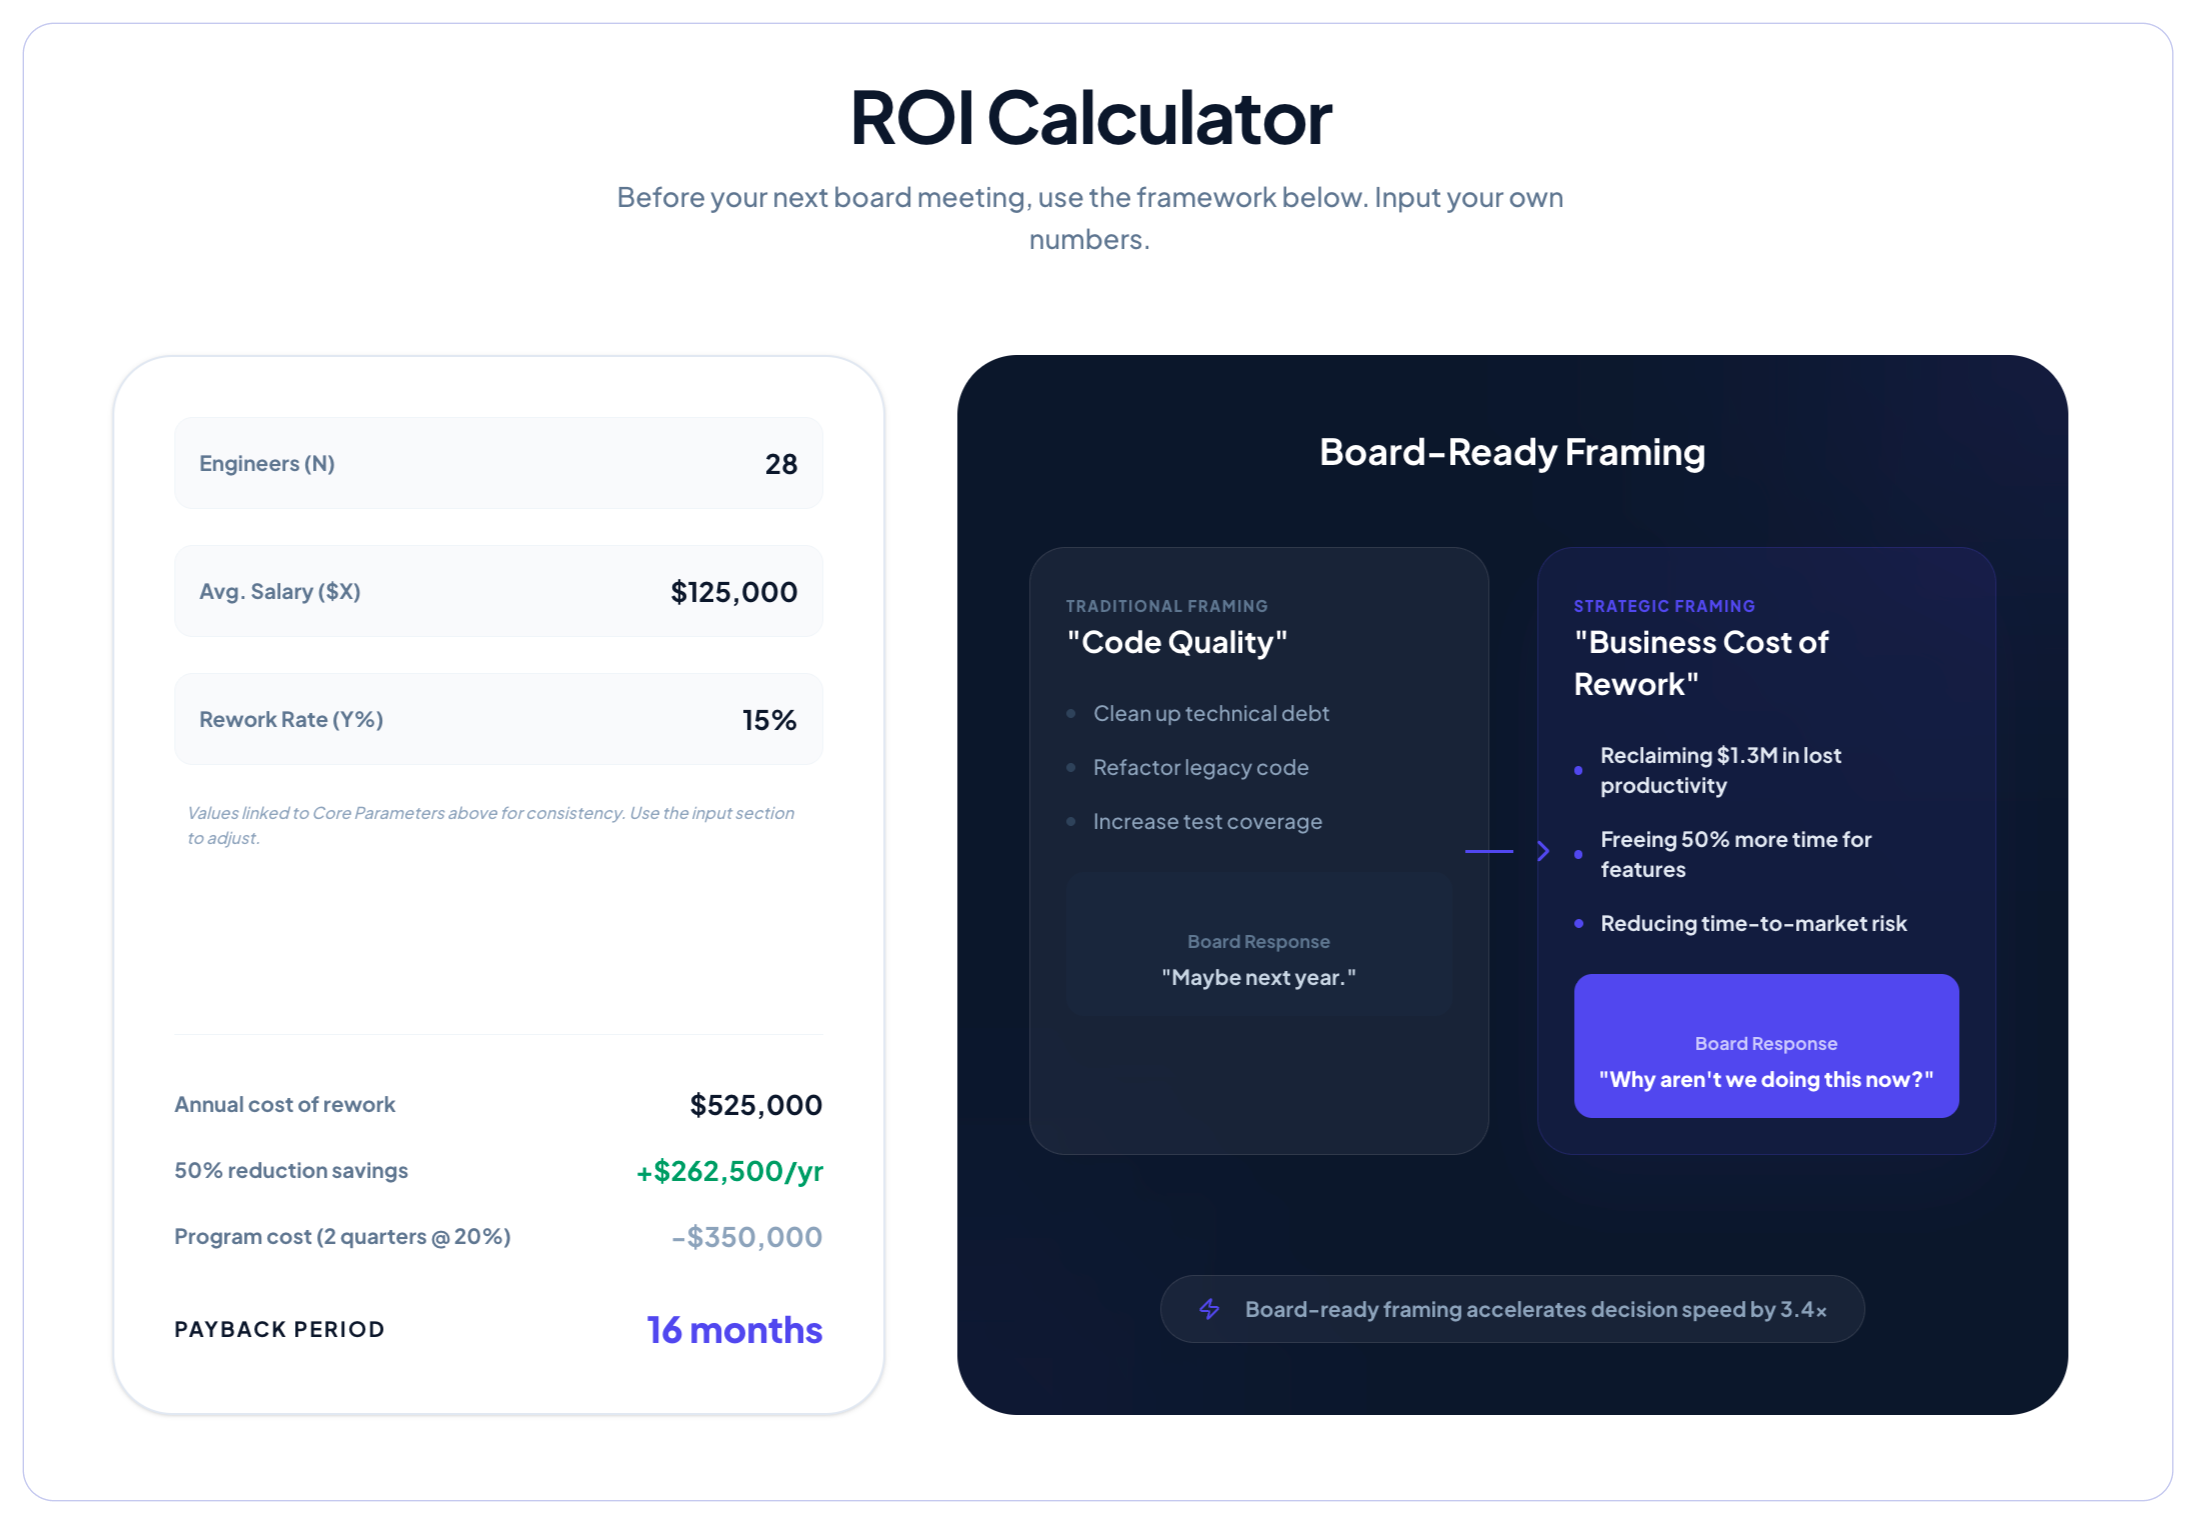
Use our free board presentation template. We've pre-built the slides from the framework below. Customize with your own metrics and walk in with a presentation your CFO can engage with. Download the template
The board speaks in delivery timelines and cost. Connect your debt metrics to those two dimensions directly.
A McKinsey study found that companies actively managing technical debt free up engineers to spend up to 50% more time on work that supports business goals. Gartner predicts that organizations with formal debt quantification methods release features 35% faster than competitors.
Board presentation template (customize with your numbers):
Most engineering analytics tools do not have a technical debt view. They show you deployment frequency and cycle time, neither of which tells you where debt is accumulating or what it is costing.
Hivel connects your Git, Jira, and CI/CD data into a behavioral debt signal: where are engineers spending extra time, which modules have rising rework rates, and where is change failure rate concentrated.
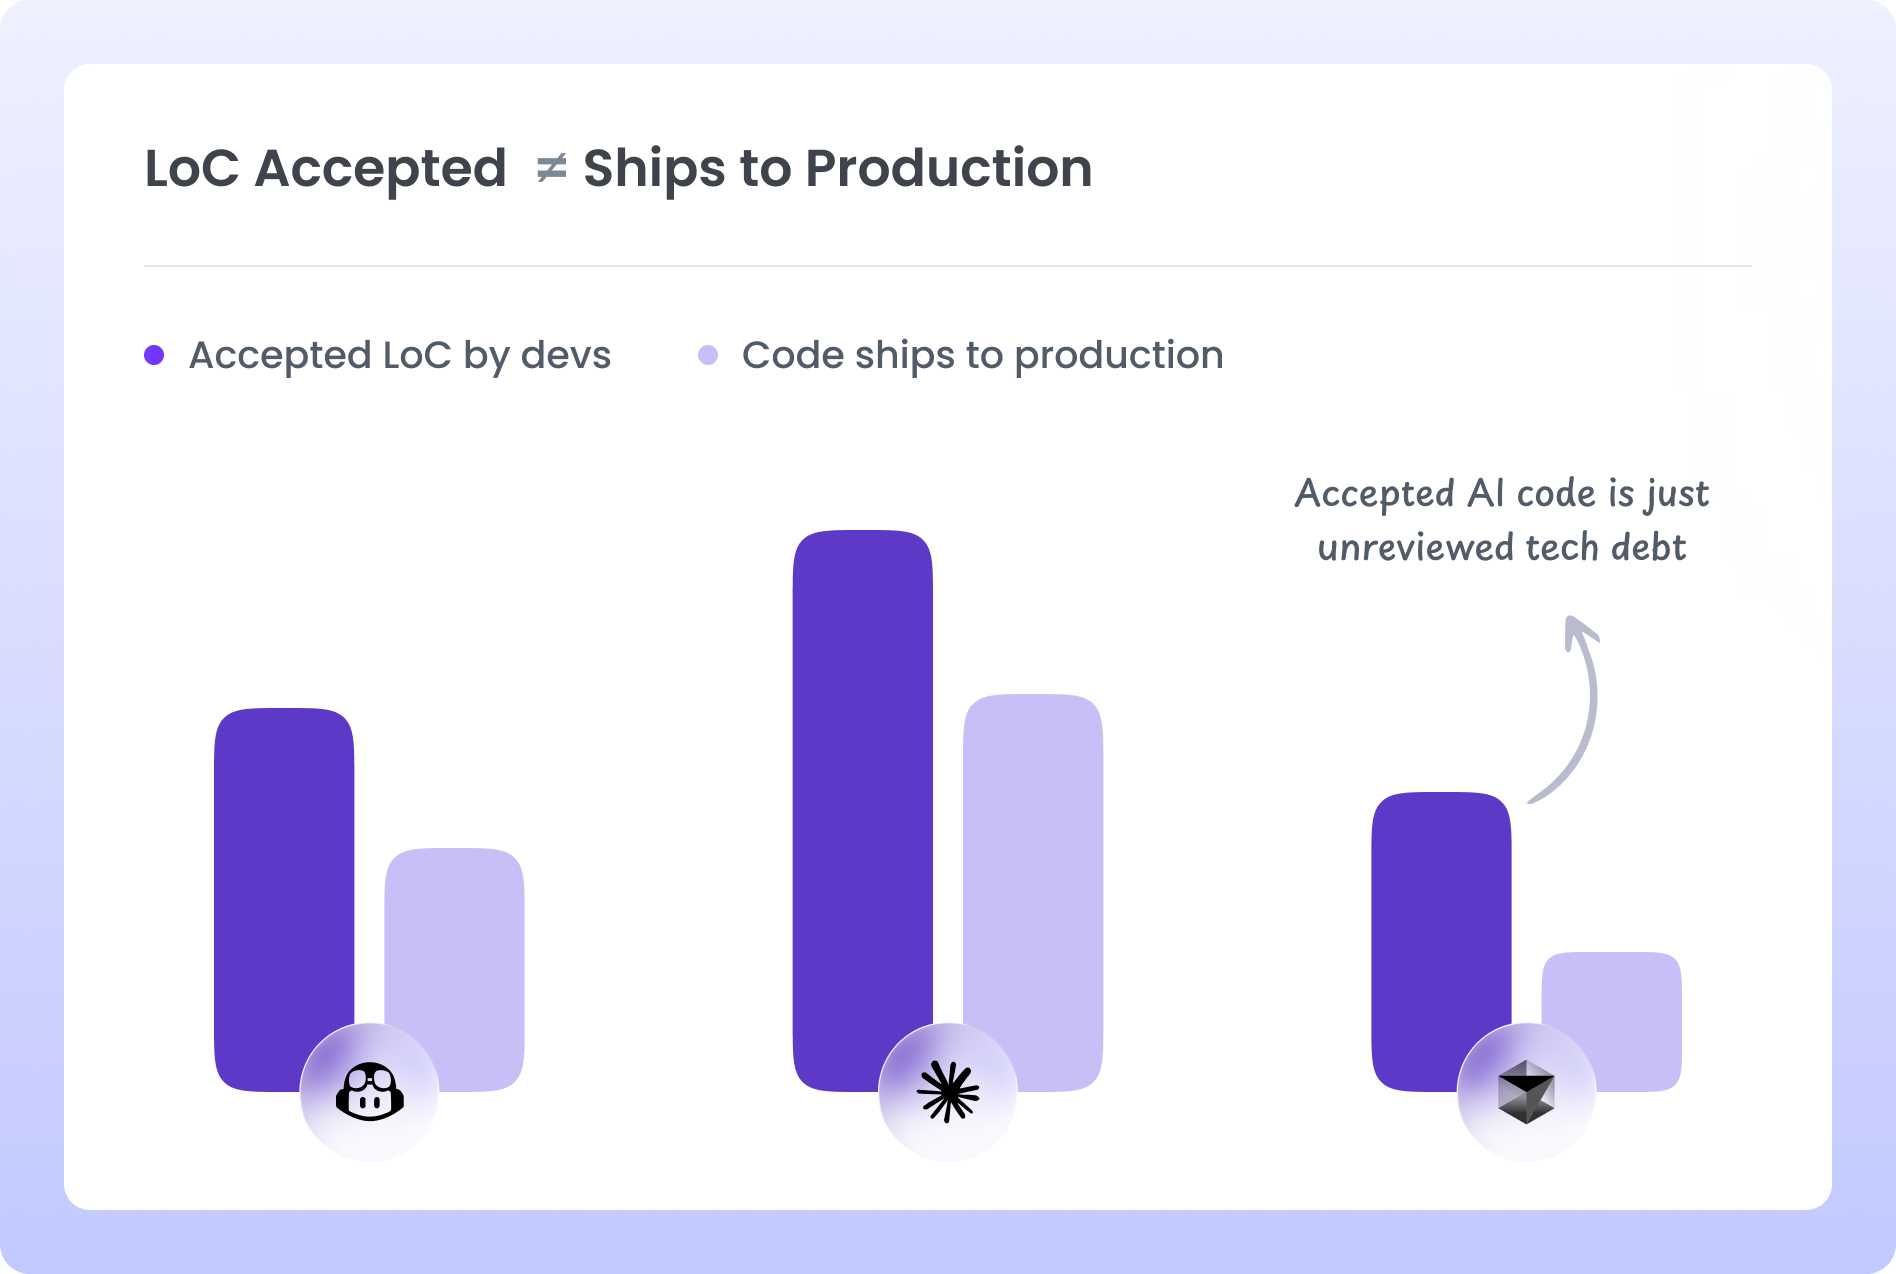
Hivel's data set covers 750+ engineering organizations ranging from 30 to 3,000+ developers across software, fintech, logistics, and SaaS verticals. Across 1,000+ engineering organizations tracked for AI adoption metrics, typical AI code acceptance rates run at 30 to 40%, while production-merge rates for AI-generated code run at 12 to 20%. That gap, between what gets accepted and what actually ships, is where AI-generated technical debt accumulates invisibly.
"Acceptance rate is the wrong metric for AI tools. We measure production-merged code, because that is the only output that actually matters. And when we do, we find that most of the AI code that gets accepted never makes it to production in the form it was accepted." (Sudheer Bandaru, CEO, Hivel)
Rework rate by codebase module is the most reliable behavioral indicator of where technical debt is actively hurting delivery. A module with a consistent 8% rework rate over six months is in reasonable shape. The same module with a rework rate that has climbed from 8% to 22% over three quarters is accumulating debt faster than it is being addressed.
Hivel tracks this trend by module, by team, and by sprint, giving engineering leaders an early warning signal rather than a retrospective crisis.
Hivel's Investment Profile merges Jira and Git data into a single allocation view: how much engineering time is going to new features, bug fixes, technical debt, and unplanned work.
The uncomfortable finding in most teams: the allocation does not match the roadmap. A team nominally focused on new features is often spending 35% of its time on maintenance and debt-related rework. Making that visible is the first step to changing it.
See how Hivel identifies technical debt in your engineering data
Technical debt is the accumulated cost of shortcuts taken in code, architecture, or engineering process. Every shortcut creates a future liability: slower development, more bugs, harder onboarding. Like financial debt, it compounds. A shortcut that saves one day today can cost one week a year later when the same code needs to be changed. The annual cost to US organizations is estimated at $1.52 trillion.
Measure it through two complementary lenses. Static analysis tools (SonarQube, CodeClimate, Semgrep) identify where the code is complex, undocumented, or poorly tested. Behavioral metrics (rework rate by module, PR review latency, change failure rate by service) show where debt is actively hurting delivery speed. The most actionable insight comes from overlaying both: high-complexity modules that are also frequently-touched with rising rework rates are your first priority for debt reduction.
The industry benchmark is 20% of sprint capacity, but the right number depends on how much debt your codebase has already accumulated. Hivel's analysis of 750+ engineering organizations found that teams spending less than 10% of capacity on debt reduction have rework rates that climb 5 to 8 percentage points per quarter. Teams consistently allocating 20% maintain rework rates below 18%. The 20% rule is not the ceiling, it is the floor for teams with significant accumulated debt.
Translate it into three business metrics: capacity loss, delivery delay, and retention cost. "We are operating at 67% of engineering capacity because 33% of dev time goes to maintenance" is a capacity argument. "The payments feature will take 6 weeks instead of 4 because of foundational debt in that service" is a delivery argument. "We lost two senior engineers last quarter, partly because of codebase frustration (replacing them costs $80,000 to $150,000)" is a retention argument. Engineering leaders who can make all three arguments get budget for debt reduction.
A bug is a specific defect: code that produces an incorrect result. Technical debt is a structural condition: code or architecture that is correct today but harder to change, maintain, or extend than it should be. Bugs are caused by technical debt (fragile code breaks more often), and debt is created while fixing bugs (quick patches without refactoring). They are distinct problems requiring different responses: bugs require fixes, debt requires systematic investment.

Uncover hidden productivity bottlenecks in your development workflow
Streamline code review processes to improve efficiency and reduce cycle times


We'll show you exactly how AI is impacting your speed and code quality.


