

Sudheer Bandaru and Nathen Harvey, who lead the DORA Team at Google Cloud, spent an hour on the question that every engineering leader is now being asked.
Key takeaways
- 60% of paid AI coding licences show no behavioural change by week four of rollout. People try the tool on small tasks and never make it a habit.
- AI-generated code carries roughly 3x the rework of human-written code. The savings show up in keystrokes; the cost shows up downstream, where nobody is watching.
- Committed AI spend runs 30% or more above actual burn by the time renewal arrives at many organizations.
- Around 40 to 50% of engineers have never selected a model. They are on whatever their IDE defaults to, which means premium tokens are paying for boilerplate and config changes.
- Usage is not output. Every AI vendor dashboard reports how many suggestions were accepted. None report what survived code review, reached main, and was still running in production thirty days later.
- Download SURGE Framework paper - here
This article is an adapted recap of an executive session between Sudheer Bandaru (CEO, Hivel) and Nathen Harvey (DORA Lead, Google Cloud). You can watch the full recorded conversation above or read the comprehensive framework breakdown below.
The question every engineering leader is now being asked
We opened the session with a poll, because we wanted the room to answer before we said anything. It was a blunt question: is your engineering AI spend working?
16% said yes and had data to back it. 58% said yes, without data. 26% said it was not working.
That middle number is the whole problem. Most leaders believe their AI investment is doing something useful, and almost none of them can prove it in a format anyone upstream will accept. Three different people are asking three different versions of the same question, and none of them want a usage report.
- Your CTO wants output per dollar. Not tokens consumed, not seats issued. What did we ship, and what did shipping it cost? Every vendor tool reports usage. None of them tell you how many merged pull requests came out of the tokens you burned.
- Your CFO wants ROI, not adoption. They approved a number and want to know what the number returned. The nearest thing most organizations can offer is a licence count.
- Your board wants proof, not promises. The question there sounds like this: we have 500 engineers, AI arrived, are we now getting the output of 600? Should next year’s budget go up or down? You cannot answer that with an adoption chart.
What the early signals showed before we built anything
We work with engineering data from a lot of organizations, and a few patterns showed up often enough to shape the framework itself.
The first is commitment drift. By the time renewal comes around, committed AI spend frequently sits 30% or more above what teams actually burned. The gap between what finance signed and what engineering used goes unexamined until someone is sitting in a vendor negotiation with nothing to push back with.
The second is stalled adoption. 60% of paid licences show no behavioural change by week 4 of rollout. Sudheer was precise about what that means: people experiment occasionally, on small tasks, and it never becomes the way they work. The licence is live. The habit never formed.
The third is the one that surprises people. Where habits do form, rework rises. AI-generated code carries about 3x the rework of human-written code. You feel the speed at the keyboard. The cost lands weeks later, in a place most teams do not instrument.
Why AI behaves like an amplifier?
Nathen Harvey used to lead the DORA research programme at Google Cloud, and he co-authored SURGE with us. He brought the finding that sits underneath everything else.
Across DORA’s 2025 research, built on nearly 5,000 survey responses plus qualitative interviews, the primary role AI plays across software development is that of an amplifier. High-performing teams with good systems get better. Lower-performing teams with weak systems and a lot of friction get more chaotic.
His phrasing was sharper than any summary of it: AI improves the things that are already going well, and the things that are not going well, AI makes you feel much more acutely.
The data behind that is worth sitting with. DORA modelled what happens as AI adoption increases, where adoption itself is scored on three things: how much you rely on AI, how much you trust it, and how reflexively you reach for it. The largest increase they measured was individual effectiveness. People feel more effective, and that is real.
The second largest increase was software delivery instability. Code ships, then needs to be reworked. Organisational performance, code quality, throughput and team performance all moved up too. Burnout and friction sat close to zero, though Nathen flagged that this measurement predates the current wave of agentic work, and he expects it to move. His description of why will be familiar to anyone running agents: more work in flight, more agents to manage, and the feeling that they just need one more prompt to get it right. Then one more. He called the workflow frankly addictive, and said teams need to watch for it deliberately.
The productivity paradox, and the J-curve underneath it
Developers feel more productive. Code ships faster. Instability rises at the same time. That is the paradox, and it is not a contradiction so much as a sequencing problem.
AI is, in some respects, exactly like every previous change: moving to cloud, adopting containers. It feels different because it is faster and hits harder, but it is still a change management process. Any significant change produces what DORA calls the J-curve of productivity. You lose ground first. You gain it back later, if you stay committed through the dip.
On our own data, first-year AI ROI tends to show a payback around the eight-month mark. That number matters for a practical reason: if you measure at month three and defund based on what you see, you are killing the investment inside the dip, which is the one place the numbers always look bad.
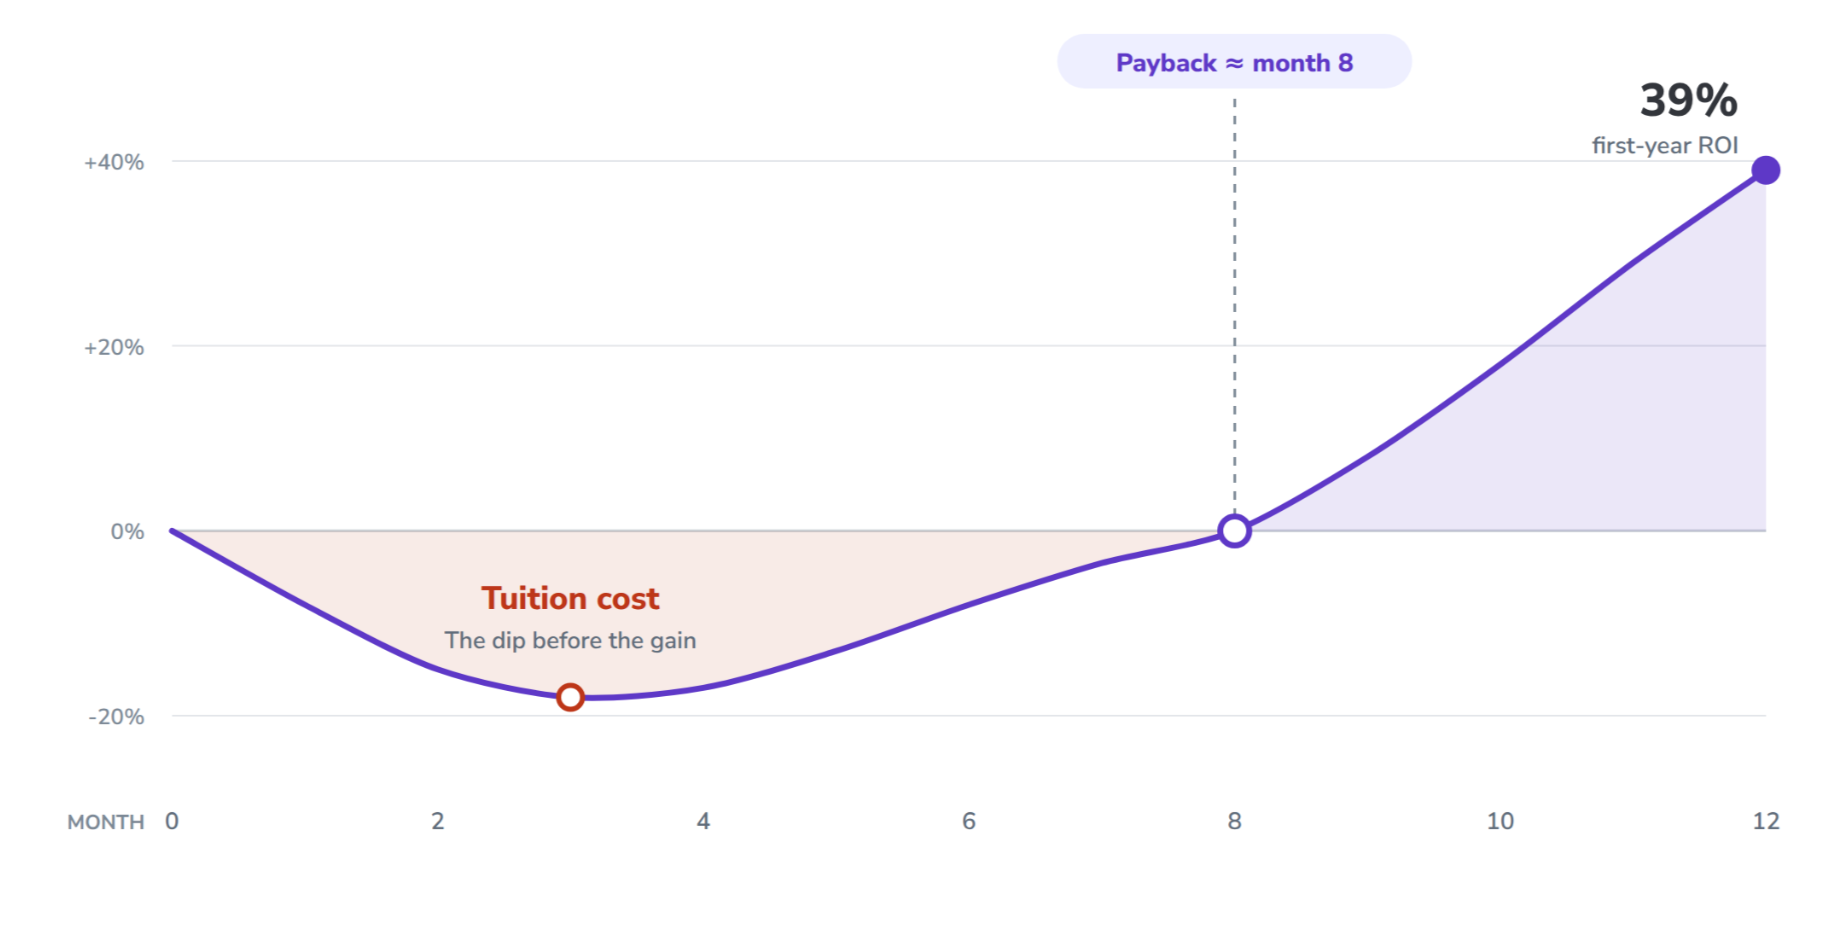
Nathen made a related point later that changed how we talk about recovery. Driving efficiency before you understand how something works is a trap. You need to use the tools to learn what they are good for. Restricting models on day one means you never learn what the other models would have given you. He framed that early spend as tuition cost, the price of learning, and Sudheer agreed on the sequencing: recovery starts after you have crossed the tuition threshold and the enablement work is done. Not on day one.
The verification tax: you scaled generation, not review
Here is the thing your team is probably feeling right now. Code reviews hurt.
Nathen named the mechanism: the verification tax. AI massively increased our ability to generate code. Most organizations did not do anything at all to increase their ability to validate it. Generation is wide, review is narrow, and everything you produce funnels through the same bottleneck of what a human can actually read and trust.
His recommendation was unusually direct for a researcher. If you have not looked at how to scale and optimise your verification process, you will get more return from that work than from generating even more code.
We see the same thing on the data side, and there is a correlation worth naming: where the verification tax is high, rework is high. People push code to production without real review, and it comes back. Cycle time even looks good while this is happening, because reworking yesterday’s change is fast. You are not moving. You are spinning.
When we polled the room on how they handle it, most were already using AI in code review, some had added human reviewers, and a small group had changed nothing yet. Nathen’s suggestion for the AI reviewer is one we now repeat often: have it assess the risk of the change. High-risk changes pull in a human. Low-risk changes can flow.
Why SURGE when we have DORA and SPACE?
They answer different questions. DORA tells you how well you deliver, and it remains the foundation of how engineering performance gets measured. SPACE tells you about the experience developers have while building software. Both give you capabilities, patterns, and a sense of what to expect in return.
Neither was built to put a dollar figure on an investment. That is the gap.
Sudheer’s framing on the call: the ROI answer is not a single number and not a single piece of maths. The maths is simple. The data feeding it has to be detailed enough to survive a finance conversation, and that data has to come from a software development lifecycle with many moving parts.
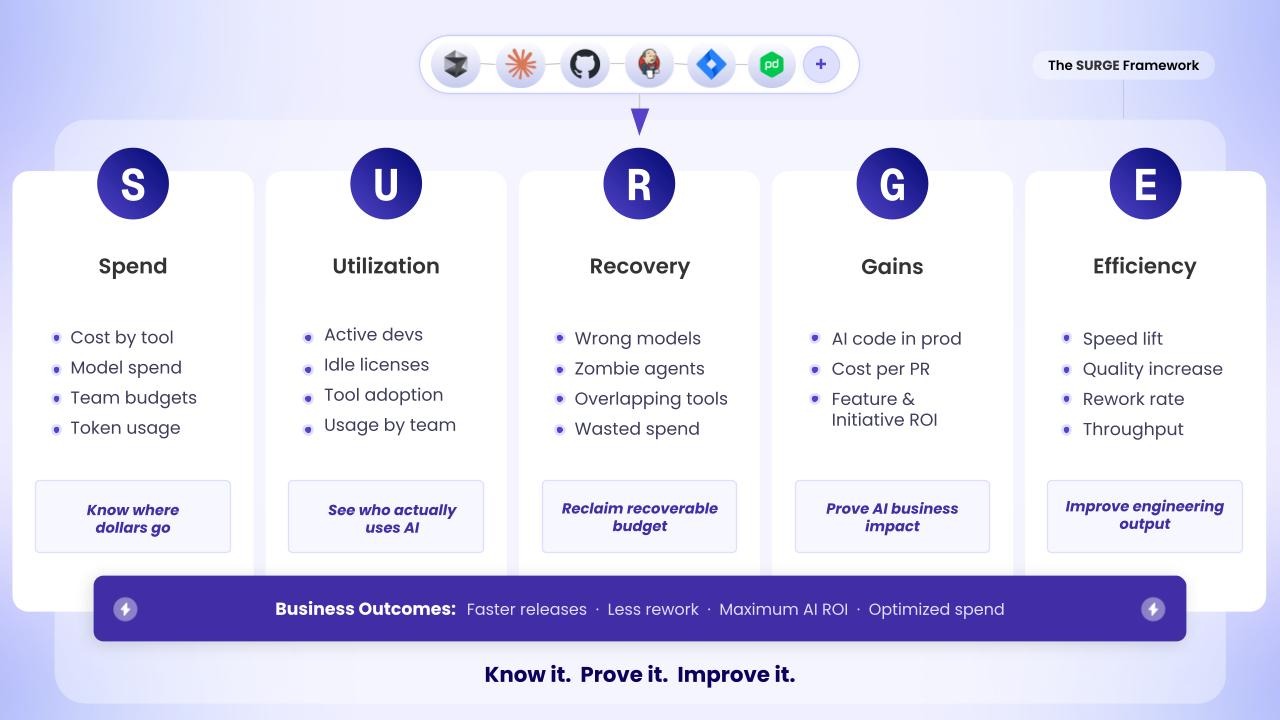
The Five Pillars of SURGE Framework
Each pillar of the SURGE Framework answers one question, needs specific data, and has a hard part that stops most teams.
S - Spend
The question: Where is the money actually going, by team, by tool, by work type?
The obvious objection is that you can see spend on any vendor dashboard. That works until you have a million dollars on Cursor, half a million on Claude, and a couple of hundred thousand on Copilot. Then you need one view across all of it.
You also need it broken down by team, because you cannot act on a number without knowing whose number it is. Sudheer put it plainly: you cannot answer anything if you do not know which team and which owner to ask.
The hard part is that team-level breakdown. Organizations have org-level totals and developer-level detail, and the useful layer sits between them. In a 2,000 or 3,000-person engineering organisation, chasing individual developers does not scale, but a business unit or function view is actionable. HR systems rarely reflect how engineering pods are actually formed, which makes the mapping harder than it sounds.
The early signal is the best story from the session. In one organisation, every developer received $100 of AI budget, and every developer used all $100. That looks like textbook adoption. Then we looked at when the money was spent, and almost all of it landed on the last day of the month. The developers explained it without embarrassment: if you do not burn it, you do not get next month’s budget. That is not a habit. That is a budget cycle wearing a habit’s clothing.
U - Utilization
The question: Who is actually using what you bought, and for what kind of work?
Pricing has shifted from per-seat to usage-based across much of the market, so utilization is no longer just a licence question. What you want to know is who the power users are, what patterns are repeatable, and how usage differs between developers, architects and QA. AI use has travelled well beyond the people who write code for a living.
The hard part is that an inactive seat is two completely different people. One was never expected to write code. The other was expected to write code and has not touched AI. Those two need opposite responses. The first is a licence you can reclaim. The second is a coaching problem, and taking their access away is the wrong move.
We identify the second group by looking for people who are committing code but show no AI activity. There is a third cohort worth watching too: people burning tokens steadily who never merge anything to production.
R - Recovery
The question: How much of this spend is recoverable without hurting anyone’s work?
Recovery has more sources than most teams expect. Overlapping licences come first, and they are common: more than 70 to 80% of the organizations we work with run multiple AI coding tools, and almost none can say which engineers hold two or three at once. Then shelfware seats. Then commitment mismatch, where what you committed to and what you spent have drifted apart in either direction.
Model usage is the one that surprises people. Between 40 and 50% of engineers have never selected a model. They use whatever their IDE defaults to, which means premium tokens are being spent on boilerplate and config changes that a cheaper model handles identically. When we polled the audience on where their biggest recovery opportunity sat, inefficient model usage came out highest at around 47%, and the rest spread fairly evenly across the other patterns.
Individually, these look small. Summed across six months in an illustrative 350-engineer organisation, they came to $360,000 in recoverable spend.
The hard part is timing, and this is where Nathen’s tuition-cost point applies directly. Start recovery on day one, and you cut off the learning that makes the investment work at all.
G - Gains
The question: Is the spend producing more and better output, and can you attribute the gains to AI-generated code?
This is the pillar with the elephant in it. Shipping faster is easy to observe. Proving that AI caused it is the hard claim, and a license count proves nothing.
The chain we trace runs like this: a prompt generated some code, someone accepted it, it went into a commit, it survived code review, it reached production, and it was still there thirty days later with no rework and no incident attached. When AI-assisted code clears that whole path and delivery gets faster, you have a gain you can defend.
We look at this as a spend-versus-output quadrant, with bubble size showing team size. High spend with high output is where you want teams to sit. Low spend with high output is the group Sudheer warned against touching: if they hold dormant seats, do not reclaim them; ask why they are not using AI. Low spend with low output needs a conversation about blockers. High spend with low output is the quadrant that should worry you most, because those teams are burning tokens without shipping.
E - Efficiency
The question: Did the organisation as a whole get faster, not just the people using AI?
The distinction between Gains and Efficiency matters. Gains tells you whether the people using AI are getting value from it. Efficiency tells you whether the organisation is moving in the right direction overall: cost per change under control, delivery improving, rework contained.
Most organizations are still partway through rollout, with entire teams and functions outside the programme. Buying AI does not automatically produce organisational efficiency, for the same reason adding people to a team does not automatically make it ship faster. The J-curve applies here too. Efficiency is what tells you whether you have climbed out of the dip.
The ROI math, and the cost line most teams forget
The formula is not complicated:
AI ROI = (Value generated − Total program cost) ÷ Total program cost
The line most teams get wrong is program cost. Tool spend is the obvious part. Nathen pushed hard during the writing of the paper for enablement cost to be included, and he was right. Training, internal advocacy, the time senior engineers spend helping everyone else get good at this: it is real money, and leaving it out flatters your ROI until someone in finance notices.
On the value side, Nathen made a point we have kept repeating since. Value generated is ultimately decided by the customer, not by you. Shipped work is a proxy. The real question is whether your business KPIs improved, and in a complex organisation you are always changing several things at once. These are signals, not proofs. They get you much closer to the ground truth than a survey does, and the trend over time matters more than any single number.
What a spreadsheet cannot tell you
We were honest about the calculator’s limits on the call, and those limits are worth stating plainly, because they are the difference between a spreadsheet exercise and a measurement practice.
It has no granular attribution. You will not easily know how many of your merged PRs were genuinely AI-assisted. Not through labels applied by the AI tool, and not through manual tagging by developers, which is exactly the self-reported data the research tells you to distrust. Real attribution runs from prompt to session to commit to PR.
It is a snapshot. AI pricing changes constantly, teams change, project complexity changes. A number calculated in March describes March.
It shows aggregated rather than behavioural utilization. A spreadsheet will show you dormant seats. It will not tell you which of those people were supposed to be writing code.
Having data and having connected data are different things. That is the gap.
What the insights look like in practice
Sudheer shared his screen for the last third of the session and walked through a real sample report. A few findings landed harder than the rest.
Identity resolution comes first. One report showed 296 committers, and the CTO’s response was that the company does not have that many engineers. Bots, duplicate accounts, the same person committing under two Git identities. Until you clean that up, every per-engineer and per-PR number you calculate is wrong.
Cost per merged PR falls as adoption matures. It goes down, not up, as people get better at using the tools. That is the shape you want to see, and it is another argument for not optimising too early.
Cohorts diverge sharply. Split your engineers by AI usage pattern, and the daily-habit group ships in around 3.5 days where the dormant group takes 6.2. Roughly half the time, on the same kind of work.
Acceptance rate is a vanity metric. Every vendor dashboard tells you what percentage of suggestions engineers accepted. None tell you what portion of that accepted code made it into a commit, survived review, reached main, and was still in production thirty days later. Nathen asked the obvious follow-up question during the walkthrough: can you see the same numbers for human-written code? On a 500-engineer client sample, human-written code surviving in production at thirty days ran about 20% higher than AI-generated code.
The most uncomfortable finding was an AI code review agent that was not a gate at all. Two large clients had wired their AI reviewer to auto-merge any PR that came back with no comments. On large PRs the review ran slower than the merge, so the comments arrived after the code was already in. Everything looked green. The comments that did eventually come back were about vulnerabilities and SQL injections. The code survived in production, and so did the vulnerabilities. Nobody could have caught this by looking at either tool on its own, which is the argument for visibility across the whole toolchain rather than inside one vendor’s dashboard.
Credit exhaustion has a measurable cost. Some organizations show AI-heavy months followed by AI-light months, because developers burn their credits in the first few days and code manually for the rest. Their output tracks that pattern.
The questions the audience asked
Can you measure ROI without identifying AI-generated code?
Sudheer’s answer: ROI without AI attribution is just developer productivity, the thing companies have always measured as return per engineer. Google and Microsoft publish revenue per engineer. The reason AI ROI is a live question now is that AI spend is new, unpredictable, and additive. You are adding AI cost on top of human cost, and you want to know what the addition bought.
Nathen took it somewhere more useful. What engineering teams care about is delivering value to customers. Maybe you get there with more AI. Maybe you get there by writing less code. He encourages engineers to care about the business of their business, and to be clear what successfully delivering value actually means before optimising anything.
Does SURGE give a precise answer?
Nathen’s answer was the most valuable thing said in the hour, and it was a disclaimer. Measuring the ROI of AI adoption across an organisation is a genuinely complex problem with many variables. No framework will give a precise and accurate answer, and you should not expect one. What SURGE does is make sure you are accounting for more of the components, which means more signal in the noise. Watch the trend, not the snapshot.
He added the line we have quoted most since: the reason we have metrics is to start a conversation. A number on a dashboard tells you one thing. What matters is what you do about it, what behaviour or process or technology changes because of it.
Does this always end in cost-cutting?
No, and this surprised us. We built the recovery pillar expecting cost reduction conversations. What happened instead is that leaders looked at a 2x return and asked whether they should be investing more: widening access, raising per-developer token limits, extending AI beyond software developers. The number starts the conversation. The conversation does not have to be about cutting.
What to do in your next 30 days
You do not need a platform to start. You need a baseline, and you almost certainly do not have one.
Week 1: unify the invoices. Pull every AI tool invoice into one sheet. Committed spend against actual burn, per tool. If the gap is 30% or more, you have a renewal negotiation to prepare for.
Week 2: map spend to teams. Not to individuals, not to the whole org. Business unit or function. Whoever you would actually call if a number moved.
Week 3: separate your dormant seats into two lists. People who were never expected to write code, and people who are committing regularly with no AI activity. The first list is recoverable. The second is a coaching list.
Week 4: calculate cost per merged PR, and split it by cohort. Compare your daily-habit users against your rarely-active users on the same kind of work. If those two groups look identical, either your attribution is broken or your rollout is not working yet. Both are worth knowing.
Run it again the following month. The single number tells you little. The direction of travel tells you everything, which is why the loop matters more than the snapshot.
FAQ
What is the SURGE framework?
SURGE is a framework for measuring the ROI of AI in software engineering across five pillars: Spend, Utilization, Recovery, Gains, and Efficiency. It was written by Sudheer Bandaru, founder of Hivel, with Nathen Harvey, who leads DORA at Google Cloud. It sits on top of DORA and SPACE rather than replacing either, and it is explicit about what it does not claim.
How do you calculate the ROI of AI coding tools?
Subtract total program cost from the value generated, then divide by total program cost. Program cost must include enablement and training, not just licences and tokens. Value should be grounded in shipped output that survived production, not in self-reported time savings.
Why can’t I just use my AI vendor’s dashboard?
Vendor dashboards report usage: seats, tokens, suggestions accepted. They do not report output. None of them can tell you how many merged pull requests came from the tokens you bought, or what portion of accepted code survived review and stayed in production.
Is AI-generated code less reliable than human-written code?
On our data, AI-generated code carries roughly 3x the rework of human-written code, and on a 500-engineer client sample, human-written code surviving in production after thirty days ran about 20% higher. DORA’s 2025 research found software delivery instability rising alongside AI adoption, which points the same way.
Should I remove dormant AI licences to cut costs?
Not before you split them. An inactive seat belongs to someone who was never expected to write code, or to someone who codes regularly and has not adopted AI. The first is recoverable spend. The second is an enablement gap, and removing their access makes it permanent.
How long before AI investment pays back?
Expect a J-curve. Productivity dips before it rises, and on our data, first-year payback tends to land around month eight. Measuring at month three and defunding on what you see means cutting the investment at the bottom of the dip.
Can I measure AI ROI without a tool like Hivel?
For a first baseline, yes. Unified invoices, spend mapped to teams, dormant seats split into two lists, and cost per merged PR will get you a defensible starting number. What a spreadsheet cannot give you is commit-level attribution or behavioural utilization, and both of those are where the argument usually gets won or lost.